
The Daily Sentiment Indicator on Friday was up to 87%, which isn’t quite a record, but close. That forewarns that all the money is in the market and the players are feeling pretty good about their progress to date. It is not a forecaster of more good times to come. Quite the opposite. It means we’re exceptionally close to the end of this rally.
We’re had a countertrend market for over eight years now, a product of the central banks and their policies. However, those policies just aren’t working, anymore.
Deflation is taking hold and credit is starting to freeze up. I know of situations in which the very safe Canadian banks are starting to call in loans. Italian banks are about to implode, and Spain and Portugal should follow. Deutsche Bank has a capital level of less that 3% (similar to Lehman when it went under) and reportedly has derivatives exposure of more than $70 trillion (roughly the size of the world GDP). This is the private banking system at its worst.
My video on the Canadian banking dilemma is here.
So, while the US markets have gone to a new high, they won’t be there for very long. Only about 15% of stocks are reaching new highs. Breadth is tanking fast.
You’re also seeing the negative sentiment starting to dominate society in general. This is a trait of a market topping, climate turning colder, and authoritarianism taking hold. All these cycle traits have happened over and over again throughout history at regular intervals.
I’ll be posted more videos later this week on how these cycles affect the economy, climate, and social mood.
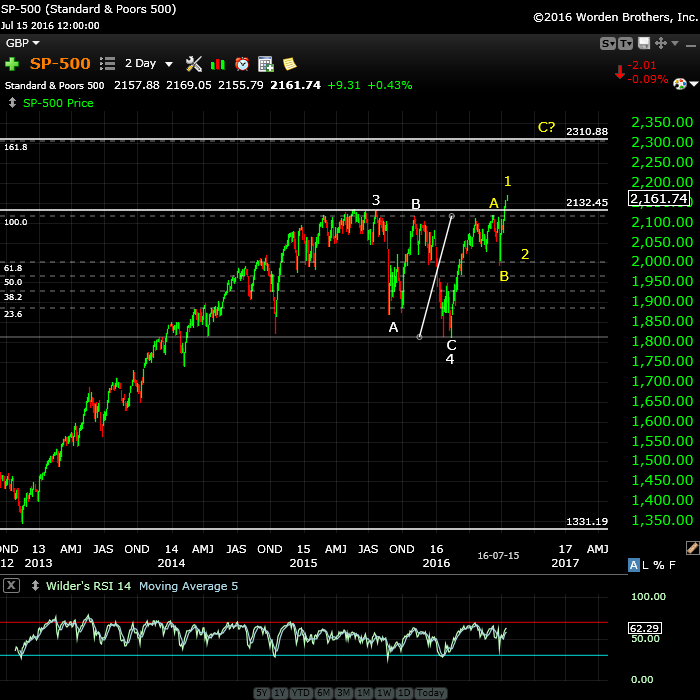
Above is the 2 day chart of the SP500. My count of a second wave has now changed (one thing Elliott Wave is excellent at is telling you very quickly when you’re wrong, and keeps you safe). It also tells me that while we have a spiky new high, the wave sequence is not quite complete. When it is, though, we’ll see a dramatic turn down. These are dangerous times to be in the market, so if you’re new to trading, it’s best to sit on the sidelines and wait for the big turn.
It’s also the middle of summer, so volume is exceedingly thin.
The NYSE should rise to a new high and that may be the indicator for the turn. Once one index hits a new high, they all do, typically.
I should be able to predict the turn here when we get close. My best guess now is that it won’t come until September, as I’ve been saying for some time. It could also extend into October. Those are historically the months for major tops. However, in the meantime, we’ll have some volatility.


First post, excellent! Thanks, Peter Temple and Worldcyclesinstitute.com for this information. Going to be an interesting week in the markets!
Valley,
I am seriously going to have to offer you a partnership …lol. It should be an interesting month or two … and then even more interesting after that. The financial situation globally is really starting to heat up (or cool down, depending upon how you look at it).
http://www.zerohedge.com/news/2016-07-16/war-coming-and-global-financial-situation-lot-worse-you-may-think
However, my siblings think that everything is normal … funny how that works. I’m the not-to-be-believed, not-to-be-supported black sheep.
btw, they live in Ontario, Canada, the sub-state with the highest debt per-capita in the world (twice that of California).
You could be the Lone Ranger, and I your trusted assistant, Valley-o. =)
Hi Peter, is there a tab for the paid service? Or will extras be posted here?
Regards
Hi Charles,
OK … it looks like you didn’t get upgraded after payment. You should now be able to log in again and have access. I just fixed it.
Hi Peter
Ill keep it simple ,
I asked Andy a question today in regards to the 60 year cycle and
the comparison to today’s market .
Everything i look at says the same thing .
Early august . i could show you 3 charts now that all blend together .
This market is now on very thin ice.
Fridays close is now the pivot able on the cash Dow.
this implies the market moves up and down surrounding Fridays close
before turning down .
relative weakness next week is expected .
wave 5 should be short lived once this minor 4 finishes which should be
shallow
Joe
Joe,
I agree that it’s on thin ice. However, the pattern has to play out. EW isn’t at all strong on time. Markets have never toppled in a summer month, so I expect this market to stay up here til September. We should know with time to spare.
“Markets have never toppled in a summer month”
did some research…there have been serious selloffs, e.g. 2015…however, to the best of my knowledge, a bull market high has not occurred during the summer months…since the rally since March 2009 has defied all expectations, could it’s termination?
Sell-offs, yes, but I meant major trend changes. The big one in 2015 was May, but it turned into a fourth wave (as we just found out recently).
understand…”the rally since March 2009 has defied all expectations, could it’s termination?”
Well, I don’t think so. In my experience, the pattern always has to play out. But there could always be a first time. 🙂
If I get some time this week, I’ll go through Phil Anderson’s (Secret of Real Estate and Banking) data from the 1800s and Puetz’s data as well, but it seems to me he did a chart somewhere showing months when turns were made. I’ll try to dig it up.
Hi Peter, August 1987 was a significant high. Market sold off then a failing rally prior to October Crash. Best regards, Dale
Dale,
Thanks. This is what you’re alluding to, I think. https://worldcyclesinstitute.com/forum/us-equities-and-futures/1987-crash/#p139
The difference is that we had 5 waves up, which we don’t have this time, and the “failing rally” was simply a second or B wave, which is typical of a first wave down.
“relative weakness next week is expected .
wave 5 should be short lived once this minor 4 finishes which should be shallow”
I’m in this camp. Everything is pointing to late July (FOMC) or soon afterward in my work.
I dont know if this will work
yet here is my graphical timing posted in an easy manner
http://imgur.com/a/HtxOQ
thanks…n
Thanks Joe
For the short term I have up till July 21 down till July 30 and up till august 4
Joe why u think next yr will be really good. If say market comes to say 1800 say in oct to nov. Wont it retrace only. 68 percent. But some are showing lower bounday 1700 this yr. And going to upper one 2300 and above next yr. Looks like that is what u are thinking. Thanks
Nice charts Joe, those are some of the best I have seen for a long time. Sept 23rd give or take a day or two. is one of the most important days we will see this year. I was not going to bring that date up until later Aug. Since you have Joe, I just wanted to confirm your possibility of a low at that time with what I have. Like all major cycle dates, I will see if it lines up with the technicals and my gut feeling before pulling the trigger.I still see a MAJOR GANN CYCLE Date for Dec 7th. I suspect it maybe a double bottom at that time. From their I will be dollar cost averaging back into the markets for some new all time highs in the market their after. I am still looking for gold to come down below $ 1000.00 Good luck every one.
Joe, appreciate your posts…a couple of things for your consideration…1966 was 50 years ago not 60…MRCI’s daily correlation for the 2016 DJIA with 1966 is -37% (http://www.mrci.com/special/ddji66.php)…as of July 15, 2016 virtually no correlation…be well! rotrot
One possible scenario however unlikely yet slightly entertaining:
Global equity markets rally into US election, with Hillary Clinton the clear favorite and happy days are here again the message presented. Then, in a surreal turn of events Donald Trump is elected with a last minute surge in voter dissatisfaction and the world is left with the prospect of 4 years of uncertain policy and untested leadership. Markets then fall “precipitously” in early 2017 to say 1900 on the SPX from maybe 2400. Doom and gloom will reign, but then Donald will steadily gain public esteem and the market will rally to 3000 by the end of his term, 2020.
Dave
I’m looking at Sept 28-29 for a low
the Sept 23 date is important but Sept 29-Oct 6th is
more indicative of a low .
rose
years ending in 7 are considered as death years
the market typically tops in the July October time frame
1987 to 2002 was 15 years adding 15 years you get 2017.
both those lows being October I’d look at Oct 2017 .
the mars Uranus cycle ends in Jan 2017 and then turns up
I have yet to calculate the high but rounglhy it’s a 2 year cycle
which would roughly correlate to Dec 2017- July 2018.
It’s just a rough calculation at this point .
I hesitated to post those charts yet since I have I’ll say
we should all have our own systems , I can’t emphasise that enough .
only risk what you can afford to lose .
I will be out of touch through this up coming cycle so keep
Peters updates in mind .
nothing works perfectly all the time.
watch the full and new moons through out the next few months
also I’d keep an eye on European news and events .
thanks Peter for all you have done
good luck to everyone
🙂
Can Andy’s turn date be considered a miss? Markets still pumping higher and higher. Maybe we need to wait another day though. Funny how when I start following someone’s analysis it stops working even if it had a great history!
When Andy gives 8/25-26 as cycle date, it’ll be the big one.
Friday, August 26 – Monday, August 29 could well be significant…however, it may not be the high some are expecting…
andre, just reviewed the charts and some proprietary data…believe I understand your inference…however, you may want to expand the time frame a bit…Friday, August 26 and Tuesday, August 30…thanks for prompting the ‘grey matter’ to consider various possibilities…be well! rotrot
Friday, August 26 through Tuesday, August 30
rotrot,
Thanks for the kind words. I will give this some thought and look for arguments.
Cheers,
André
Hi Peter, do you see gold turning lower now & if so when do you think it will bottom? Thanks again, best regards.
“Important Read- Open to All- Keeping Our Heads as Those About Us Lose Theirs”
Seven Sentinels, July 17, 2016
https://twitter.com/SevenSentinels/status/754797084444758016
rotrot,
thanks for this, particularly Kipling’s poem, which I’d forgotten about, but will post somewhere. It certainly strikes a cord with me, at any rate.
Make that “chord.” 🙂
through the years, I have emailed and mailed the poem to my three children whenever they were experiencing difficulties (with minor modifications for my daughter)…
That’s what being a dad should be all about. Deeply impressed.
A poster calling himself ‘pulp’ posted the following chart at Solarcycles site:
http://fxpro.ctrader.com/c/urg0n
I find the test of the up trend line from the underside ‘VERY INTERESTING’. That just provides added perspective to the hypothesis that we are ending this ramp up.
Bill Meridian views exactly like Joe. Correction in Late august to oct. then goes up in 2017 . something about years ending in 7, I think it will be good in beginning, but later on not so
reading Joe’s posts carefully causes me to believe that he expects the correction to begin in early August not “Late august”…
august 5 is the top, then it starts down, there is something between aug 18-25 which may be down. I was just talking generally , bill meridian also expects bottom till oct. or so
please post the link for Bill Meridien…thanks!
once again, this is not intended to be offensive…however, far too much inaccurate information gets posted to blogs/message boards that people take as gospel…below is the link to the July 18, 2016 interview Larry Pesavento conducted with Bill Meridian (12:20 mark)…accurate, factual representations are what we should all strive for…otherwise it is just noise…
https://www.youtube.com/watch?v=Vspqwjf6jDs&index=1&list=PL4904950210BFDEBE
don’t have a link to bill meridian. my friend heard his interview somewhere and told me
PALS this week:
Seasonals: small bear all week
Phase: big bear beginning Tuesday at open
Distance: big bull beginning Tuesday at open
Declination: small bull beginning Tuesday at open
Summary: PALS is mixed this week. I am short at moment. Will take profits quickly.
at the noon hour…markets are close to getting interesting!
rotrot, to paraphrase yourself:
‘once again, this is not intended to be offensive…however, far too much ‘obscure’ information gets posted to blogs/message boards’.
Unless you tell us ‘why’ things are going to get interesting and of course which time zone you are talking about the above comment is sadly true.
https://worldcyclesinstitute.com/periodicity-and-patterns/#comment-9773
Thx for the link rotrot but I still don’t get ‘why it’s interesting’. Perhaps it’s my 2 brain cells limitation.
I think I will be careful if I have to pass some information to help others
This is a 5 min chart of the DJIA since the 18th July high and I’ve drawn a ‘parallel lines’ channel which it seems to be currently adhering to. So….once the channel breaks we’ll have a better idea of where things are headed.
https://postimg.org/image/wv6nvvb01/
Beware that just before the actual break out there may well be a false one at the ‘opposite’ end.
retrot
thank you for the correction . I had it right the 1st time .
59 years ago was 1966 which was also the begining of a 16 year
bear market yet we still saw a new higher high in 1968 .
your note that there is no correlation I dont agree but the point
I was making was in terms of the dates . early August 1966 was a high
the correlation to 1987 as well as 1929 also lines up with an early August high . Peter said he was going to touch on Steve puetz so I’ll leave that info for him to lay out which is included yet not mentioned in my charts .
also I’ll agree with you about the noise or opinions.
I’m familiar with Larry’s work and I’ll check out the video .
bottom line , the market tends to repeat itself and at times defies logic .
someone made a point about the late July fed meeting .
has anyone done any studdies on market turns or tops / bottoms near
or at Fed meetings ? it’s work taking a look at . not to mention the 18-20 th following the end of the quarter as well as options expiries .
end of quarter March , April 20 high ? option expiry July 15 and market has stalled ? now we have a Fed meeting coming up . these are odd ball statistics but worth being aware of . I agree with Peter that the wave count matters but I also agree that timing matters . the odd ball statistics
should be included when a wave count is near completion .
as a general rule I avoid option expiry weeks I also tend to avoid Fed meeting yet I have a Fed meeting announcement method I follow which
tends to work . what you do is 3 minutes before the Fed announcement
you place an order to buy or sell 100 points above or below the market ( Dow ) I’ve never attempted both sides and it doesn’t always work yet more times then not the Fed makes announcent the market swings 100 points almost imeadiatly in one direction then reverses and goes the opposite .
the initial reaction is the fake out .so if it works this time i would trade against the initial reaction . hence a gap or thrust up I’d sell or a thrust down I’d buy . It’s a very very short term swing and it’s good for at least a 109 point move since the reversal typically takes out the initial reaction of the news .It’s easy to look that up if you know when the previous Fed meetings have been .
my bias is Aug 1-4 high and Sept 29 swing low .
the week of July 25 is also considered a weekly high.
if for some reason I’m wrong ?
for starters any high between Aug 1-4 is the important high .
if the market makes a high in that date range and proves me right
and then turns down . then that high must not be touched period .
even a .01 poke above and I’d call it a failure .
bottom line : the August 1-4 time frame must be the top and it also becomes the stop once the down turn is confirmed . there is absolutely no gray to this . It’s either right or wrong period and that high must not be broken period . even the very slightest poke above the August 1-4 high
if it is the high cannot be broken by even .01 points .
that is it
Joe
50 ,lol correction
thanks for the feedback…concur, timing is important!
Thanks Joe,
Very clear
I hate it that you went to “paid service” after I had been reading you to only 30 to 40 days! I wish you the best…and you get g.to charge what the market will bare! However, at 68 years of age I need more familiarity on what you are doing to rationalize paying $90 per month for your updates! I would think that there would be quite a few potential subscribers that fall into that category! Best wishes!
Fully understand. Right now is not the market you want to be in, anyway. Much better to wait until this thing tops. All the best, Ed. Thanks for the note.
It is a strange market. Andy’s turn dates didn’t even work this month. I was expecting a sharp down turn to start this week but still up and up. No pullback whatsoever.
Then we have changing patterns – diagonal, triangle, back to diagonal. My question with EW is : if we don’t know the pattern until after it already occurred, how do you profitably trade on that?
For example: The target high keeps going up so I guess we should be long for it to eventually hit that new high? But then we should see a big leg down soon? This old man is having a tough time on short term trades. Is it better just to sit on the sidelines?
Charlie,
I’ve been saying this is a really dangerous market. Diagonals and triangles can’t be pinned down until we at least have enough waves to determine the pattern. We have a wave up that’s part of something, just don’t know what yet. The smartest thing is to wait this out or wait until there’s something more sure. The big money is after the top. The key is to be flush enough to participate. Right now, we’ve got currencies moving against the US indices and that ends up being a mess. Sitting this out isn’t a bad idea.
Retrot
I double checked that chart ,
the chart is 1956 which was 60 years ago .
the 1956 dates are shown above this years dates .
Joe
Joe, thanks for the clarification…here is a link to MRCI’s daily correlation for the 2016 DJIA with 1956 (http://www.mrci.com/special/ddji56.php)…the August 2, 1956 high (523.33) is depicted…an online source indicates the stock market was closed on August 4 & 5, 1956…be well! rotrot
Here is what would make me the HAPPIEST MAN ON EARTH. (The bit in the top right hand rectangle occurring on the DJIA.)
https://postimg.org/image/47f1ujjsx/
I KNOW, I KNOW…..I’m the saddest man on earth….but it would be WONDERFUL!!
Did someone ask why? Oh because the up wave from 27th June low will then be a clear 5 waver and complete a bigger 5 waver from Feb low. Beyond that you’ll have to look for my earlier posts to understand.
Hi Peter
something weird seems to be going on and i cant put it out of my mind .
as mush as i favor this as a high coming in early august . the next swing high
would be in September as you have noted .
end of year ( qtr ) plus 19-20 days would be the jan 20 low
end of qtr march plus 19-20 days would be the april 20 high
end of qtr June plus 19-20 would be today july 20 .
another thought , low Jan 20 into april 20 was 63 trade days
april 20 plus 63 trade days would be today July 20 and this is a full moon .
its a Low to High to High count .
A drop now would mess up my work if it becomes a deep decline .
a sideways to shallow drop would be acceptable yet it is at these
times when something goes a miss and the entire plan screws up.
The Dow has made it to 18615 yet needs to poke above 18632
im leaving the market to decide this and i have no spec trades
on at all . 17700 is a key level .
lastly even if i turn out correct about the Aug 1-4 high
the early to mid Sept ( Sept 9-12th ) would be the secondary swing high
before a steep drop .
the Sept 28-29 swing low date doesn’t change if this is a topping process .
the fake out to me is going to be how this market trades over the next
2 weeks .
My concern is we just topped based on price yet based on timing
i really need to see the market continue to head higher minus a
few minor sideways to shallow decline .
Joe
Joe,
We have five waves up now as you no doubt know, so we’ll correct. Just don’t know how deep. Currencies are still headed down for the most part. I still think we’re all going to consolidate for one more blow off into September. That’s what it looks like to me.
Hi Joe,
Could you please share with us how you got the Dow 18632 target ? Thanks,
Purvez
id love to see that .
im not sure how well it fits with in elliott guidelines yet id love
to see it play out
Joe
Joe, hahaha!! I’m glad that it would make others happy too.
I was reading your qtr end + 19-20 day hypothesis and thinking ‘that’ too would be good.
Actually right this moment anything that provides a decline would be good. LOL.
I’m hoping Peter will let me know if the following sort of ‘post’ is inappropriate for this forum.
——————
I came across this site for the first time today:
https://www.socialeurope.eu/
There are a number of articles there that have ‘interesting’ headings. I’ve read the following 2 and would recommend them if you are interested in the EU.
https://www.socialeurope.eu/2016/07/ecb-dangerous-crossroad-berlin-endangers-qe/
https://www.socialeurope.eu/2016/05/the-case-for-germany-leaving-the-euro-gexit/
Absolutely fine. In fact, I’d encourage it! Just a note that over 2 links gets held up (its a spam thing) and I have to manually ok it, which is fine by me.
Yes sorry Peter. I’ve had similar problems with other sites. I’ll try and remember not to post more than 2 links to avoid giving you any ‘extra’ hassle.
I rarely have a need to post more than 1 links so I do tend to forget. My 2 cells limitation unfortunately.
Purvez,
It’s absolutely no hassle. I was more concerned that you’d think I didn’t like you (sigh) due to the delay. So link away … just wanted to let you know.
Thx Peter your comments are VERY MUCH appreciated.
Hi Peter
I was reading something on hemlines and stock prices
and it dawned on me that maybe it isn’t really stock prices versus
hemlines but cooler weather versus warmer weather ?
any thoughts on this ?
Joe
Well, that’s an interesting thought. It’s going to get cooler and hemlines are going to get longer, but I hadn’t equated the two. It’s more that society will become much more conservative, fabrics will go to more earth colors, and dress will become a lot less risqué. More authoritarianism, more civil wars …
Lululemon might be a new high in hemlines — they basically just got rid of the clothes. Not that I’m complaining or anything;)
PALS next few days:
Phase: bearish Friday, bullish next week
Distance: very bullish until next Wednesday
Declination: bullish until Friday, bearish Monday Tuesday, bullish Wed to Friday
Seasonals: bearish Friday, bullish next week
Summary: exited half short position with small loss today. Will look to buy spy calls on 1% or greater sell off Friday or Monday. Given price rise will keep size small. August features Olympics beginning on the 5th. Thanks, Peter Temple and Worldcyclesinstitute.com for keeping the flame of cycles burning bright.
Peter, check it out…..
http://www.marketwatch.com/story/consumers-win-as-visa-and-paypal-go-from-enemies-to-frenemies-2016-07-21?siteid=bigcharts&dist=bigcharts
Hi Ellen,
Really interesting article. Thanks. Credit is changing … numbers of transactions are slowing down – velocity of money has been tanking for quite a while now.
Will this change enable you to offer the additional option of credit card only for your private subscription?
Hi Ellen,
There are actually other ways that are working. I can send an invoice from Paypal that allows you to use a credit card without the need to have a Paypal account, I have one gentleman wiring me, and there’s the ability to send a cheque, which is just fine, as well. I set up the account now so you have instant access and the cheque finds its way here eventually. In Canada, there’s also the interac system (which is wonderful), which is email … and in the USA, I believe Western Union might be the best. There are other independent services, as well.
I don’t know how long the credit card Paypal thing will take to change things. So, in the meantime, if you’re interested in any of those alternatives, I’d be more than happy to log you in and work on the details after.
Hi Peter
Good points on the hemlines which i hadn’t thought of in regards to conservatism
and being less risque’. that makes complete sense .
I keep a plot on the sunspot cycle, i find it fascinating, its somewhat easier to predict
then the price of the Dow yet even to this day the scientific community has not figured it out to anything precise. ( compared to tides moon cycles etc )
purvez, i was listening to an interview with arch Crawford and he mentioned
the person who did the study about the end of qtr plus 19-20 days and that’s how i became aware of it . Earnings reports are another odd cycle to be aware of with
individual stocks . that study was done by mike parnez i think his name is.
he noticed that about 10 days ( might be 7 now ) before an earnings announcement
the individual stock will go up right into the news. the idea is you buy call options
1 week before and sell right as the news comes out ( you don’t wait for the announcement ) his first year doing that he had i think a 90 percent win loss percent. Fed meetings tend to be the same thing, prices rise into the news.
Options expiry can go either way yet prices tend to rise going into expiry more times then not . these are all very short term but its worth being aware of these trends .
My basis for the aug1-4th high date is based on several factors and to me
it is the most important turn date for the year. the comparison to 1956
and the 60 year cycle is just 1 reason .
the wave count that i see is based on closing prices of the cash dow .
the move from June 27 to July 1 i am labeling an A wave , maybe that changes
and becomes a 1st wave yet at this time its better labeled an A to me .
the drop from July 1 to july 5 is the B wave ( or 2 ) . this is closing prices
this rally up only had 3 waves up into the July 20 high so the recent drop
was a 4th wave of sorts with in wave C. im not sure wave 4 has ended
but either way the way i see it is we still have 1 more new high left before
the top at a minimum.
the reason i am labeling this as an A B C versus an impulse is the wave structure
is weak . using a bar chart . wave 1 Or A was 17063.08 to 18002.38 or 939.30 dow pts
up. The B wave Low at 17713.45 plus 939.30 would target 2 equal points move at
18652.75. <——— that is a price level to consider getting short . ( as long as we are into the aug1-4th date range .
a wave 3 should be the longest and strongest wave which had the move up from
the July 6 print low been a true 3rd wave we would have blown through that 18652.75 price and the Dow failed.
corrective waves travel in 3 wave movements, impulses in 5's.
no matter how i count this on a daily chart this move is not complete as i see it
yet i don't trust this market .
so far :
wave a or 1 : june 27-july 1
wave b or 2: july 1-july5-6 ( close price versus print price )
from july 5-6th we have minor waves I II III in place and maybe IV
If this minor V goes above 18652.75 it can be considered a completed
wave 3 yet failing to get above 18652.75 in any meaningful way is best
labeled wave C .
The moment of truth therefore is the market action after a test of the 18652.75
cash Dow price .
getting above the 18652.75 price level targets 18742.22
Calculating out wave price progressions to far in advance is nothing more
then an estimate because until you see the actual high or low you don't have
the real number to work with . waves 2 and 4 tend to be relative with each other
in some degree yet the rule of alternation should be considered.
wave 2 or b was simple so this wave 4 should be expected to be complex .
this is why i cant state minor wave 4 is over .
my initial call a week or so ago wave we had a problem with the 2 year cycle
versus the short term cycles . the 2 year cycle was flat into july 8 and then
started to turn up July 9. the short term cycles were pointing lower into July 21 .
i said from July 21 into Aug 4th both cycles pointed higher . Today is July 21
until price action proves the above correct it is to soon to say wave 4 is over.
food for thought .
more choppy action works for me
aug 1-4th is my key dates for the high
Joe
Correction
yesterday was july 21 and so far a possible 4th wave low on a closing
and print basis . today we are turning up ?
im not sure but the above explains my thoughts
Joe
I am totally with you Joe, but I am thinking about a low per the beginning of August and maybe we get the high already next week to end wave C. 😉 DJ target 18650±, ES 2200± and AEX (for the Dutch peeps here) 459,50±.
Cheers,
W
Bought lotto July 29 SPY puts after hours based on matching 5/20/15 with 4/20/16. Day 67 is 8/24/15 for the former and 7/25/16 for the latter.
US equities this week based upon hunch:
Deep sell off into Fed meeting on Wednesday. Then rebound into early August.
Early this week is mid Phase doldrums and Perigee is Wednesday. Possibilty of Fed rate rise may have market concerned.
New post live: https://worldcyclesinstitute.com/impending-tops/
This website is for educational purposes relating to Elliott Wave, natural cycles, and the Quantum Revolution (Great Awakening). I welcome questions or comments about any of these subjects. Due to a heavy schedule, I may not have the time to answer questions that relate to my area of expertise.
I reserve the right to remove any comment that is deemed negative, is unhelpful, or off-topic. Such comments may be removed.
Want to comment? You need to be logged in to comment. You can register here.