
We’re very near a top. I don’t think there’s any logical discussion to the contrary at this point. Society is turning decidedly negative, and the revolution is becoming more and more obvious to the “enlightened.”
As well, in an impending depression, commodities always drop first (oil and gas are a great example, as is the DOW transportation index), due to demand simply drying up. Banks always move to an expansionary monetary policy (The Secret Life of Real Estate and Banking, Phillip J. Anderson), and real estate morphs into a bubble. The bubbles almost always break in that order, followed by the demise of banks.
This time will not be different.
In fact, if you look to the bigger picture, as per my video entitled “Global Cooling,” this major cycle turn is in the midst of a 5 century top. In terms of Elliott Wave Theory, we’re in a Super Cycle turn, which is ushering in a major global revolution, because it’s doesn’t only affect the market, it affects the mood of humans, climate, health, the economy, and just about everything else that happens on this planet. As in other major revolutions, it’s revolt against the merchant class, which always takes advantage of everyone else.
I recently returned from New York City, where I spent a few days researching the work of Dr. Raymond H. Wheeler, in the MTA archives (Market Technicians Association) at Baruch College. There you can find Wheeler’s Big Book (when opened, it spans 7.5 feet with a depth of about 2,000 pages). It contains notations by hand of major events in a wide range of areas, along with climate trends of the period.
In the early to mid 1900s, Dr. Raymond Wheeler, with a team of 200 researchers, analyzed climate back 20 centuries to 600 BC. He used tree rings and sunspot records to plot both temperature and rainfall over that entire period.
He identified major climate cycles of 100, 170, 515, and 1030 years and predicted extreme weather at about the year 2000, followed by a turn colder and a long-term drought … and sure enough, that’s what seems to be happening. You can find his drought clock here. My video on Dr. Wheeler and his seasons is here.
The picture above shows Dr. Wheeler with “The Big Book,” over 2000 pages of all his data on climate cycles in which he correlated major events throughout history. He’s shown how climate cycles repeat with event patterns over and over again.
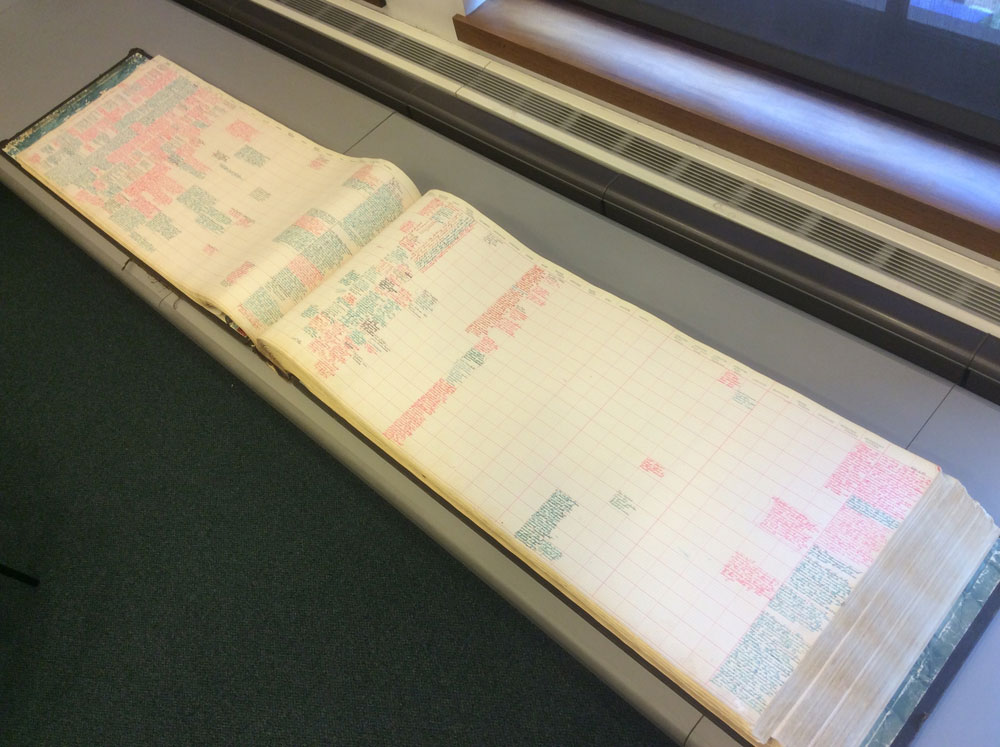
Above is a picture of The Big Book today.
Here’s what Dr. Wheeler wrote in the 1950s about the period we are entering now:
- The divisions of history long ago observed by historians—ancient, Medieval, and modern—are more than divisions of history. They are long climatic cycles.
- The sixth century BC, the first AD, the fifth AD, and the 10th and 15th were all natural turning points in history, marked each time by the decline and fall of civilizations the world over and the birth of a new era. In each case, these centuries terminated 500 year cycles in long range weather trends. Each was an exceptionally cold period in history..
- The six century BC, the fifth AD, and the 15th marked a end of the still longer cycle, on the order of 1000 years. These sentries were characterized by exceptionally profound reorganizations and revolutions in the civilizations of the world.
- Current events show that another world convulsion is occurring second only to
- the emergence of rational thought in the sixth century BC,
- the fall of Rome and other ancient civilizations in the 5th-century and the beginning of the medieval world based on feudalism, and
- the final collapse of the Middle Ages in the 15th-century. The current convulsion is comparable to the birth of Christianity in the first century and to the birth of the modern nation as a feudal principality in the ninth and 10 centuries.
- All of these reorganizations of society were marked by spurts in the evolution of democratic institutions.
But let’s get back to the market. The US market typically tops in the September/October timeframe. That’s what happened in 1929. It’s what happened in 1987, and again in 2007. Let’s take a look at the charts to see what the tops looked like:
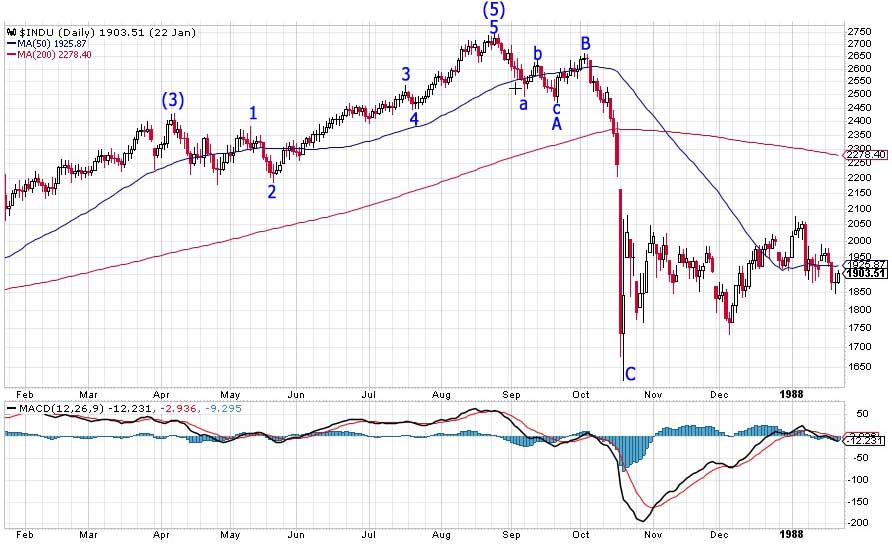
Above is a daily chart of the year leading up to the 1987 DOW top. This wave down was a fourth wave. It was an ABC corrective wave. As such, it came down in an A wave of 3 waves (the A wave down was in 5 waves but the 4th (or b wave) was way out of proportion to the tiny 2nd wave, and so this made it a “3”). Then we had a B wave, which retraced 62%, which is typical. The final wave down was unmistakably a C wave.
The wave leading up to the top was an ending wave of a set of motive waves that began in 1974. Ending waves are either in 5 waves or they’ll be a triangle of some sort (either a traditional fourth wave triangle, or a fifth wave ending diagonal).
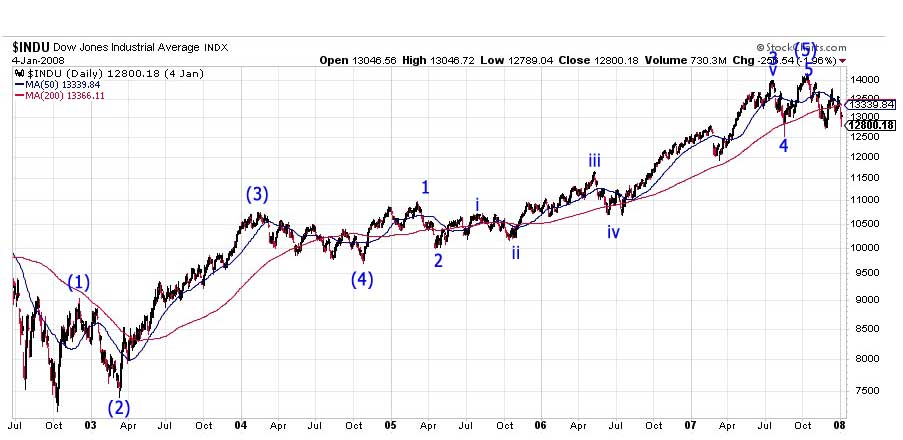
Above is a daily chart of the 5 year span leading up to the top of the 2007 DOW. The set of waves leading up to the top in this case, was also a five wave motive wave, which began after the drop in 1978. So, 1987 and 2007 had motive wave tops.
After the top, we have a first wave down and a retrace of 62% before a very much larger turn down, of course. That’s a very typical start of a trend down after a major top.
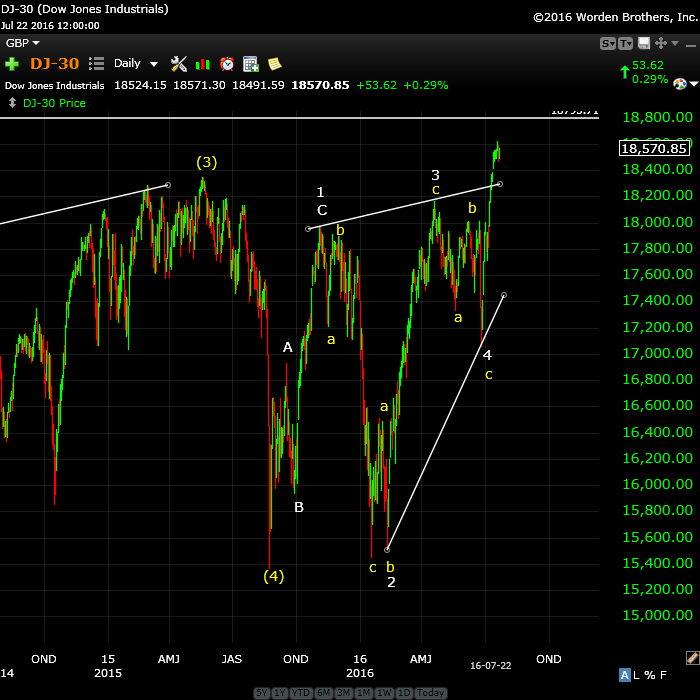
Above is the daily chart of the DOW today. This time in the DOW, we do not have a final wave up in 5 waves. We have waves in 3’s. So, we’re looking at finishing up what is so obviously a triangle of some type. The structure here is obviously (to me) an ending diagonal. That’s because we’re already had the fourth wave—(4) on the chart. So this is a fifth wave and the only triangle option for the full fifth wave is an ending diagonal.
Base on the chart above, we’ve all but finished the ending diagonal with the typical throw-over, but the other major indices are not finished yet. They have single waves in three waves, which means the structure is not complete. This means that in the DOW, we may get a second smaller ending diagonal to finish off the entire countertrend move up from 2009. This is a Super Cycle top that has been working its way up form the 1700s, so I’d expect this to be an historic ending before the crash of the century.
Note that we’re heading towards the same timeframe of September/October. You’ll find that the other major US indices seem to be beginning their ending diagonals, with only the first wave up formed (all the waves so far are in 3’s.


Thanks Peter, I like this weekly report ! best to you ….n
Peter,
I think you are absolutely correct. The rise of Trump and the Brexit show how pissed off the population is. Are you thinking we see a repeat of the crash of 87 or a more prolonged decline?
Hi Charlie,
Once we hit the top, I’m expecting the DOW to end up under $3K but it’s going to take a few years to get there.
If in the dow chart at the end, we’re in wave 5, which is due to develop as a three and take 2-3 more months, then I’m assuming you have us in a of 5, so that one impending top is dead ahead. Then we retrace a fair bit for b. And then we see c of 5 into the final highs. But then we lose the integrity of the upper trendline and wedge form, where we already have the “overthrow.” So either the overthrow isn’t part of the finale, or the top is much nearer, we are doing a compressed abc for 5, and the initial declines off the top won’t wait til fall. Can you please perhaps clarify on these issues? TIA!
Good report. I certainly agree with the article. Such long term cycles can be off by 10 or more years though, which is a lifetime in the market.
Is the climate actually cooling. I laugh whe the lead on the national news is dangerous heat dome covers the nation. What, it’s hot in July!? After a winter that led the news with snow storms in the winter. Wow, must be man made climatemchange. The left wing political types keep saying that last year, last month, yesterday was the hottest ever. Does anyone have a handle on temp for the last 10 years or so?
Kent,
If you go look at the Global Cooling video post, you’ll see a chart there of the last 18 years, or so. It’s flat.
Peter
Is it ok if i post a picture of the Dalton minimum compared to the present sunspot cycle ?
You are absolutely correct on your thoughts on this subject .
Joe
Absolutely. I would put in the forum, if you’re signed up. Then it will last.
Excellent post, Peter! Thanks for this information. The big book looks fascinating.
valley,
I’m going to share some of the charts soon. I have a bit of work to do on them first. The one of the top of the Roman Empire is kind of cool … actually, it’s hot, but you know what I mean.
Valley,
How is your PALS system for this week.
Bill
Phase: – until Friday at noon
Distance: – after Wed open (perigee)
Declination: + after Tuesday close (three days after S to N equatorial crossing)
Seasonals: + until Friday open
Summary: mixed PALS, guessing price will sell off during Fed meeting, and then rally Friday. So will sell my bearish position and buy SPY calls if market sells off by Thursday close.
I agree Valley there is something in the air.
I think we’re going to be stuck in a range until Yellen on Wednesday.
Peter
ill sign up to the forum
and post there and ill also post a link to where i get my data from
I’ve followed the guy for a very long time and he keeps a lot of data
Joe
I saw this nice chart on twitter
https://www.tradingview.com/x/U38x7YBo/
Hi Peter
I added the Dalton minimum chart here :
https://worldcyclesinstitute.com/forum/climate/adapt-2030/#p140
It fits with your write up on the you tube video which i’am now
going to watch .
Links added for typical sunspot cycle overlays along with
where i get my data from .
Joe
Thanks, Joe!
ES appears to be in ending diagonal since the 14th of July.
The exit seems imminent.
Correct! But I put the end of it at the throw-over (7172.50), so we’ve actually finished it.
I agree, but it’s still not broken
I don’t know what that means.
Looks good now
Finally, not yet
Hi Peter
A few thoughts
Sox index , 50 % retrace of the 2000-late 2008 bear market sits just a few
points above todays highs at 764.82
Nasdaq 100 NDX May be peaking in wave D ? its looking that way yet tough to say .
biotech index BTK is flirting with the .382 retrace of the high to low drop
from mid last year to early this year .
Banking index bkx flirting with its 50 % retrace of last years high to low drop
I still prefer a top of importance aug1-4 yet now im wondering which area
of the market . i prefer the dow yet it should show up somewhere at the least
Joe
Todays clean up
NVDA Cutting 1/3
AEIS Cutting 1/3
CNC Closing
CMA Closing
LRCX Closing .
Risk reduction by 8.5 %
Stock reduction 10 %
Some are Hard to sell since Ive held them for a long time .
Plan is to Re allocate in January .
Odd ball thoughts are Trump begins rising in the polls in January
the market sells off on the fear of a trump presidency .
Its the Cycle though i am making my decision on since politics
are not really going to move the market .
Joe
Correction
Trump begins rising in polls in august , cycles are calling for a change of trend
might as well play on the fear .
had a few more sells
a little more than 14 % taken out of market today .
Guess we will see how this market holds up or not
from now till year end .
Im probably a little early on sells yet risk reduction
was my plan.
TXN was reduced by 44 %
Teva closed , Reason ? my dividend is being taxed at 100 % even though
i own the stock in tax deferred account .
Done with portfolio adjustments .
Joe
Well done!
LLTC up 28 % today !
🙂
people going Nuts
http://www.marketwatch.com/story/linear-technologys-stock-soars-toward-biggest-ever-gain-after-report-of-buyout-talks-2016-07-26?siteid=yhoof2
The overall market ( indu + tran + spx + oex + ndx + sox ) has been
stuck in a range since july 14 which was also the momentum high .
many indicators are near overbought extremes and turned down
yesterday .
the actual print high was july 20th yet the closing high was july 22 .
Daily close only chart is a triangular formation .
Today is the 9th trading day of this sideways action .
the 5 day and 10 day advance decline lines peaked july 12th
the 10 day trin is on the verge of giving a sell signal .
the longer term oscillators have peaked and turned down
the very short term oscillator peaked July 14 and is neutral.
18772-18889 is now the long term important resistance on the cash dow.
a break above there implies mush mush higher prices .
aug1-4 is the next key date ( i favor it as a high )
Sept 8th-12th is now showing up as is Aug 14th .
those dates correspond to different methods .
key dates for a steep drop
aug 1-4 high sept 29 low .shows up in most methods .
a high now and a low aug 23rd and sept 8th would imply
a bullish outcome yet i just don’t agree at this point .
3 minutes before the fed ill watch for the whip saw and decide
or not , the initial news is typically the fake out .
this morning looks like its all day traders if so
we start heading higher .
nap time
Hi Joe,
Still I am thinking of begin Aug as a shortterm bottom (not that deep IMHO)… I cannot wait to see what will happen. 🙂 My guess btw, is based on cycles that I follow and some EW of course. 😉
Cheers,
W
PS: 14 August, I have a date near that one as well for a more significant turn. 😉
Curious as to what you consider a sell signal on 10 day trin, Joe…
Bloomberg noted today that the nine day tight oscillation we’ve had is the longest in 21 years. Today was the ninth day the SP500 has closed less than 0.5% from it’s previous close. Daily Sentiment is at 81% (extremely high bullish) and periods of low volatility lead to periods of just the opposite.
+1 Peet! Volatility is my friend! 🙂
My Aug 12 Vix calls need some vol =)
Peter George
The 10 Day Trin is nothing more than a 10 day simple moving average of the
daily $trin .
This indicator when used in combination with the 5 day and 10 day advance decline line will give you the best results , used alone its very helpful yet like any indicator
they have their bad moments .
The 10 day Trin will oscillate between just below 1.00 and above 1.40 in a normal
bull or bear market . yes it can and does go outside these parameters yet i am keeping it simple.
The rule is when the 10 day trin closes below 1.00 it gives an overbought reading
and when you get a close back above 1.00 that becomes the sell signal .
on the other side .
when the 10 day trin closes above 1.40 it gives an oversold reading
( keep in mind oversold should also be showing up in the advance decline line and
the 14 day rsi below 30 is preferred )
when the 10 day trin then closes back below 1.40 it gives a buy signal .
those parameters may seem small yet they are not .
I have followed this indicator since 1997 as well as the 10 day advance decline line .
To me they are my favorite and most trusted indicators .
The 10 and 5 day advance decline line being number 1 the 10 trin number 2
5 , 10, 20 day oscillator’s 1 1/2 . i use all 3 along with timing and Elliott wave theory.
the 20 day oscillator is the most consistent , id have to look up the math on how its formulated but i could find it if your interested .
Joe
Hi Joe,
Could you please explain to me how you use the 10 day and 5 day advance decline line ? Thanks
Joe,
After the markets action today, my cycle (minor) bottom seems to be early. That leaves the beginning of August timeframe to be a top probably.
If we would have got to my price target for AEX (459,50) today, it would have been a top now and a low at the beginning of August. But right now, I am switching to your side, so GOGOGOGO JOE! 🙂 🙂 🙂
Cheers,
W
Gold bug
i am not going to be around much come Tuesday next week
so ill answer your question yet just be aware of it .
i use the $add with a 5 day as well as 10 day simple moving average .
if you create that chart what you will see is a range bound movement.
it has gone on for years . all i do is mark the historical average highs and lows
and then when i see the 5 day or 10 day averages into the upper or lower
ranges i look call those overbought or oversold readings .
there is a little more to it then that but that is the basics .
the 5 day turns earlier then the 10 day , yet i initially learned this using the 10 moving average along with the 10 day trin so i use them both .
i also then use timing with this indicator .
as peter has mentioned , we need to have our own systems we use
and the key to any system is excepting its flaws when they come
and to have a very good longer term handle on them , the good and the bad .
im sticking to aug 1-4th .
a few thoughts
Aug 24 2015 – Feb 11 2016 , 118 trade days , low to low to high ? = Monday Aug 1st.
Hard to imagine the Dow at a new high come Monday yet maybe the NASDAQ 100 ?
next
may 19-june 27 26 trade days low to low to high ? = Wednesday Aug 3rd .
July 6-july 20 10 trade days Low to high to high ? = Wednesday Aug 3rd .
the time frames fit yet i would also want a new high in the Dow
Odd thoughts
Trading Days
June 27 low to July 1 high = 4 up days
July 1 high to July 6 low = 2 down days ( 50 % retrace in time ) ( print low not a closing low )
July 6 low to July 20 high = 10 up days
July 20 high to today has been 6 trade days ( 60% retrace )
keep in mind that this retracement has lasted 3 times longer then the previous
and yet has been less of a point drop so far .
I focus on the Dow for my timing and indicators because i have a large data base on it .
it looks to me like next week will be important .
for those who are new ill put it to you in simple terms since come Tuesday
ill be away and i don’t want you to blindly take my thoughts .
if based on all i have said , the market peaks into this Aug 1-4th time frame
and i m actually proven correct we would first see a minor 5 waves down
followed by a 3 wave sing back up . peter has said this so many times we should
all remember .
if next week is a high and we get the minor 5 down followed by a minor 3 waves up .
then it would be the following week for the drop .
last detail .
lets say Wednesday becomes the top and market drops in 5 waves intra day wed or Thurs.
when would the bounce come ? Thurs or Friday ?
who wants to take a trade on a Friday ? that is a personal decision we all have to make .
I would risk a smaller amount up front when trying to catch a top and i would
add to that risk once the turn down is confirmed .
i wont be around to confirm this top if it comes next week .
we all have to use our individual systems and our risks are our own to accept or not.
I m bearish based on my system yet if i m wrong it is my loss based on my error .
keep that in mind ,
Joe
Joe,
From my perspective, basically correct as to a turn. This is the longest, tightest sideways movement in 21 years (as of yesterday), so maybe we broke a further record today. Anyway, we need to get to a minimal new top (SPX and the like) before turning and it looks like it will be early next week. But this won’t be the final top. As I’ve also said for the longest time, this has to be an ending diagonal (there aren’t any other patterns that fit what we’re seeing that I know of). So we’ve got a few more slow gyrations before the top, which I still peg in the Sept/Oct timeframe.
But next week should amount to a good trade down, nonetheless. It should be a zigzag.
Hi Joe
There is no $add, do you mean $nyad ? Thanks
“Symmetry Tells the Story”
https://astrologyforganntraders.wordpress.com/2016/07/29/symmetry-tells-the-story/
Bill Meridian and Olga Morales collaborate…approximately two months ago Meridian forecast that the stock market would crest in mid-July…subsequently, Meridian specifically identified July 20…in her post, Morales clearly references “The current High in S&P 500” which occurred on July 20…
Music tells the story.
We all know music is a vibration. and the e-tone is special. Let’s assume 5/20-8/24 and 8/24-11/3 were significant cycles.
We calculate the natural log on the number of days, add the e-tone and calculate the antilog. Now we have a vibration. To get more dates we divide it in 16 parts.
Both cycles give 8/1. This is Olga morales’s date. I can hear music….
“Expected Dates for S&P 500” – Olga Morales, July 25, 2016
18th Aug
6th Sept
21st Sept
6th Oct
22nd Oct
10th Nov
21st Nov
5th Dec
24th Dec
https://twitter.com/allerotrot/status/757503252065882113
SPX just made a new high…
Peter
i have been digging into the Dow weightings all day . my issue is how can i be so right
and yet be so wrong at the same time . The strength of the Dow is showing in only
42.25 % of its weightings . The spx hit a new high today which fits and the nasdaq 100
made a new high which i Don’t prefer.
the reason i am writing though is in regard to Andy’s turn date of July 15 .
I am always a skeptic of anyone’s timing until i see in real time their accuracy .
his June 29 turn i must consider as a low , his July 15th date i must consider as a high . the print high on the NYA was July 14th , the momentum indicators peaked
July 12-14th , advance decline line also fits into this .
so from what I’ve seen so far Andy’s work must be respected !!!
according to martin Armstrong, his view is the indexes are broken down
with the NASDAQ the little guy , the Spx the institutions hedge funds etc
and the Dow is the big money. the Dow is failing which if i take Armstrong work
at face value implies the big money is exiting or at a minimum reducing their risk .
2191 on spx is possible 10925 on the NYA possible . Dow 18652 also a fair possibility
the 5 day and 10 day advance decline lines turned up today .
i am seeing many many divergences yet nothing that says the market is done.
it certainly feels done though .
Your Point on the ending diagonal i respect and the sett time period
would make sense .
my issue though is my own Planetary based timing and it lines up perfectly
with a high next week . if you are correct then a late august low as well
as probably an early Sept low would be in the cards .
this in my eyes would be the wave 4 low near aug 23 rd Sept 1
a 1-2 type wave move with wave 2 on Sept 8th . that would fit in line
with a failure of the bearish cycle yet at this point in time i just
cant go with it until we get there .
the bearish cycle beginning next week has one concern that is august 14th .
that day is probably going to be a high of sorts .
the rest of it timing wise is straight forward .
a high Aug 1-4th and a panicky swing low Sept 28th-29th .
The shorter term i am also considering which is a similar theme on a shorter
term basis , a high aug 1-4 a secondary high aug 14th and a panicky yet less
intense swing low 28th. roughly id say watch the market 55 hours before
the new moons . the cycle usually begins on or near the new moon before
the solar eclipse then runs into the solar eclipse in general .
that would be a 20 trading day decline .
also if i was to put the pieces together in regards to the end of qtr ideas of
tops and bottoms , these also dove tale together with my other work .
end of qtr dec 2015 plus 19-20 days was the jan 2016 low
end of qtr march was the april 20 high .
end of qtr june plus 20 day was the july 20 high and is where the dow
began diverging .
end of qtr sept plus 19-20 days is Oct 20th , this time period also correlates
with the end of the puetz cycle ( high or low ) ( i think Oct 6-17th to be precise )
end of qtr dec 2016 plus 19-20 days is jan 20th and is also the exact day of the
end of the mars Uranus cycle and is also inauguration day for the next USA president .
i am still bothered as i began this post with how can i be so right and yet
be so wrong at the same time . i do not like the Dow failing .
something is amiss which is why i dug into the Dow weightings today .
Bottom line : im open to what ever the market brings next week and my bias
is decidedly down until im proven wrong .
if we fail to take out the June lows id see it as a problem .
taking out the June lows to me targets the January lows .
Considering the divergences , maybe the dow heads higher as the rest of the market stalls or falls . that would tend to put everything back in sync even if it sounds out of line.
Im still looking for a top next week but my confidence is now not nearly as strong
with a failing dow .
Joe
Yeah, I would expect this ending diagonal to top about 2180-2 and that could be Monday. So this would be the first wave top. I’ll post on the weekend.
You’re correct about Andy’s past turns. However, the market has been going sideways, so they’re pretty subtle this month.
correction , august 14th was a typo .
aug 18th is the full moon as well as the Thursday before option expiry .
full moon tops would be the theme and new moon lows also the theme
yet the first high should still be next week .
nuff said .
Looking for 2011 analogue. Positioned short and expecting 4 to 5 % lower prices next 14 days.
NYSE vibration price.
All time low 347.77. Take natural log, add 3,4777 and anti-log. If done right you get 11263. As long as NYSE stays below (now 10786.) the trend is down. For a new bull move this line must be crossed.
May high 11228, just 0,3 percent from this level.
Typo.
May high was 11255, just 8 points from the vibration. Suggests this really was the high.
The 1982 low in S&P was 102.39.
Take log, add PI and anti-log. Now we have 2369. May this is why S&p wants up and NYSE can’t.
Still some 200 points room left. So this is not about manipulation or CB intervention; this is about vibrations.
A major high around August 11-12. That would be 34 years after August 1982.
So S&P has time and price-room left.
S&P doesn’t have to go to the vibration. But it gives an idea where we are.
Before you Judge please realize when we do the calculation above wit e (Eulers constant) we get 1552. The 2007 high was 1576, 24 points from the vibration. 24 is significant.
Last one.
DJ 1932 low 40,56. Take log, add 6.18 and anti log. Gives 19590. Suggests DJ also has some room left.
Market likes round numbers, 20000 perhaps? Or 2400 on Spx.
Market also likes squared numbers; 2401/19881. We’ll see. Main message was that there is still some room up.
Cheers,
André
New post live: https://worldcyclesinstitute.com/ending-diagonals/
This website is for educational purposes relating to Elliott Wave, natural cycles, and the Quantum Revolution (Great Awakening). I welcome questions or comments about any of these subjects. Due to a heavy schedule, I may not have the time to answer questions that relate to my area of expertise.
I reserve the right to remove any comment that is deemed negative, is unhelpful, or off-topic. Such comments may be removed.
Want to comment? You need to be logged in to comment. You can register here.