
“To begin with, diagonal triangles are very rare.” Robert Prechter, The Elliott Wave Theorist, August 5, 2009
Perhaps not as rare as he made out. Certainly not in the past year or so. Ending diagonals been appearing with some frequency. We had one at the bottom of the A wave in gold, although not with a throw-over (which incidentally, isn’t absolutely required).
But now, I see them appearing everywhere. Case in point:
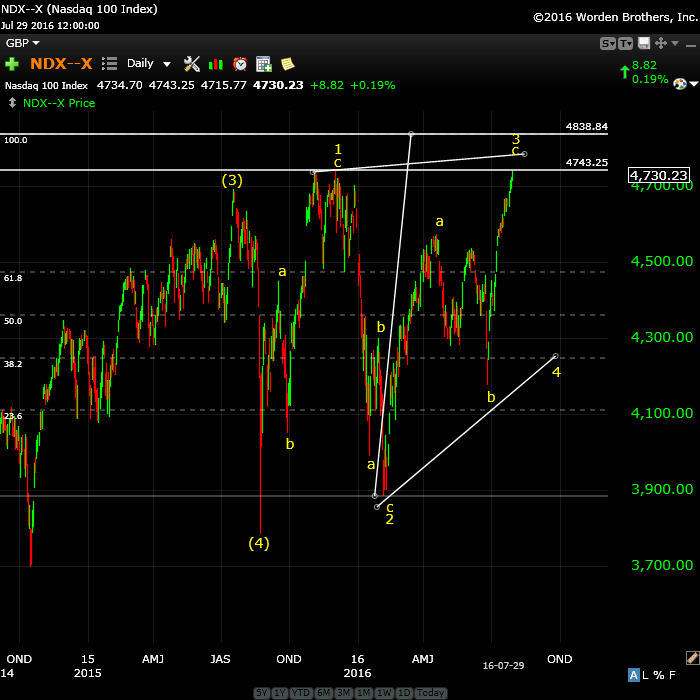
Above is the daily chart of NDX (the Nasdaq 100 index). I’ve labelled the potential ending diagonal, which would now be in its 3rd wave. One of the stipulations of ending diagonals is that the third wave can’t be the shortest, but it also can’t be longer than the first wave. So, this third wave in progress in NDX cannot move above the ~4838.84 level (horizontal line on the chart above).
All the waves so far are in 3’s. The fourth wave down will be next and it will have to trace out a wave is a subset of 3 waves. The location of “4” on the chart is approximate. A fifth wave up to a new high would follow.
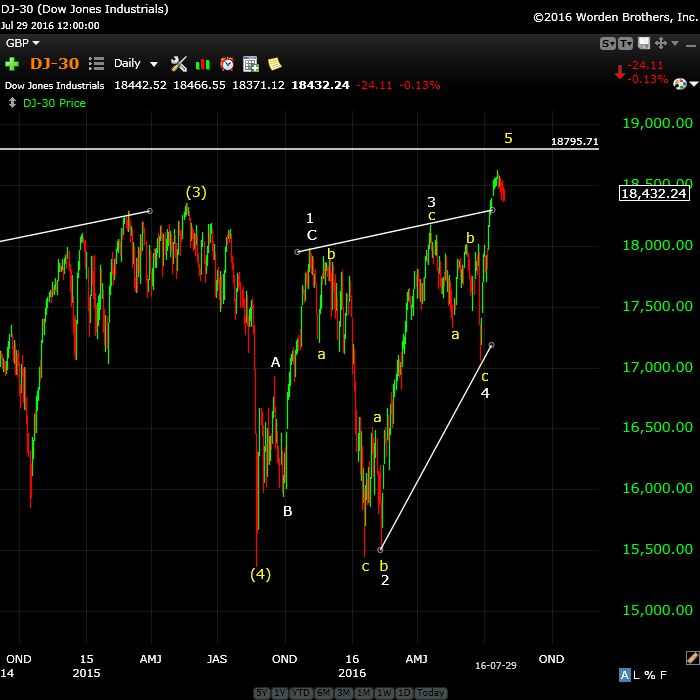
Above is the daily chart of the DOW. I put the DOW in a more advanced version of an ending diagonal. You can see that it’s finishing off a fifth wave. All the subwaves are in 3’s. However, it’s not at a new high (the horizontal line) and I would expect it to get there. There is also the potential that it could trace out a smaller triangle (diagonal?) within that fifth wave.
We’re not done, by any means, but I see clues as to how we may finish up. This is one of those ending diagonal ducks that’s starting to quack like one.
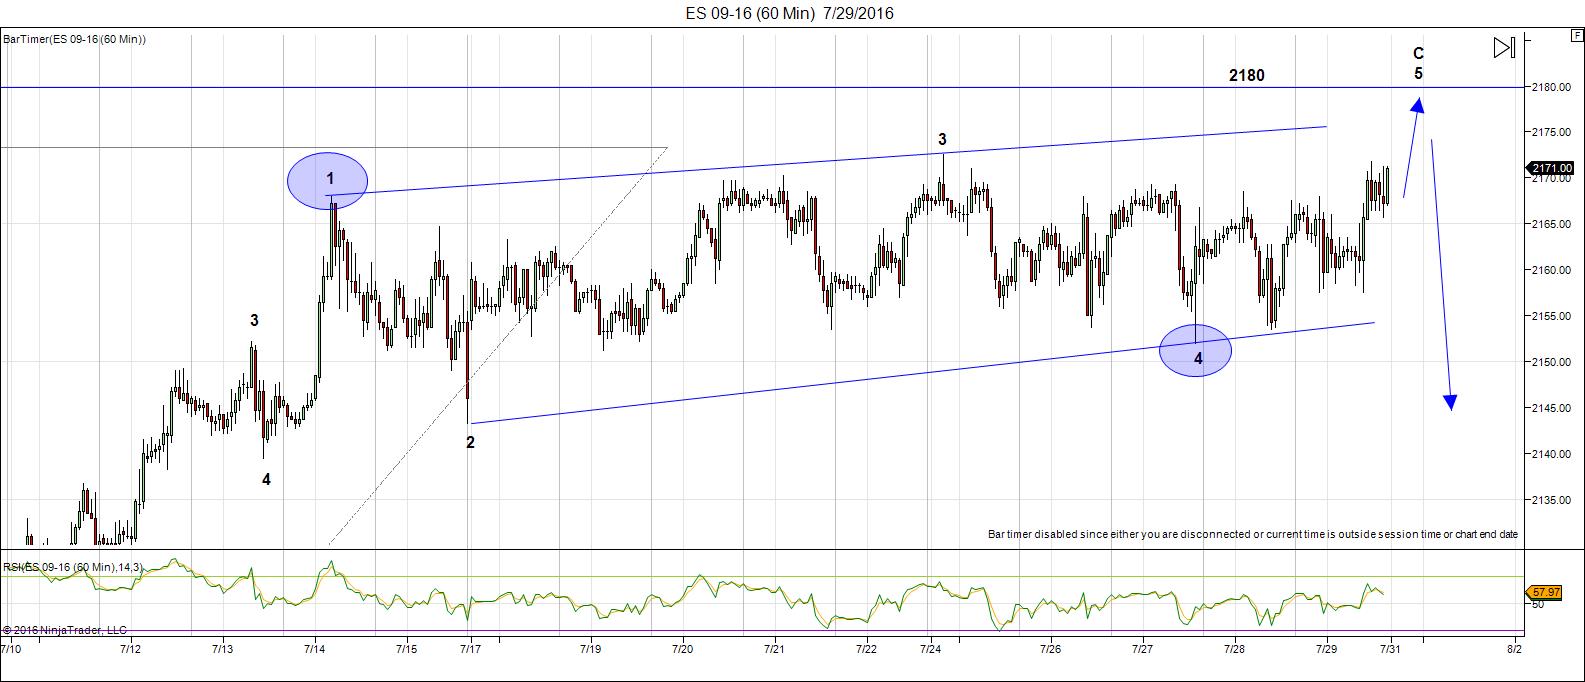
Above is the 60 minute chart of ES (SP500 emini futures). Since July 15, when we had an Andy Pancholi cycle turn, the C wave of this three wave move up from June 27 has been tracing out an ending diagonal. Incidentally, the other blue circle on the screen denotes the next Andy Pancholi cycle turn.
We are in the final wave of the pattern. While I have labelled the chart with a potential target of 2180 (a secondary measurement gives a target of 2182), ending diagonals by their very nature, don’t have reliable targets for the final wave up. It generally completes a throw-over (a wave extending above the trendline (in a bull market) and all waves are in 3’s. The pattern should be a 3-3-3-3-3 pattern upon completion.
And ending diagonal is just that. However, the SP500 (and be extension ES) does not have a valid ending wave, suggesting there is more to come. I’m personally envisioning an ending diagonal within the final wave on all these indices. We’ll have to see what happens.
That would fall in line with my prognosis for a September top.


Thanks Peter Temple. Will be looking for 3s and 5s. Worldcyclesinstitute.com is best site for learning Elliot Wave.
My best guess is that last week was due to DNC convention in Philly and positive earnings week both of which are over. 4% to 6% off next 7 trading days my guess (tho’ may ring bell at 2200 on Spx first.
My impression of markets last year is that they are becoming more Las Vegas like with random gaps up and down to make swing trading close to impossible. Given the internationalization of the futures market and its easy access to traders around the globe who have a few thousand dollars to obtain margin for one contract and the abundance of futures brokers, software vendors, and the like, the new normal may be market moves designed to confound anyone using traditional methods (EW, Wycoff, Gann, MA crossovers).
Valley,
It’s certainly been that way for currency pairs lately. They’re now almost all in triangles and so this may go on for a little while longer. However, low volatility eventually leads to high volatility … the importance of patience to trading (sigh).
True, keeping in the game by keeping position sizes small and trading a reliable system according to a set of rules and less on assumptions that “hey this market it too high” or “wow this selling will continue to much lower levels” may be the best tactic.
Doesn’t look like we have a turn down anytime soon. The ES is rocking n rolling like usual. I’m wondering if anything can stop this Bull Train. How will sentiment change when we get worse and worse news and the US markets shrug it off and head higher?
Valley,
How is your PALS system next week.
Bill
Hi Bill,
This week features the best declination of the month which often has gaps to up side. Apogee is next week so no weakness there. Phase is also very bullish after mid day tomorrow. Seasonals are very bearish all week. So, I am playing this as a 24 hour put option looking to buy calls tomorrow if we get below 2150. Keeping position size small as price is acting bullish yet August is one of the weakest price months for equities.
This has worked. I sold puts at 2145. Bought small call position at 2145. Looking for gap up into Friday’s close with above 2200 (possibly way above).
Peter where do you see the Dow falling to when we get wave 2 down in the ES? It is ahead of the ES with regards to the ending triangle so it’s difficult to see.
I don’t have an easy answer to that question. Great question, though. 🙂
Let me add that it really can’t go below 17K or there’s something else going on that what it looks like at the moment.
I share that thought. I’d think somewhere in the region of 17500 would a reasonable target based on what the ES is expected to do. Dax had a spike to the pre-Brexit high and dropped hard which I kind of expected but didn’t trade unfortunately.
Hi Peter, Im new to this site, have been following for only a few months. Just wondering are we still waiting for s&p 500 to reach 2180 before the turn down? Thanks so much.
Hi Corrine,
There’s a little more to it than that, but essentially, yes.
Peet,
I still don’t see how the DJ can be in the fifth wave already while others are in the third. Timing wise this might get difficult right???
Look at Europe, our bottom was @ the 11th of February (lower than the August 24th bottom) and if we are in a normal 5 waver UP (which could be the case, but it is not my preffered count), than it might take many more months than just August – September to finish UP right??? So somehow, something is not right because I don’t see America crash and Europe go finish a 5 waver UP in december or something…
Maybe you can check the DAX and compare it? I feel like your count is correct, but the difference between the DJ and NDX feels strange to me… And the difference between America and Europe is even more strange…
Cheers,
W
I’m an EW moron. You’ve likely heard my mantra: “Trade what you see, not what you think.”
So … you want to talk fundamentals, or even mix them with technical, you are definitely barking up the wrong tree. 🙂
Hi Peter
Very good explanation on ending diagonal triangles.
Today the dow has an outside day to the downside .
a higher high then Friday and a lower low then Friday.
This week is still important as i see it .
my best guess is ill be lightly short Wednesdays close
the sideways move in the broad market ( indu tran spx oex ndx sox ) all added together
is still in tack . the high on july 20 is still holding ( probably because of the dow )
July 6 low july 20 high ( 10 trade days low to high ) july 20 plus 10 trade days is
Wednesday august 3rd .
May 19 low June 27 low , 26 day low to low , June 27 plus 26 trade days
is Wednesday august 3rd .
food for thought on this same chart of the indexes added together .
the daily close only chart today broke to the downside ( the market is not closed yet )
yet it broke down from a triangle pattern ( this is a bearish sign )
hourly chart of this same chart of all indexes added together .
this is a difficult call in advance because the time lines move at times .
yet food for thought as we come into Wednesday and then who ever is reading this
double check my math .
july 21 1130 usa west coast time ( hourly bar ) low
july 28 0630 hourly bar low .
30 trading hours
july 28 0630 low plus 30 trading hours = 0830 Wednesday !
using a calendar . 6 days 19 hours low to low
july 28 0630 plus 6 days 19 hours =Aug 4th 0630 ( The open )
Yes its speculative yet if the cycles im looking at prove correct
then this is all lining up .
the Dow failure is still a problem , the truth will show up in
the rest of the market .
my bias is to be lightly short before this week is over
and my risk tolerance i can handle .
consider the hourly times lines as a rough approximate
The following week ( next week would have to show downside
action or id call it a failure )
good luck 🙂
wazzup
your concerns are also mine , that is the risk at the moment .
are we topping ? or are we beginning a new leg to the upside ?
sounds strange yet these markets can and do extend from time to time
and we sit back in awe going what the hell is going on .
wish i had the answer .
i m packing today and heading to work in the morning yet wish
i was going to be able to follow this market more closely .
its how it goes when you work away from home .
Joe
Joe!
You are a good man, just like Peet! Ty for sharing the interesting stuff and lets see what our begin of august turndate will do. Right now it looks like a top. 😉
Cheers,
W
PS: to bad you have to go so good luck with the job Joe!
Spiral Cumulative Bot
https://twitter.com/mjmateer/status/758011434404118528
Diagonal triangle,, take a look at wheat.
look at the NYSE Composite Index ($NYA on StockCharts)…May 2015 high (11,254.87)…July 2016 high (10,815.43)…obviously not confirming the froth in the other indices…
Worth a quick read – Basically SnP 2150 is a key level.
http://www.zerohedge.com/news/2016-08-02/1-10000-year-event-jpm-head-quant-explains-why-sp-refuses-sell
Bought Spy calls at 2150 for bounce into Friday. Don’t want to miss post NM and post far North declination potential gap higher. Due for pull back but have to trade system and these two factors of PALS are short term very bullish. If we get rally will sell close on Friday and buy puts for next week. Which has triple negative PALS factors.
I don’t disagree with your thinking 🙂
Goodluck Valley,
Monday,Tuesday and Wednesday next week are big down days in my system
My Guess big problems with European Banks..
Thanks, John!
PALS tomorrow and next week:
Friday is stretching the end of NM positive zone and declination post N positive zone. Possible big up day especially with O’s beginning tomorrow.
Next week: weakness on all PALS factors, except declination which turns negative on Wednesday at open.
Good Call Valley,
Exactly the way you predicted,do you think we have a big move down next week?
The bradley makes a turn on Monday (helio) and Wednesday (geo).
Another good call valley!
Valley,
good call ..you plan to short later today or Monday. Puts will go down over weekend so have to time it right.
Bill
Thanks! I am reluctant to short before the close today. Will buy puts then and sell them if price moves down next week. Week after next should be bullish according to PALS (post apogee, post S declination, pre FM) so will take profits on puts quickly if they appear.
Valley, do you have a downside target for the SP 500 next week and are you still looking for the analogy August 2011?
Thanks.
August 2011 is one possible analogue based upon the 10 month cycle of 5 two month cycles, August and September being among the weakest of the two month cycles (not every year, just this time in the 10 month cycle). PALS is a non price based system, it just suggests direction and since all three are in the negative (except for declination which flips negative mid week) and price is a high seems like perfect short set up.
35.7 point width on the SPX bollinger bands. Tightest i have found since Sept 22 2014
Norm Winski also made a good call on August 2.
His Next date for this month is Monday August 8, there will be a MAJOR change in trend but it is not clear for me if this change is also for the equity markets we will soon find out.
http://www.fxstreet.com/analysis/us-dollar-two-major-planetary-windows-to-watch-201608021252
August 5 – Norm Winski CIT after market close; Bradley Siderograph day
August 8 – Bradley Siderograph day
August 9 – Berg Astro Indicator (level 21…powerful)
August 12 – Norm Winski CIT after market close
August 17 – Norm Winski CIT after market close
August 18 – Olga Morales CIT
rotrot,
I have a turn down Monday. There are some currency pair turns setting up, as well as ES/SPX. I put this as the entry into a multi week drop in ES.
thanks for the feedback…you are the best!
Thanks Peter,
Thanks Rotrot,
Do you have a site where I can find the dates and information of Norm Winski ?
Thanks.
believe you can send Norm an email and after a telephone discussion he will email you his newsletter…at least that is my understanding…
http://www.astro-trend.com/
you may want to take the time to watch the video by Olga Morales…when watching the video pay careful attention to what she says occurred 84 years ago and the related event that is soon to occur…in my view, Olga subtly infers what she believes is about to happen…there really may be something to the astro stuff after all!
https://astrologyforganntraders.wordpress.com/2016/08/03/84-years-ago/
Olga is good and so is Danny at Lunatic Trader. His lunar rules form the basis of the PALS system I use (phase, distance, and declination). Olga was where I found out about declination.
have ‘known’ Olga for many years…her ParsFortuna yahoo group was one of the best ever!
Thanks I will watch the video this weekend.
https://worldcyclesinstitute.com/a-bullish-world/#comment-10211
“Friday, August 26 through Tuesday, August 30”
Extremely Good info. Thanks rotrot.
I was referring to the astrol with Olga.
The origin of cycle thinking comes from music. When you have a string that plays a c-note, you get the same c-note – one octave higher – when you half the length of the string. And visa versa. So, the number 2 (half =1/2) is fully connected with the musical vibrations. This led Pythagoras to conclude numbers and vibrations are basically the same.
Using this principle I built a system using musical harmonics, that can calculate harmonical dates (read vibrational dates) using any pair of 2 dates.
Let’s assume the 1929-1932 decline was significant. When I use these dates I get a list with future dates. When the period in between is too long I use this period to do the same exercise to get micro vibrations.
With this system I can see 8/6 is major (270 degrees or 1,5 sinewaves).
And this comes from 2 dates. Using the square of nine on the 1929 date alone, I get 8/5 on 315 degrees. 5/20/15 was 90 degrees so 8/5 is just 225 degrees from the 2015 high.
Ain’t it nice the musical vibration system gives exactly the same date as Gann’s square of 9?
The full 360 degrees in this cycle runs into 2023. You will find this date in Carolans book on the spiral calender.
The next few dates would be
8/11
8/19
8/31.
This micro vibration on 360 degrees targets april 2017 which is almost exactly 17 years from the march 2000 top. I expect this to be a low. In september 2017 the real panic will come but that is beyond the scope of this little intermezzo.
The war cycle I found using this system gives 9/2; just 2 days after 8/31. So the 1929 decline and the world wars were just the result from the same master vibration.
From early 1915 (start ww1) to mid 1945 (end ww2) is 30 years; half of Gann’s 60 year master cycle. The start of ww 2 in sept 1939 is exacly 10 years after the september 1929 high.
Everything is connected.
Have a nice weekend
https://worldcyclesinstitute.com/a-bullish-world/#comment-10099
I’ve seen it!
Thanks André,
I m always amazed how creative you are in finding new methods and cycles.
The dates you mention short term are al tops?
8/11
8/19
8/31.
Do you also have the lows for August?
Thanks.
John.
John,
Other techniques suggest a low 8/20. So – although this is mostly about timing – it will likely be H-L-H. No trading advice 😉
Another way to use this technique is use confirmed cycle and divide these in harmonical bits. Gann said the 144-squared cycle is the best for time and price.
Using the same 1929 date and using Gann’s great cycle (Gann’s words) we end up in 1986, to start the second cycle. This brings us into 2043.
From this system we can do a more strategic analysis. 180 degrees in this cycle; meaning 1,5 great cycles form 1929) gave 10/31/14, 90 degrees gave 2000 so 2014 should have been even more significant. The oct 14 low was an inversion; a typical reaction of the market to go up when the trend turns down.
The next main vibration in this system is 8/11, same as in the list above. But this date is the most important as it is 666 days from 10/15/14.
In other words; markets should have turned down by the end of 2014. Instead a 666 day overthrow started to bring us into 8/11.
Please realize this is a completely different technique. Yet, the vibrations underneath are all the same, hence the same date.
8/9 I have a natural vedic turndate and a 19 day mercury cycle. So my expectation is down on Monday, a low on Tuesday and then up into 8/11. Could be double top, lower top are slightly higher in some indices.
Amazingly this system also gives 2023 as a major vibration (for reasons too deep to explain here some vibrations are ‘more equal than the others’; to paraphrase Animal Farm).
Cheers,
André
An additional argument for 2014 being pivotal is that 5 times the very vibrational 17 year cycle gives 85. And september 1929 +85 is september 2014.
If it all turns there is no stopping it. march 2017 first serious reversal after a bottom in january, a bounce, and then a second low march/april,
“The Dawn of the 7th Day begins on the 21st March 2017”
😉
The bearish mansion that starts in august runs into 3/29/17. May be off by a few days but great confirmation.
Another system I use is the vedic dasha system, using the NYSE birthdate and the 120 lunar year cycle. According to this system we are in a bullish mansion until 8/23. Then vedic sun enters a bullish mansion/dasha into early september.
The question now is : what system is strongest. My own analysis would be that august will be weak, with declines, but that the real panic hits in september. Carolan’s summer high is scheduled for 9/2 – same date as my war cycle gives.
Just wanted to share this for completeness. Maybe 1 down and 2 up in august and 3 down in september? But hey; what do I know of EW?
A cycle I discovered recently is a 343 year natural cycle, based on alignment of earth-sun-moon and node. It started 12/27/1712. This comes straight from the ephemeris.
This cycle gives very long vibrational periods (9/10 year). A major vibration was 12/24/2005, a prelude to the 2007 decline. The very next date is 1/30/15, very close to the sept 2014 date above. Micro vibrations here gave 8/1/16. So this was a very significant date; as I told you last weekend. 5/31/16 was 180 degrees in micro.
If one thing is obvious, it is that a number of major vibrations cluster within a 10 day period. 8/1, 8/6, 8/11. Down moves should grow stronger by the day.
p.s. As this is such a long cycle, I calculated micro within micro. The micro micro gives 8/31 as significant.
This is what I mean;this is the law of vibration. The 343 year from 1712 is very different from what I’ve shown above. But underneath it is the same vibration; hence the same dates.
343=7*7*7
See how nature just follows vibrational law?
Awesome info André!!! I just wonder: how do you trade on it and do you make a good % per year with it? I think your analysis are always cool to read, but knowing how to trade it is key! 🙂 So you are short already or? I only shorted 1 Dutch stock since last week through september put options. 😉
Cheers,
W
W
All moves in the market are vibrational. So for trading I use intraday short term vibrations. You would be amazed how accurately this works.
Hi Andre,
I would like to know more about your work. How do I contact you directly?
Thanks,
Glenn
You can leave a personal message for me with your email adress; I will contact you.
Good to hear André! Yeah I figure it can work very nicely. 🙂 Time > price hè! 😉
Cheers,
W
below is an email sent to an associate yesterday morning…
______________________________________________________________________
From: rotrot
To: jw
Sent: Friday, August 5, 2016 11:30 AM
Subject: SPX price action (short covering) similar to two recent dates
May 10 & June 23
______________________________________________________________________
below is a link to a twitter post that was brought to my attention today…
https://twitter.com/DowdEdward/status/761749126610509824
______________________________________________________________________
Just an other example of the force of vibrations. We now look at lillith/node. According to David McMinn, 120 degrees in this cycle causes a financial panic (sept 2017).
Fitting the vibrational cycle shows that 7/31/16 was a major vibration. 90 degrees will come 3/14/17.
Once again we see exactly the same dates; the significant 7/31 – 8/1 and the march 2017 timing.
Microtiming gives 8/3, 8/18, 9/2. 9/2 came from the war cycle – see above – and carolan’s summer high.
So, is this confirmation? No. It is just another way of looking at the same vibration.
For rotrot : the 9/2 date is significant. So I really expect it to be tested and indeed creates a somewhat larger time window at the end of the month.
gotcha…
Another way to deal with vibrations is what I call the e-note method. Yes, music! But now with log/anti-log and just the e-note. Why this note I don’t know but it works.
Using the 8/24-11/3 swing and transforming the 78 day difference in a vibration we get:
8/1
8/11
8/21
8/30
See? All kinds of methods to find the vibrations but when you use the right tools you will find the same vibration everywhere. Have have even more techniques but they all say the same. My tidal station shows that the highest high tide this month will come 8/20, so the tides also resonate with vibrations. But this gives credit to the idea 8/20 will be a low. 11/3 with 666 vibrations gives one cycle from 7/31 into 8/20.
Another vibrational cycle using e-note prices on 5/20/15 gives 4/19 – 10/23.
Combining everything I expect 8/11 high, then down into 8/20 and up into 8/31-9/2, in abc with 8/25 a period for high and low. In september the decline will gain momentum into 10/20-ish.
Short term tides give a low Monday and then up for the rest of the week. This confirms what I said before; High Monday, low Tuesday, up into Thursday.
Thursday will be the high but we will drift into the weekend. This is consistent with the ussual pattern that the market tends to decline in the post opex week.
Dear Andre,
I feel fascinated by the way you explain time cycles and their repetitions again and again.
I want to study and analyse time cycles in Indian markets but I am not sure about right method and approach.
I am not looking for quick fix steps here, just need approach to be followed for this study.
Regards,
Shirish
New post live at: https://worldcyclesinstitute.com/meanwhile-back-at-the-contrarian-corral/
This website is for educational purposes relating to Elliott Wave, natural cycles, and the Quantum Revolution (Great Awakening). I welcome questions or comments about any of these subjects. Due to a heavy schedule, I may not have the time to answer questions that relate to my area of expertise.
I reserve the right to remove any comment that is deemed negative, is unhelpful, or off-topic. Such comments may be removed.
Want to comment? You need to be logged in to comment. You can register here.