

I’m Expecting A Santa No-Show
I’m referring to the normal Santa rally, which happens over the Christmas holidays and into early January. I think it’s going to be a no-show. Nothing would make me happier to see a top on Monday. And then there’s the 26th, which is a solar eclipse. We’re that close.
This is the craziest top I’ve ever seen! It’s not a normal top by any stretch of the imagination and that’s why it’s so difficult to call it. It’s a “rogue” pattern, but fits well into the larger pattern, which has to be an expanded flat.
In any case, we’re either at a top this weekend, or only a few days away.
Here’s the latest market sentiment level from the CNN fear and greed index:
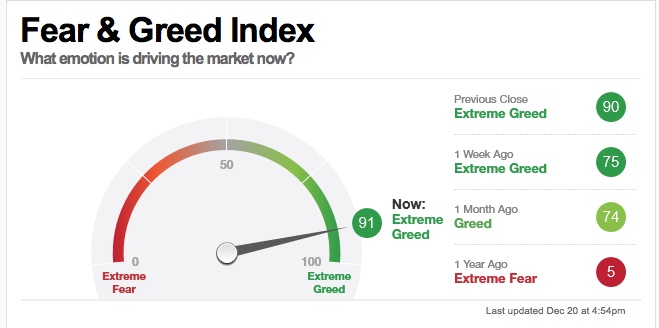
Sentiment mid-day on Friday actually hit 92, which is the highest level I’ve ever seen on this index. That signifies that everyone’s pretty much “in” the market and feeling very good about they money they’ve made — an excellent foreshadowing of a top.
This weekend, I spent a lot of time measuring and attempting to determine if the turn is on Monday or not. This is such a strange top that I found it impossible to be sure. But we’re days away, at the most.
____________________________
NYSE – At a Measured Top
NYSE top Dec 21, 2019  |
 |
Make sure you zoom the video to full size with frame expander (arrows) in the bottom right hand corner and also set the quality to as high as your web connection allows. This is a high definition (HD) quality video so the best viewing is at that level. |
_______________________________
Know the Past. See the Future
____________________________
Elliott Wave Basics
Here is a page dedicated to a relatively basic description of the Elliott Wave Principle. You’ll also find a link to the book by Bob Prechter and A. J. Frost.
______________________________
Tops in your field DZ 2
Tops in your field …You are tops in your field. Tried to follow Elliot Wave international for years. They were always behind the market. After discovering you, I perceive that you are an expert in reading the waves, which puts you way ahead of the rest of your peers. And you can read the Waves like you are reading tomorrow’s financial section. I pray you stay healthy. —DZ |
Get an upper hand … JC 2
Get an upper hand in trading …Seeing all the different currency pairs and the wave structures and hearing you explain why this has to do that on a nightly bases gives one a upper hand when trading. Elliott Wave applies to all stock and indices and can be applied to any candlestick chart. If someone ask what you want for Christmas – Tell them a membership to Peter’s “Traders Gold!”—JC |
the real deal SM 2
The real deal …‘Educational, insightful and thorough market analysis for all levels of traders. It’s Elliott Wave at its best….Peter Temple is the real deal’ —SM |
Have not had a losing week RW 2
Have not had a losing week …I have been with Peter almost a year. The only thing that matters is have I made money with his service. I think I have finally turned the corner using Peter’s EW. I have not had a losing week in the last 5 months. Thanks Peter, for your amazing amount of hard work. —RW |
Rise above the rest … SM 2
Rise above the rest …I have only ever met a few people who, in their chosen fields (astrology, medicine, music, martial arts, technical analysis), rise above all the rest and you are one of them…you have ‘the gift’…and that’s why I’m a Trader’s Gold member. —SM |
A true expert in Elliott Wave FL 2
A true expert in Elliott Wave …You are a true expert in EW analysis. What you provide is not available anywhere and is priceless. Subscription on your services is the best thing I have ever done. Many thanks for your effort to make me a better investor. I now have more trust in my investment decisions. I hope you will continue the excellent work! —FL |
The best of them JL 2
The best of them …Last couple of years, I subscribed to several ‘market traders’. You are by far the best of them and the personal contact is awesome. Daily and daily updates are very well written! Besides your expertise in EW, I also like your cycles analysis. Best investment I ever made! —JL |
Couldn’t be happier … KK 2
Couldn’t be happier …The analysis and insight you provide is simply amazing! I’ve been trading the futures and equity markets for well over thirty years and usually average around 5% monthly. Since joining your Traders Gold Service two months ago, that number has better than doubled. I couldn’t be happier.—KK |
US Market Snapshot (based on end-of-week wave structure)
This chart is posted to provide a prediction of future market direction. DO NOT trade based upon the information presented here (certainly NOT from a daily chart).
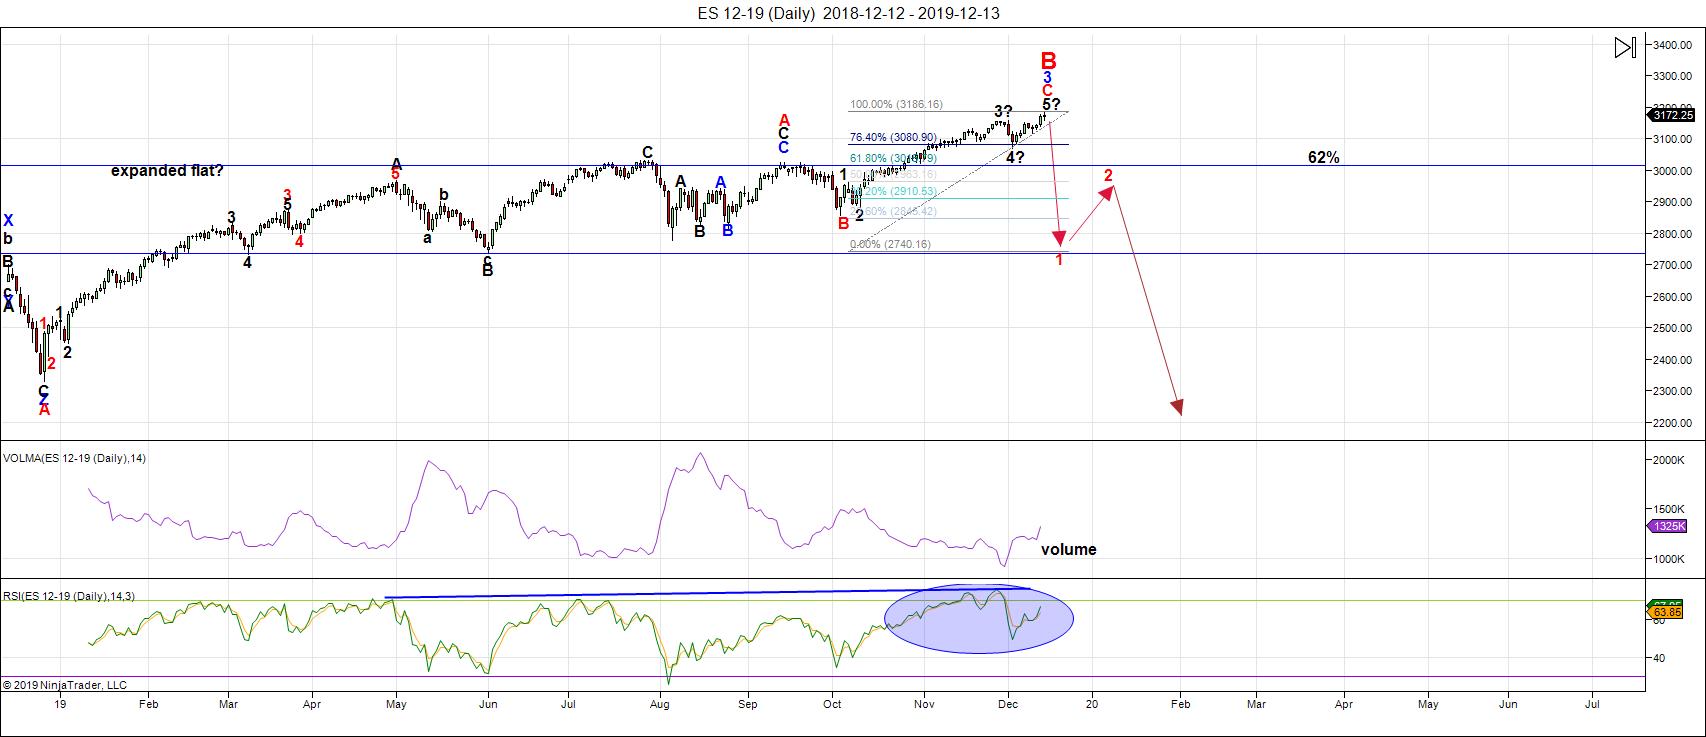
Above is the daily chart of ES (click to enlarge, as with any of my charts).
The count is still up until we get a turn and five waves down at small degree (eg - a 5 min. chart). A trend change is imminent, but we have to wait for the market to give the turn signal.
The subwaves up on a daily chart are not a recognizable Elliott Wave pattern; however, expanding the chart to show the top in January, 2018, strongly suggests we're at the top of the B wave of an expanding diagonal, as I've been saying for months now.
In the case of an expanded flat, I'm expecting 5 waves down in a very large C wave to at least the 2100 area. This would be a fourth wave with one more high to come in a year, or so.
The entire wave up from 2009 is corrective, so it makes determining a top based on measurements quite problematic. Corrective waves always have a number of possible turn points based upon measurements. They also have wave structures that very difficult to decipher (there are very few guidelines for corrective waves and no rules, unless it's a typical corrective pattern (ending diagonal, flat, triangle, or zigzag), and even those can differ wildly from what you might expect.
That said, the final waves up in the major US indices have a full count. The NYSE (in the blog post above) shows where we are now and the multiple measurements that are pointing to a turn nearby.
Sentiment is as high as I've even seen it (bullish) and that also suggests a turn.
In terms of natural "triggers," solstice is this weekend and there's a solar eclipse on January 26. Both are likely triggers. My preference is for a turn this coming Monday, but currency pairs still have work to do, so unless they've decoupled from equities, we may have a little longer wait. That would bring the 26th into focus.
_______________________
There is an option of a set of zigzags down to the same level, but it's much less probable because there are so many flats set up across multiple stocks and indices. If a zigzag is the pattern that traces out, the retraces up will not be as strong as they would be with the C wave of a flat. We'll get a lot of information about the probable path from the first wave down.
___________________________
Summary: The current B wave up is most probably the B wave of an expanded flat. The A wave ended on Jan. 26, 2018. The B wave up will end in a set of corrective subwaves. A trend change is imminent.
We're at the top this weekend of a final fifth of fifth subwave. I'm focused on Monday for a possible turn due to solstice, measurements, and wave structure. There's an alternate date of December 26. There are large liquidity issues for the US Dollar which should increase as we move into the New Year.
Look for the ultimate bottom to be somewhere under 2100 in ES.
Once we've completed the fourth wave down, we'll have a long climb to a final slight new high in a fifth wave of this 500 year cycle top.
___________________________
Trader's Gold Subscribers get a comprehensive view of the market, including hourly (and even smaller timeframes, when appropriate) on a daily basis. They also receive updates through the comments area. I provide only the daily timeframe for the free blog, as a "snapshot" of where the market currently trades and the next move on a weekly basis.
I do a nightly video on the US indices, USD Index (and related currency pairs), gold, silver, and oil).
______________________________________
Sign up for: The Chart Show
CANCELLED FOR CHRISTMAS AND NEW YEAR'S DAY
Next Date: Wednesday, January 5 at 5:00 pm EST (US market time)

The Chart Show is a one hour webinar in which Peter Temple provides the Elliott Wave analysis in real time for the US market, gold, silver, oil, major USD currency pairs, and more. You won't find a more accurate or comprehensive market prediction anywhere for this price.
Get caught up on the market from an Elliott Wave perspective. There’ll be a Q&A session during and at the end of the webinar and the possibility (depending on time) of taking requests.
For more information and to sign up, click here.
| "I think you are the only Elliot Wave technician on the planet who knows what he's doing.” |
| m.d. (professional trader) |
All registrants will receive the video playback of the webinar, so even if you miss it, you’ll be sent the full video replay within about an hour of its conclusion.


