
Update Friday, June 3: Before the Open
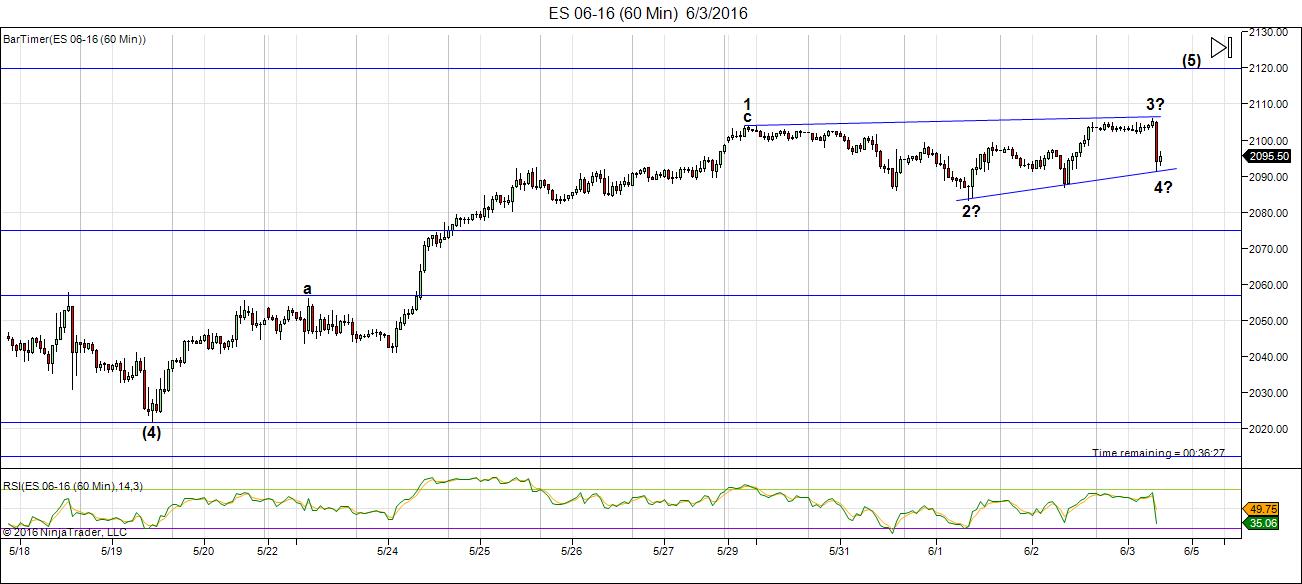
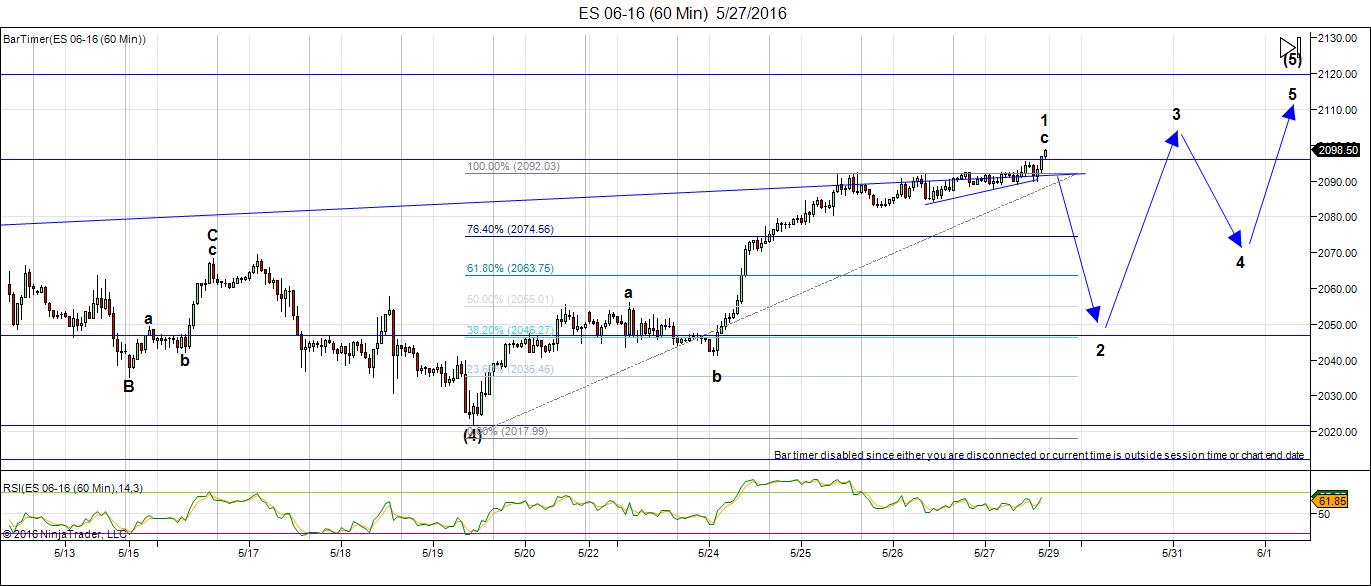
Above is the 60 minute chart of ES (emini futures) this morning after the labor report.
We dropped as I’d expected and this is the pattern I was seeing yesterday, and if it holds, a possible ending diagonal shaping up.
USDJPY has technical damage so we’ll wait see what happens here. Other currencies suffered but not technically. Let’s give them some time after the open to see what the next move is.
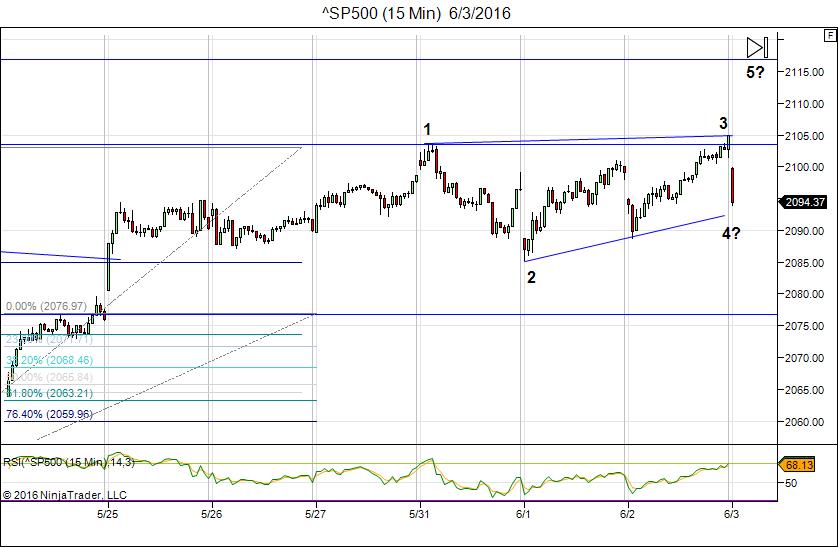
Above is the 15 minute chart of SPX showing the same pattern shaping up this morning.
________________________
Update Wednesdy, June 1: After the Close
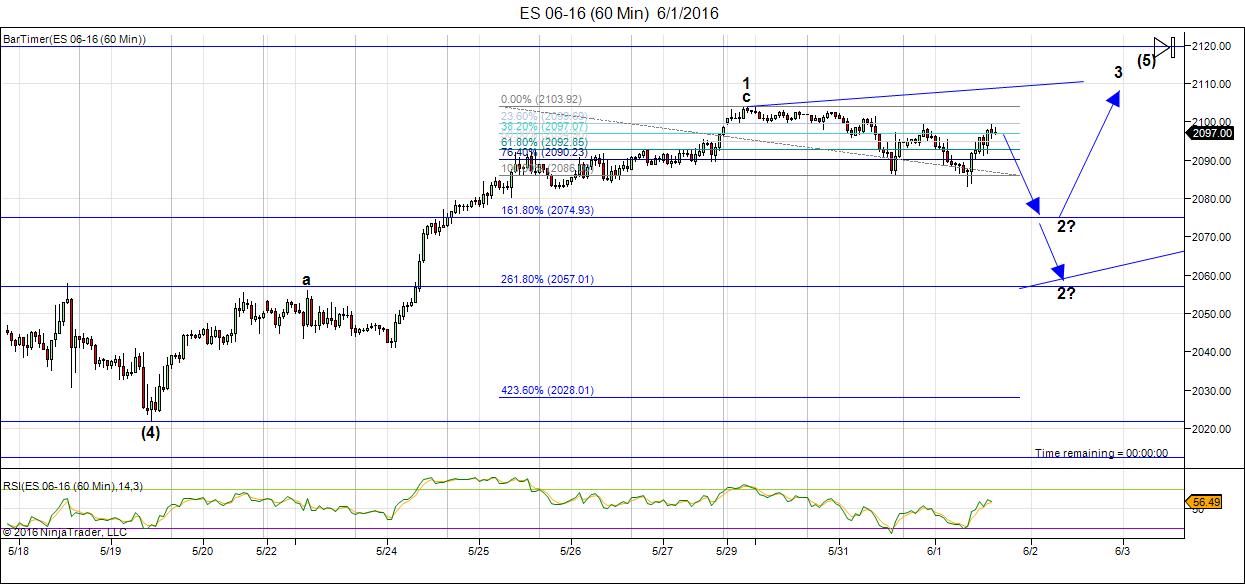
Above is the 60 minute chart for ES (SPX emini futures). We had a first wave up (a corrective wave in 3). Now we’re heading down in what should be the second wave of an ending diagonal.
There’s not a lot to go on regarding a downside stopping point. We’ve completed the A and B waves (not marked). The C wave is next. Extending the A wave to 1.618 takes us to ~2075. A drop of 2.618 takes us to ~2067. The third wave up should be about .618 X the length of the 1st wave up and it should stop slightly above the first wave up.
For SPX, the same wave ratio of 1.618 would take us to ~2075 before a turn up. That’s about as close as I can come to a projection.
Currencies are supporting the drop in the indices, but taking forever to get there. Then currencies need to rally to their final destination, which supports another wave up in the indices. Look to the next Fed meeting on June 15 for a possible resolution.
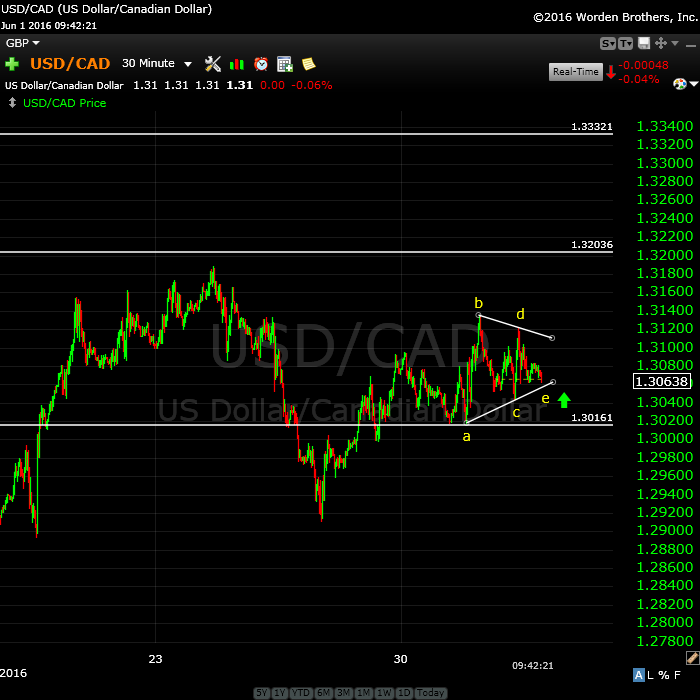
Above is the 30 minute chart of the currency pair USDCAD. I’ve posted this to those interested in it and because it’s been making me “crazy!” It’s in a bullish triangle and should finally take off to its intended target: ~1.3333.
It’s been hanging around this general area for days now.
_______________________
Original Post (Saturday, May 28):
The long predicted top in the US market is at hand. We’re not quite there yet, but we can certainly see it from here!
Actually, the all time top was at about May 20th of 2014. The series of corrective waves following it has certainly been difficult to navigate, and I’ve seen A LOT of really crazy projections of where the market is ultimately going. Some of them are from EW practitioners who should know a lot better, but let “what they think” is going to happen get in the way of objectively analyzing the wave count. To them, I say,
“Trade what you see, not what you think.”
It makes me furious to a great extent, because it undermines the work of Ralph Nelson Elliott (1871-1948), who discovered how the markets move. It simply leads to skepticism that his principle works. I’ve never seen it fail, but I’ve seen a lot of technical analysts fail. I don’t profess to be perfect, for sure, but if you’re careful, objective, and diligent in applying his rules, you’ll seldom go too far wrong.
Objectivity is the key to predicting the future of the market based on Elliott waves.
Here we are near the top of the market. The unfolding pattern and my projection this week owes a lot to the All the Same Market scenario we’re seeing at the moment (currencies and equities are more of less moving in tandem).
Having determined that we’re mostly likely in an ending diagonal, the path forward to a large extent is helped by what currency pairs are doing. I explain more in this week’s video.
Bottom line in the SP500 (and other US indices): We look to be in a final fifth wave, which I expect will trace out an ending diagonal. The chart of ES below provides my prediction of what the ending wave might look like. This wave should top close to the previous high on November 3 last year, producing a very large, double-pronged second wave, leading to a dramatic third wave down.
Longer term, the dollar will turn up and the euro will turn down at the same time the US equities market tops in this second wave.
______________________________
Here’s a video overview of the market for Tuesday, May 31, 2016:
Market Report for May 31, 2016  |
 |
Make sure you zoom the video to full size with frame expander (arrows) in the bottom right hand corner and also set the quality to as high as your web connection allows. This is an HD quality video so the best viewing is at that level. |
_______________________________
The Charts Going into Monday
The US indices appear to be tracing out an ending diagonal. I expect us to head down on Tuesday.
Above is the 60 minute chart of ES now showing the large wave up from this week. Right from the start, this week’s wave up did not look right. Now, based on the entire look of it, I’ve changed my projection slightly and labelled this wave the first wave of an ending diagonal.
Because of the non-existent second wave of this C wave up, it cannot be a motive wave. Therefore the corrective wave down will likely overlap the a wave. (Technically it doesn’t have to, but I’m expecting this to happen due to the fact that currency pairs still have a large drop to do, and they will likely move in tandem up while the US indices move up in the 3rd, 4th, and 5th waves of the ending diagonal). I think at this point, the final wave up in the US indices will need the support of the dollar.
Equities and currencies have more or less been moving in tandem for months. Expect a drop starting Tuesday, which will likely last move than a day and then a turn up in a third wave when currencies also turn in their final waves.
The much larger third wave down in equities will be next after this ending diagonal pattern plays out. Give the ending diagonal a couple of weeks to reach the top (likely in conjunction with the Fed meeting mid-month.
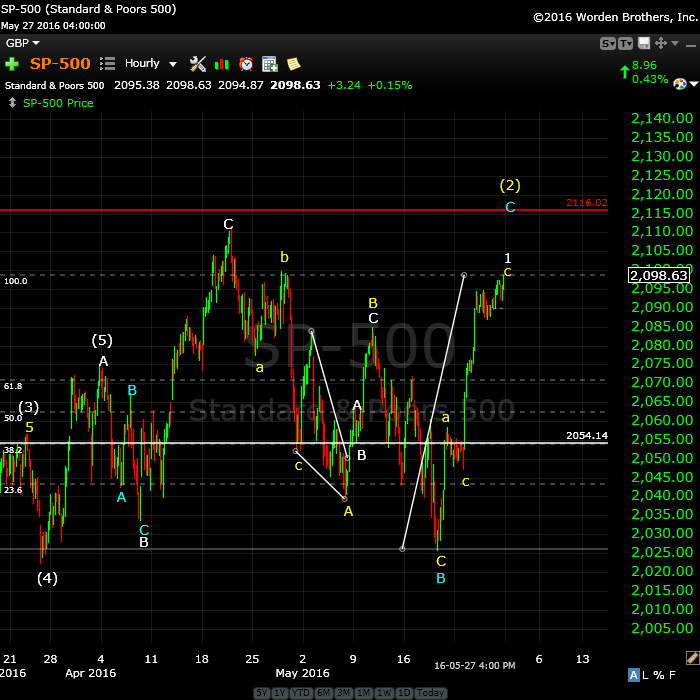
Above is a one hour chart of SPX. The wave up from ~2025 was as projected, but the underlying waves tell me it’s corrective and very likely the start of an ending diagonal. I’m projecting a fairly large drop to close to 62%, as currencies also move towards their targets (see video).
Look for a move down starting Tuesday morning, May 31.
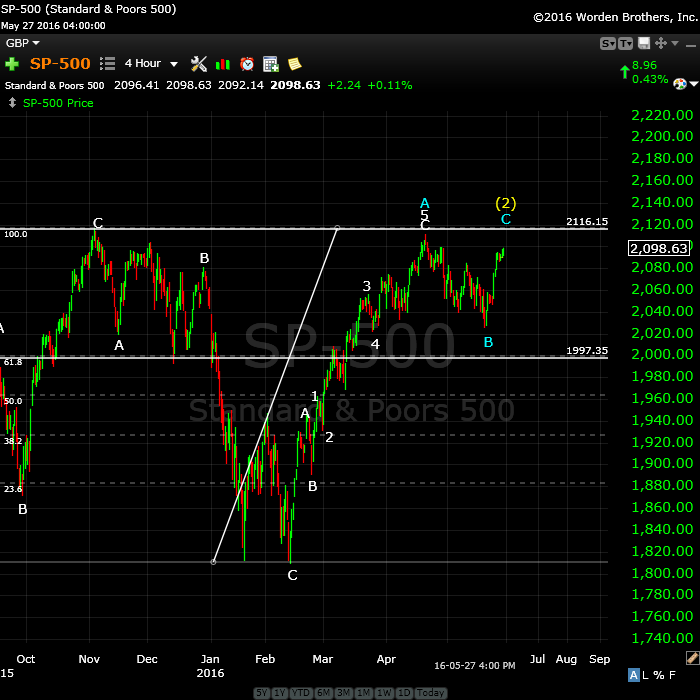
Above is the 4 hour chart of the SP500, showing the double 2nd wave top waiting to finish tracing out. This would negate the possible “truncation” from November of last year and create a spectacular EW textbook set up for a huge third wave down.
It’s typical in a bear market for second waves to trace out a double prong (an ABC wave down in this case from early November and a corrective structure up to where we are today). The wave up shows a C wave with 5 waves up (for simplicity in this chart. The entire wave, however, is not motive, and has traced out a very clear ABC pattern overall. I have therefore labelled this wave more correctly, showing that it is indeed a 3 wave corrective wave, with the (blue) C wave up expected to produce a final ending wave of 5 waves.
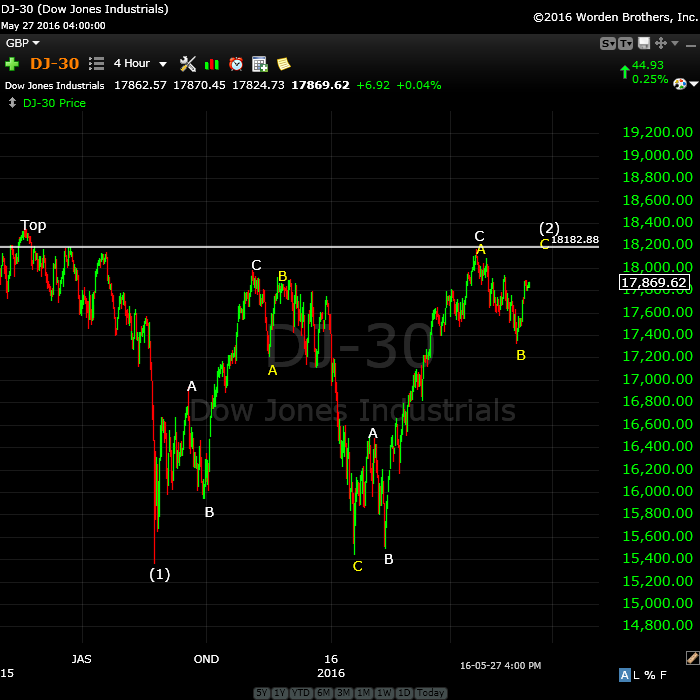
Above is the 4 hour chart of the DOW. It’s similar to all the other indices, as it should be. I predicted we’d reach the previous 2nd wave high and that in fact is what we’ve done. Look for a double top with the most recent high before a turn down. The reason I show this index is that I’m always looking to other indexes for confirmation of a move. You’ll note that the DOW did not come down to a new low in February, so this puts it clearly in a corrective abc wave up. As all the indices move in tandem, this supports the fact that SPX is also in a corrective wave.
The DOW should top just short of an all time new high. That’s because if one major index goes to a new high, they’ll all have to, and the NYSE is nowhere close.
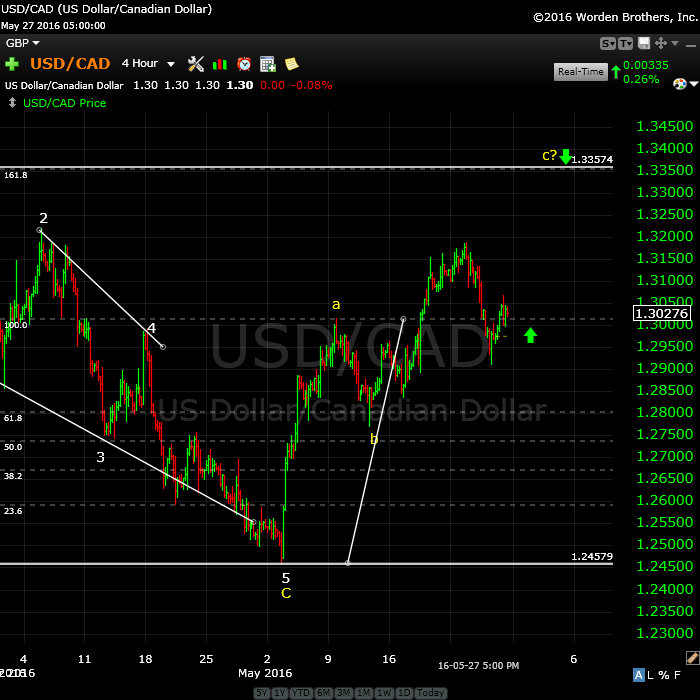
Above is the 2 hour chart of USDCAD. I have been stalking this for some time, waiting for it to top and we’re getting close. I’m presently long, but have only been able to take advantage of the C leg of this wave.
The larger pattern down is an ABC corrective wave. It traced out an ending diagonal, which is complete at ~1.24579. However, I expect the current wave up in 3 waves to reach ~1.33574 before turning down to trace out a double bottom (to ~1.246). It could also drop to a lower level. Then it will turn back up into a very large 5th wave.
The euro, Australian dollar, dollar, and Canadian dollar are all at similar major inflection points.
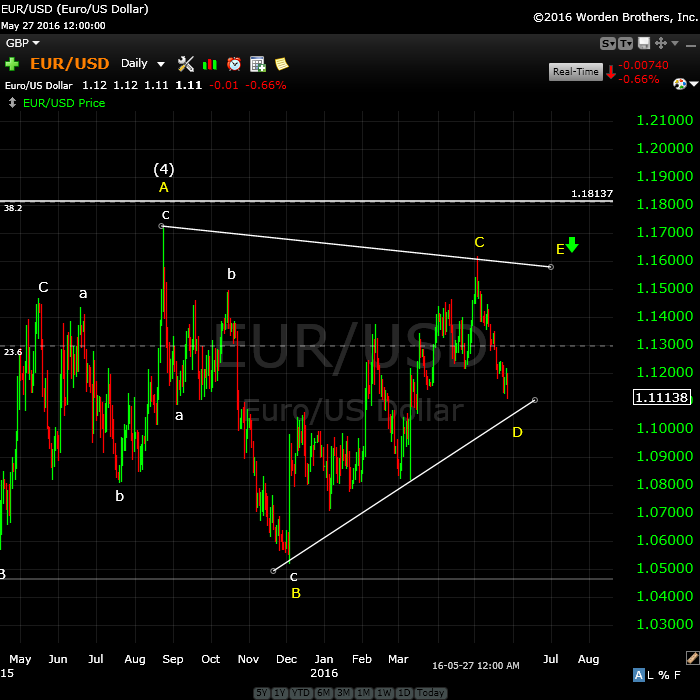
Here’s the daily hour chart of EURUSD showing the “4th wave” of the major corrective pattern we’ve been in since March, 2014. We’re in the final stages of a bearish triangle formation, with one more leg up after we finish this leg down.
We have a little more of a drop to complete in the D wave before heading up in an E wave.
EURUSD should turn down after finishing the E wave in tandem with the US equities.
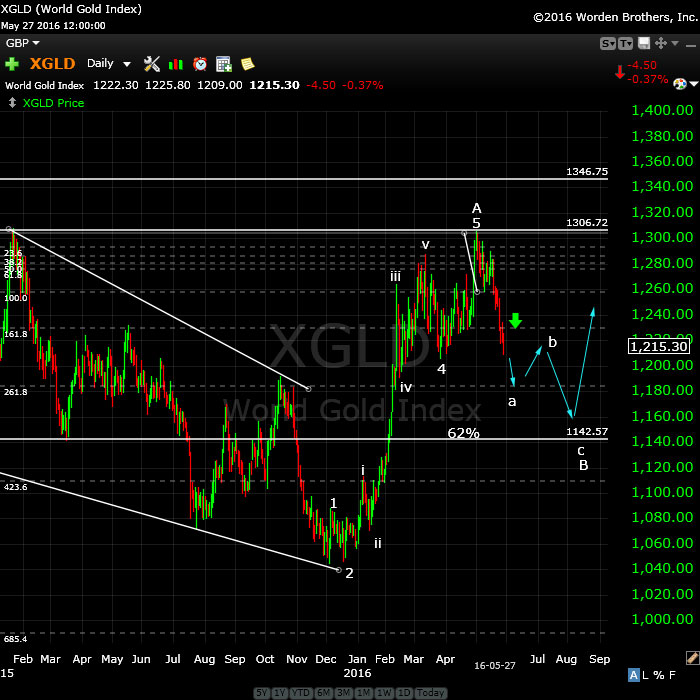
Above is the daily chart of XGLD (gold). We started to move during the last week. The bottom line is that we should continue down here.
The target on the low side is the 62% retracement level, somewhere close to 1142.
________________________
First Wave Down – What to Watch For
This weekend we’re dangerously close to a top of a second wave (in the fifth of the fifth, with an ending diagonal pattern).
What we’re looking for to confirm a turn is a motive wave down in 5 waves at small degree. After that, we should get a second wave that will retrace up in 3 waves about 62%. That’s the preferred EW entry point. So don’t feel you have to rush in. There’ll be a much better opportunity at the second wave level than at the top and the risk is substantially reduced.
__________________________
History: The 1929 crash
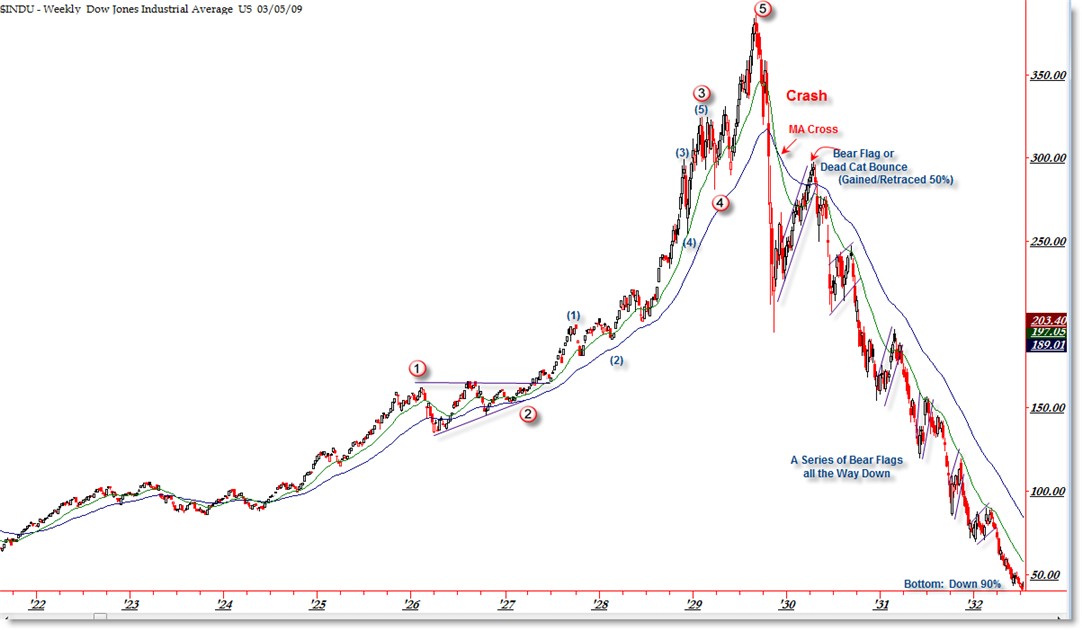
I think it’s important to look at 1929 and the wave structure (above and below), which was the same as 2007—to a point. I will show the 2007 crash below in the “What If” section.
The wave structure of the 1929 crash was in 3 waves overall. There were 5 waves down from the top (the A wave) and then a very large B wave retrace. The final C wave down was a stair-step affair and lasted over 2 years.
Let’s look a little close at the timing of the 1929 crash because the similarities to today are uncanny.
The market peaked on September 3, 1929 and then it took 2 months for the crash to actually happen (to reach the bottom of wave 5 of the A wave). The larger crash which we always hear about began on October 23, 1929. Then there was that large B wave, which lasted 5 and a half months and finally (which I explain a little further in the cycles section below), the C wave which went on for more than 2 years. This might be the scenario we’re looking at going forward.


Thank you as always Peter for the great analysis. By your calculation how low should we go on the 3rd wave? Below the 1800s we hit in Feb?
Oh gawd, yes. 🙂
I’ve put the measurements on the site before, but likely won’t again until we get closer. Something like 1600 if I remember correctly, and then lower still after a bounce.
Peter i think you had said this wave will be to 1400
Rose,
It hasn’t changed, so you’re probably right. Thanks for this.
Generally, markets top with three conventional patterns—a parabolic, a head and shoulders, and a five point broadening top. But, what is a broadening top—just an elliott wave three top followed by an A_B_C with the B wave at a new high. Finally a fifth wave to the last peak. This is what the markets appear to be doing now and are in the fifth wave up. The final high might be seen when there is a daily and then weekly—-CLOSE—below the entire range of the high day or week. RE: Mr John Harder’s book THE REVERSE WAVE.
Great insight Peter…im curious about your long term view on oil ..is 50 the top..
Frank,
The C wave in XOIL will be the same length as the A wave at ~51.50. It will 1.618 X the A wave at ~61.50 (also the previous 4th wave). Those are the two most probable turns, imo.
Futures up again. It looks like the market can’t be brought down, momentum is really strong. If we get above 2120 this week would that be a truncation?
Charlie, 2120 (if you’re talking about SPX) would be a top, but I don’t think we’ll do that quite yet.
Yes I was talking S&P. All market needs is another 0.9% higher then it’s at 2120. Futures up 5 points, another 15 gets us to 2120 and then only roughly another 15 points from all-time high. Seems markets want to keep gunning for new highs and with light volume it’s easy for manipulation from big players.
Now everyone is saying 2250 and 2500 in spx as futures up again. Thinking is nothing will bring it down
Wouldn’t that defy EW principles? I don’t see how we get much above 2120 on S&P without a major disconnect. I did see a counting that showed as high as 2160
https://hostedimages-cdn.aweber-static.com/NzQzMjc4/optimized/6a2c14db0b3249ba8a46fc242c07ec8e.jpeg
My long term EW analysis – SPX completing Major 5 of Primary 3 ( should complete this week) should be followed by a swift ABC to 1725 and a swift rise for P5 reaching all time high into Nov elections . After that will be the protracted fall going below 2009 bottom – extreme volatality for the rest of the year
Hi JA- followed link to your blog page. NICE charts – interesting alternative.
SPX …. June 28 – 30th could be Major pivot .
I use Fib. expansion plus some other ratios to project future time pivot ( no astro ) , I usually ignore any pivot that has less than three hits .
For example June 20 – 22 has four hits , so I will be watching that pivot, of course we also have the summer solstice on Monday June 20th , and the vote for the UK exit from the EU on Thursday 23rd June.
Not sure if June 20 – 22nd will be a strong pivot compared to June 28 – 30th , where I have total of 13 hits !
I can’t remember having this number of hit for at least the past 5 years , so it will be interesting to watch and see what and if any thing will happen at that time .
I do think a major high will be either around the price 2134 or 2160 , and it will be interesting if that will be around one of my two mentioned pivots .
Happy trading to all
AZ
5 10 20 40 week cycles converging down to june 30. Can be low also. Eric hadik and bill meridian are saying that as low
Yes, of course that is also possible, specially if the UK exit the EU , that will mean the FTSE & GBP will crash .
One possibility is to have 20 – 22 June as a high , and 28 – 30 June as a low .
Betting market is showing only 20 per chance britain to exit eu. Dont know what will be the cause looks like 20 to 23 is some high. 30 to july 5 some low as july 5 is puertz crash window also. But i believe in eric hadik and bill meridian who had called for bottom in jan. With this liw volume rally i think everyone is calling for high spx numbers. I think it helped the sentiment data which was calling for h& s top. Too many puts also.
Valley,
Haven’t seen any comment from you this week are you posting somewhere else.
Bill
Hi Bill. I am on vacation so am not posting or trading. Have remained invested last 10 days which has worked out ok. If market gives another few percent will step aside , if market sells off will probably remain invested. 7/15 is often a price magnet to up side.
Congratulations to Andy Pancholi, who’s added another major market turn to his impressive hit list (today’s date). He’s 2 for 2 this month again. More info on Andy and his service at https://worldcyclesinstitute.com/market-timing-report/
It might seem a bit early to proclaim a turn, but with what currencies are doing, it’s clear to me the US indices are going to head down here—how far, I don’t know (not to a new low, of course).
This reinforces the ending diagonal scenario. We’ve had a very obvious corrective wave up in futures, and this is an obvious corrective wave down (a second wave is what I’m expecting).
Dave Dubyne’s latest video: https://www.youtube.com/watch?v=wCPk-XJmlt8
Well worth watching. Dave is an expert on climate and this video (just out today) focuses on what’s happening in Austria. Stock up on wine now.
Dave’s main youtube channel: https://www.youtube.com/user/MyanmarLiving
Adapt 2030
Still short from late Thursday, looking for a gap fill at 2076
Good luck every one.
It seems that you are again predicting the markets again perfectly Peter. Nice call on the turning point. Congrats!
🙂 Thks, Johan. This should be the B wave in for ES/SPX and the like. C wave next. I’ll mount a chart tonight with probable stopping points. EURUSD and USDCAD are still on track heading to their targets. GLD will likely bounce here in a B wave.
I posted a chart of ES at the top of the post.
Has wave 3 started?? Tell me it’s so….{wink}..You the man…. nick
No, Nick. We still have to top. This is the last subwave. I would look to the 15th, when we have the next Fed meeting. Seems to me that will coincide nicely with this ending diagonal (assuming for the moment that’s what this wave is).
Sorry, i Meant wave 2 up …n
is rut making divergent top
Peter,
Do you think we have tagged the point 2, instead of going to 2075 and below its just gone to 2085
Bill
Bill, I don’t know what ‘point 2’ is, nor what index you’re referring to.
No worries you already replied on the top chart for SPX.
Peter, IWM went higher than 115 today
The 62% retrace level on IWM is ~115.65, so that’s not a surprise. The wave up could be in five waves, so I would say this is shortable, although it could have a little more upside. I wouldn’t expect that much more, though.
Thanks
I updated the ES chart. Not much of a change.
I just added a chart of USDCAD for anyone interested (just under the ES chart at the top of the post).
Thanks so much Peter. Your usdcad chart really helps me in trading
That was mostly for you, as I knew you were probably wondering what’s going on. I’m long, as well. It’s been frustrating, but then nothing is moving at the moment. I think it’s just about to, though.
Thanks again Peter. I really appreciate it! I’m glad that you now include more currency pairs in your analysis, as I have certainly benefited a lot from your analysis:)
When ever I read such bullish predictions … I find out that we are getting near a very important TOP.
I could be wrong … but I just can’t see SP500 reaching 3200 in 2017 ….
http://www.mahendraprophecy.com/userfiles/files/special_interview_june_2016_%281%29.pdf
An expanded flat is a 3-3-5 combination of waves, which the pattern in ES clearly is not.
You can tell me I’m wrong to a point, but the one thing I will not allow is for anyone to start developing their own Elliottwave rules and attempting to tell me they’re correct when they clearly are not. In that case, it’s time to start your own blog.
I’ve posted a chart of USDJPY if anyone is interested in seeing a terrific setup in progress.
Looks nice.
Does it mean that SnP will go up too ?
Usually it follows USDJPY tick to tick.
so S&P only works one way – up ? usdjpy collapses 2+% in 3 days. nikkei 3+% snp. narrow range. so it only goes up w/ usdjpy, not down
Yes. ES down first on the USDJPY second wave retrace and then ES/SPX up in three waves to match USDJPY heading down in three (3, 4, 5). So, if you think about it, that’s the rest of an ending diagonal in ES/SPX, because we’re looking for the same pattern in the opposite direction.
As I’ve been saying, these assets are all moving together. That’s how I can be so sure of the count and where we’re going. There isn’t a lot of guesswork right now.
There’s a lot of waiting, though. It’s a market top, so you have to expect that. 🙂
We risk to become old waiting for “Godot” ?
Hmmm. Think I’ve heard that somewhere before …
So for those of us not in Forex we could go long Yen through FXY? Or are you expecting Yen to weaken so YCS would be better set up? Sorry I don’t trade currencies too much.
Sorry, Charlie,
I don’t know the answer to that. I don’t have a yen chart handy. It would depend on the structure of the yen waves alone.
Thanks Peter! I trade currencies and have benefited from your analysis. Please kindly post any currency pairs that you find interesting:)
Elizabeth,
I’m looking for a double bottom here to confirm a wave in 3 and then we’re starting all over again. Same upside target.
In USDCAD.
the intensity of the next major rollover will look like this imo
from @stockboardassets https://pbs.twimg.com/media/Cj9YRNnVEAEWg3G.jpg:large
see kepler intensity wave
https://en.wikipedia.org/wiki/Inverse-square_law
when it starts, there will be no retrace until you see sub 1850
Great link Scott. I would love to hear you comment on the chart shown in the link you posted. Can a breakdown date be predicted from the chart or just a sell signal once the elliptical trendline is broken? Your thoughts appreciated.
hi Aaron, my thoughts are pretty simple and aligned with Peter’s expectation of mid-end of 2017. that we will see a major C wave throw over sub 1850. where i disagree with Peter is that if 2116 is the targeted area and we are now within 1% of target, why not layer in a 1/3, 1/2 or full position of put spreads out in Aug, Sept, Oct, Nov ?
it seems to me, the TA elliotwavers, look for the perfect set up and the algos are trained to short change it to bust stops or move just prior to hitting targets. the masses of TA were looking for the perfect 5 wave top (including tony caldero) just prior to 12/31/2015. as the markets started to selloff in early january, many were looking for the retrace so they could enter their short. it never arrived. 1850 arrived on 1/20 instead. caldero then changed his call to a truncated P5 and called it a long term bull market. Until yesterday. when the wave counts caused him to remove that label. i say if a person is afraid of a full blow meltup, put in your positions with out a few months. either hedge with near dated calls or put a stop where you feel comfortable.
supposed to read caldero long term bear market. a status that was removed yesterday
We don’t look for perfect setups. We just follow the rules. It has nothing to do with “wave setups.” (?)
i understand Peter and you know i think your work is phenomenal. my only point is there is a great deal of unexpected turns and not everyone can babysit their positions or entries. if someone subscribes to the endgame that your work foretells, my only point is that we are within .6% of your target. a person could ladder in a position now with a 3-6mo horizon, if your retrace back to 2050is is fullfilled they can either take some off the table or add protective calls
I totally agree with you on that point. The US market is done, imho. If you’re in options, it’s time to think about getting in. However, I might wait until we get closer to Yellen on the 15th. The other thing is that this is shaping up as an ending diagonal (it really can’t be anything else). As such, it will eventually likely have a throw-over to the upside. There are no rules or guidelines that give me any idea how large it will be. I don’t think it will be much of an issue but that’s a pure guess.
So we could get a spike at the end. I can’t see it going to an all time high, but we won’t necessarily stop right at 2116 SPX.
Peter,
Does this ramp up invalidate your counts, are you still thinking we go down before we go up further.
Bill
Bill, No, we’re just drifting. All the waves up are in 3s (I guess that’s obvious). In an ending wave, you have two options:
1. a motive wave in 5 (like USDJPY) or
2. A 3 wave mess which will lead to an ending diagonal. Those are the options.
I don’t think we’ve corrected enough for the large wave up from the fourth wave low. I would expect us to head down again for that reason and the fact that currencies still have to complete their correction, which points in the same direction. At the moment, they’re fighting each other and going nowhere. Something will break sooner or later.
Peter, could we be finishing the rally to 2116 tomorrow? I know Andrew Pancholi has another turn coming up quickly.
I can’t see how. All the indices are somewhat out-of-sync, the big guys like NYSE aren’t that close and you don’t have a valid ending wave in place. Plus currencies (and the dollar, which is really driving all of this) aren’t near done.
I would bet his minor turn (tomorrow) for only US equities turns this mess negative for awhile.
I note now that the A and C waves in ES and SPX are about the same length, which may mark the end of this pattern (end of day).
Peter, thanks for helping us navigate towards the major turn in the markets.
I’m not helping all that much at the moment. Nothing much is moving. We just need to let these final waves play out. There are lots of moving parts which look like they’re all going to turn together. They all need to slowly “get onto the same page.”
I don’t think there will be any more decent opportunities in futures and US indices until the turn. The opportunities right now are in currencies.
Folks, I don’t see much point putting up a new chart tonight. Not much has changed and I’d like to see what tomorrow brings in US futures. I can start to make out the structure of an ending diagonal in futures (ES) but it’s all very shallow and I don’t think the downside has corrected enough.
Also, the Nasdaq is at a new high, but NDX is not. They look more like traditional sets of 5 waves up. However, I would expect a fourth wave now out of both of them, if that’s the case. If we come down a bit tomorrow, it might provide more of a clue as how we’re going to get to the top.
I see the Nasdaq comp has a big gap to fill, which may take it up to 5007. It’s got lots of room to move to the upside without changing anything technically.
Finally bought a few spy lotto puts after close just in case there’s a gap down tomorrow.
Liz- you should do well with those putts. you must be psychic! good job!!!
http://invst.ly/1tycu
Amb, psychic lol. The first 2 days of June 2016 has been gap down and buy the dip so I took a chance. Since this is the 3rd time the pattern has played out then it probably won’t work next time because good or bad things come in threes? 🙂
Not my work but worth considering if the USA stock indexes break out
To the upside , which I seriously doubt or expect .
The problem noted at the bottom of this copy and this was not a stock market related
Write up on the planets nor is it mine . According to Barbara koval in her book ” time and money”
She noted that when planets conjunct the sun you usually see a high of sorts into that
Conjunction . It’s not always true case from what I have researched but I’m posting this
Planetary write up I found on the net because I was doing some research on the Venus Mercury
Conjunction in August . To add to this I could post a few other writers observations in regards to
Mercury retrograde cycles and stock market reactions yet I’ll leave it for another day .
Bottom line ; I’d keep an eye on the end of August when we get there .
Joe
The main event will be in August, 2016, which will be The Month of Evening Conjunctions! The Moon will pass by each of the visible planets over a succession of evenings, after sunset. This should be a very interesting month, in a season of reliably clear skies for most of us. But the whole month will climax during the last week of August, which will be The Week of Planetary Conjunctions! Mars will finally meet up with Saturn on August 25. These two will still be close together on August 27 when Mercury, Venus and Jupiter cluster up, with Venus and Jupiter being closely aligned, only 0.07 degrees apart, less than one-quarter of a Full Moon diameter!
The only problem is that these planets will be very close to the Sun at that time, and will be very low to the horizon after sunset
The puetz cycle begins as I see it approximately 1 month
Prior to the solar eclipse . Hence August 1st
The solar eclipse should be a low ( sept 1 ) if the puetz cycle
Is going to produce a collapse in stock prices .
June 6-13 I still see as a high with late June ( 24th ) as a low
I’ll need to dig further into the Mars Uranus cycle before
Calling out that cycles forecast high
Jan 20 2017 is still the major cycle low as I see it .
Can’t wait to get back home and put all this in order
Good luck Peter 🙂
I’m still keeping an eye on the euro and just watching it
The triangle formation intrigues me .
Joe
Thanks Joe,
Yesterday we have seen a bradley turn and monday next week (June 6) we will see Mercury max elongation west so could it be this is a high right now?
Thanks
John.
I’ve just posted a chart of ES showing this morning’s move and the pattern that was shaping up yesterday. Currencies are a bit of a mess this morning, so we’ll have to let things shake out first to determine their next move.
I added the chart for SPX to show the similar pattern emerging.
USDJPY has done “the other version of a first wave down” which I’ll have to explain in charts later, so that suggests it will head back up from about here. It also suggests the other US currency pairs will do the same.
The pattern in ES and SPX is not holding, which is what I’d prefer, because it’s certainly an odd-looking ending diagonal. I’d like to see more correction down for them.
Hi Peter,
Possible we visit the lows again SP 2025 or so?
I not expecting that, no. We’re not done up here, yet. But I can see a drop to around 2072.
The waves both up and down in ES and SPX are in 3’s so I expect a C wave down.
Peter,
Post a picture will help us little more.
Look at my post for June 1. Not much different than that.
Brexit vote on June 23 may act as a drag on market until that date. Fed meeting June 15 and 16 usually acts as drag on market until day before or June 14.
PALS is mixed next two week. Would expect market to drift lower until Brexit vote.
If Peter thinks we have one more leg up to go, I think he’s right. 6/13 will be a high.
I see several layers of support in the market that vanish one by one. This weekend we see a major support disappearing and another one in june. The last support I see runs into August, and after that it is basically down into 2017.
6/13 will be the last serious high but real panic will have to wait. Monday high, wednesday low and one last short squeeze up into 13. I think.
Have a nice weekend.
André
Andre people saying 2250. 2500 is it possible. The decline will it be brash type or stairstep
Rose,
I am more into timing than price levels. But given the fact the larger trend is down and S&P seems to have trouble breaking 2100 I don’t expect new alltime highs.
Let’s see what Peter says on this.
On timing I am pretty certain.
Misc info
The full moon 6 weeks after to solar eclipse
:
October 16 – Full Moon, Supermoon. The Moon will be located on the opposite side of the Earth as the Sun and its face will be will be fully illuminated. This phase occurs at 04:23 UTC. This full moon was known by early Native American tribes as the Full Hunters Moon because at this time of year the leaves are falling and the game is fat and ready to hunt. This moon has also been known as the Travel Moon and the Blood Moon. This is also the first of three supermoons for 2016. The Moon will be at its closest approach to the Earth and may look slightly larger and brighter than usual.
For the year 2017
There won’t be a technical puetz window
This implies the up coming puetz cycle needs to
Drive stocks lower even though that hasn’t yet
Worked out in the previous cycles we’ve seen.
Also I’ll note the Mercury retrograde cycles have
Begun bringing lower stock prices but that has not been
The case for most of this bullish market since 2009.
February 11 – Penumbral Lunar Eclipse. A penumbral lunar eclipse occurs when the Moon passes through the Earth’s partial shadow, or penumbra. During this type of eclipse the Moon will darken slightly but not completely. The eclipse will be visible throughout most of eastern South America, eastern Canada, the Atlantic Ocean, Europe, Africa, and western Asia. (NASA Map and Eclipse Information)
February 26 – New Moon. The Moon will located on the same side of the Earth as the Sun and will not be visible in the night sky. This phase occurs at 14:59 UTC. This is the best time of the month to observe faint objects such as galaxies and star clusters because there is no moonlight to interfere.
February 26 2017- Annular Solar Eclipse. An annular solar eclipse occurs when the Moon is too far away from the Earth to completely cover the Sun. This results in a ring of light around the darkened Moon. The Sun’s corona is not visible during an annular eclipse. The path of the eclipse will begin off the coast of Chile and pass through southern Chile and southern Argentina, across the southern Atlantic Ocean, and into Angola and Congo in Africa. A partial eclipse will be visible throughout parts of southern South America and southwestern Africa.
The Jan 20 3017 low and the next technical Venus
Bull market starting point which will also be
The Mars Uranus conjunction , hence 3 separate
Calculations calling for a low .
For Venus info see this
https://in-the-sky.org/news.php?id=20170325_12_100
Bottom line :
The year 2017 is going to be a vertical straight up
Strong bull market and the upside objectives could
Become very outside traditional price moves .
A Total Blow Off to end this bull market .
Jan 2018 the huge bear market begins !
Joe
As always Joe, I enjoy your analyze on the markets. I could not agree with you more for a huge blow off phase as Martin Armstrong has talked about. 1929 will have to wait again.
New post: https://worldcyclesinstitute.com/triangular-bulls/
This website is for educational purposes relating to Elliott Wave, natural cycles, and the Quantum Revolution (Great Awakening). I welcome questions or comments about any of these subjects. Due to a heavy schedule, I may not have the time to answer questions that relate to my area of expertise.
I reserve the right to remove any comment that is deemed negative, is unhelpful, or off-topic. Such comments may be removed.
Want to comment? You need to be logged in to comment. You can register here.