

Key Cycles Dates: The Key to Profitability
One of the biggest problems you face as a trader or portfolio manager, is knowing WHEN to enter or exit a trading campaign.
How different would financial situation be if you could “time” markets?
 If you knew well in advance that a trend was about to start or end, would that information be useful to you?
How could market timing greatly enhance your present trading system?
How often have you stayed in the market only to see the trend change and your profits evaporate?
Using cycles, we time markets well in advance. Our profit finding Oracle system, highlights time periods when high probability trend changes can occur, giving you a HUGE trading edge.
Our timeline highlights market moves, weeks, months and even years in advance.
| “Andy knows cycles better than anybody I’ve ever met, and I’ve studies cycles all my life” |
| Harry Dent – NY Times Best Selling Author and Economic Forecaster as seen on CNN CNBC Forbes etc. |
Historically we have only provided this information to major hedge funds, banks and institutions, however so many of you have contacted us so we launched the market timing report.
- Focusses on S&P 500, Crude Oil, Gold, EURUSD, Dollar Index
- Published monthly
- High probability turn points and probability information
- Based on seasonality, cycles, and other proprietary methods
| Read through this free sample (from October, 2018) Click on icon to open a PDF file |
|
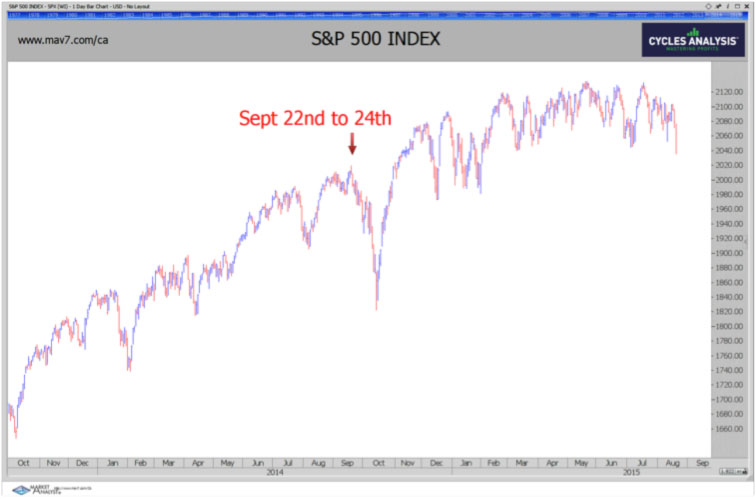
Examples of the Power of Market Cycles Information
| Prediction Sept, 2014 Report | Prediction Oct, 2014 Report |
|---|---|
 |
 |
| Here’s what happened: | Here’s what happened: |
 |
 |
This valuable information is derived from output from the Cycles Analysis “Profit Finding Oracle” Program
Andrew Pancholi discovered these cycles that clearly identify market turns and he’s sharing this information for your benefit through The Market Timing Report. Here’s an example of his recent cycle “HITS” over the past year for the SP500 alone:
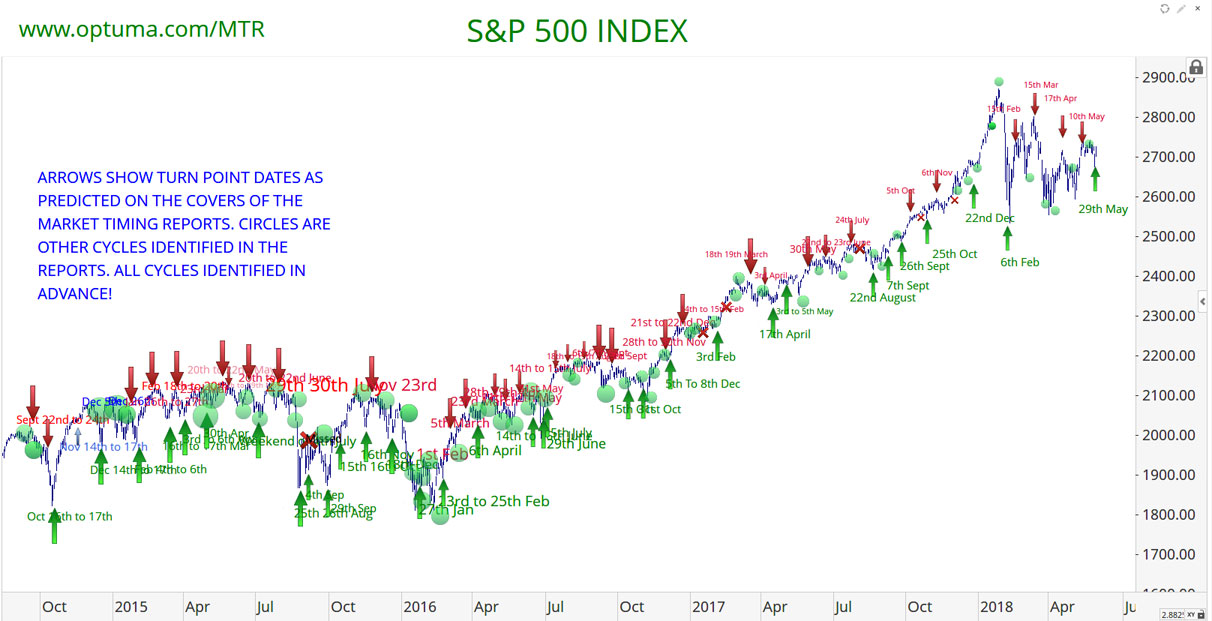
Updated Chart of Direct Hits to may, 2018 (above – click to expand).
Above is a chart of the SP500 showing Andy’s key turn dates for the past three and a half years, or so (click to enlarge). The green arrows show direct hits on MAJOR turn date rallies and the red arrows are the same, in the opposite direction. You can see the incredible accuracy of Andy’s work.
He provides other possible turn dates for a range of assets but he only provides one or two MAJOR dates for the month. That’s because major turn dates only happen once or twice a month.
His service covers the SP500, EURUSD, oil, gold, and the US dollar. He has additional reports for futures and other assets.
This approach makes your job of identifying trade entries that much easier. You’re not wading through a many possible turn dates.
The green arrows show the other lessor dates Andy also provides. He’s been incredibly accurate with all his dates. Use his information to enhance any other market timing tool you currently use.
So, if you’re a cycles trader, there simply isn’t a more accurate cycles forecaster out there! Andy’s month report is a must have!
Purchase Now for Immediate Access
There are two options – both offer a 28 day refund – you must contact us to claim this. There is only one refund trial allowed – its in the terms and conditions.
 |
Annual US $675 (save 57%) |
| Semi annual US $395 (save 48%) |
The Importance of Cycle Forecasting
Regardless of whether you’re a fundamental trader or a technical trader, the timing of trade entry is absolutely critical to your profitability. After more than 20 years of research and study of cycles, our proprietary software generates turning points in different time frames. This is a complex process. The purpose of this monthly letter is to provide you with an overview of critical time zones when trend changes are highly likely. You don’t need to worry about the complexity as we take care of this for you. For the most part, trend changes are reversals but from time to time accelerations can occur.
We also combine this with seasonality – a powerful and commonly used system. We enhance this with out proprietary forecasting models. We are not infallible but do believe that this information, especially when combined with other techniques can give you a VERY SIGNIFICANT EDGE. This research looks at very many aspects of forecasting and we leave no stone unturned. Our super macro cycles will go back thousands of years, however more relevant economic cycles review events over the last centuries.
A simple example of this is shown by the 100 year cycle and its half cycle of 50 years. Historians amongst you (most of the world’s greatest traders and fund managers have studied history) will be aware of the massive panic of 1857. This was the biggest economic meltdown in the modern world with both the USA and Europe being severely hit. The railroad boom just peaked, The Ohio Life Insurance and Trust in Cincinnati failed and down came the house of cards. Credit dried up overnight. A major depression kicked in.
Fifty years later credit suddenly dried and the economy went “pop.” The 1907 Rich Mans Panic was taking place. As a result, it was easy to forecast the events of 2007. We presented this information in advance at a private seminar prior to the event. The “Global Financial Crisis” is now history. Warn your children and grandchildren about 2057! Of Course there is a little more to this and that is what we’re here for. However, sometimes there are gifts to be had! Here is the US market almost to perfection!
So we distil macro events down to daily (and even hourly) cycles and are thus able to forecast probable areas of change.


