
 Friday was a Game Changer
The infinity icon on the left gives you a good idea of the frustration I’m feeling about the length of time it’s taking for the US equities market to top.
Friday afternoon late was a game-changer, because what was a potential ending diagonal very definitely broke to the downside, meaning we’re most likely going to get a larger fourth wave.
As a result, the impending top has been postponed for a few weeks, at least.
The wave structure of these waves up from June 3 (in what appears to be the last wave of a broadening top formation — also called a megaphone formation) are not what you’d expect for a final wave of a rally; they’re corrective and missing the usual signposts (a broadening top is not an Elliott Wave pattern and it’s described in Murphy’s well-known and respected book on technical analysis as “an unusually difficult pattern to trade“).
It certainly has been that: a most difficult pattern to trade!
While I was looking for an imminent top, the game has changed. If we get a fourth wave here (my preference), that means we have the fifth subwave up still to go. If the fifth wave turns into a triangle or diagonal, we could see a pattern that takes a good month to unfold.
At the same time, there are some mixed messages. Gold seems to be tracing out an ending diagonal (unconfirmed at the moment) and oil looks like it’s going to start a rally that may take a month or a little longer to reach its target.
The early part of this week should give us more of a clue at to what the timeframe will be. We were so close, but since all the asset classes I cover (WTI oil, USD currency pairs, the US Dollar Index, gold and silver, US indices), are moving in tandem and have to reach their respective tops, this drop into a fourth wave definitely prolongs the dramatic drop I’ve been projecting.
There are some very good opportunities shaping up in the meantime, but the “big drop” has quite suddenly moved itself later by a couple of weeks at the very least. When you put all the analysis together, it looks like we’ll be wandering around here beyond just a couple of weeks.
Tops are prolonged, frustrating affairs at the best of times. Add in the summer doldrums, really low volume, and the fact that absolutely everything is moving together as one (and must top at the same time), you have a very frustrating situation.
My market rule: The market does the most predictable thing in the most unpredictable manner.
So, we have to wait for the setup.
In the meantime, we may see a volatile week, as we head into the middle earnings season. For the next two weeks, we have some heavy hitters reporting.
Reporting this Week: CAT, GWW, V, GOOG, FB, TSLA, UPS, INTC.
Italy is in trouble (Spain not far behind), Britain is in turmoil with an election next month and a Halloween deadline for Brexit. Ebola is raising its ugly head and the addition of a measles outbreak is killing thousands in the Congo faster than ever before. I’ve warned for years about a coming pandemic.
On top of that, Deutsche Bank is on its last legs and there’s a sense that the end might be a lot closer than a lot of people think it is. Usually, something breaks at a market top, giving those that don’t understand technical analysis (and how the market really moves) an opportunity to blame an event. After all, we have to keep all those pundits employed!
______________________________
Checking in on The Russell 2000
One of the key indices to watch is IWM (the Russell 2000), which needs a new high at 161.
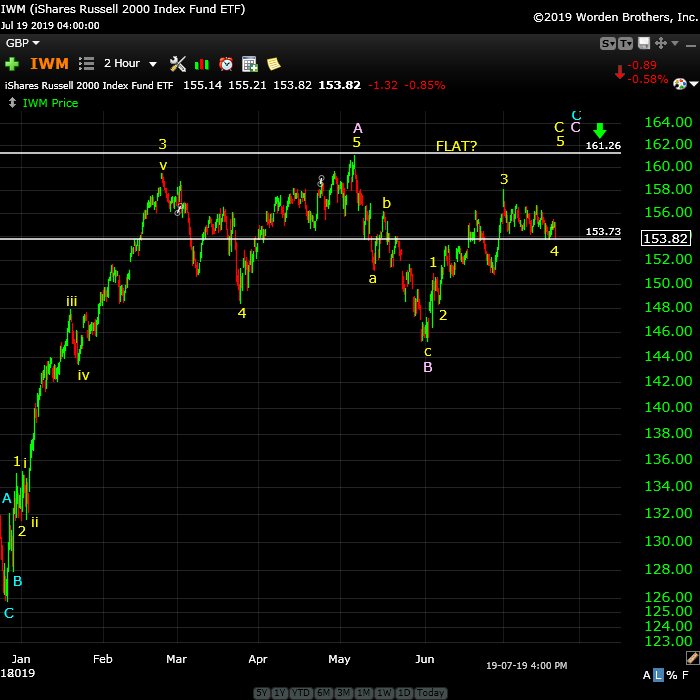
Above is the 2 hour chart of IWM, the ETF for the Russel 2000. It’s in the final fourth wave after several attempts to start the fifth wave. It needs a new high in the 161 area, due to the fact that the previous wave down is in three waves and must be fully retraced. This index may be the straggler of the US equities indices, as the rest are very much closer to targets. This weekend, we appear to be a the bottom of the fourth wave.
Note that the wave down is in three waves and the wave up is a little bit questionable, although I’m counting it so far as a “five.” If it reaches the 161 area, we have a potential flat (3-3-5 pattern). Note that guidelines for a flat say the B wave (which is the wave we’re in) only has to retrace 90% of the A wave down. So, it is possible that we will not make the 161 number. (90% is at about 159.40).
___________________________
Elliott Wave Basics
Here is a page dedicated to a relatively basic description of the Elliott Wave Principle. You’ll also find a link to the book by Bob Prechter and A. J. Frost.
______________________________
Tops in your field DZ 2
Tops in your field …You are tops in your field. Tried to follow Elliot Wave international for years. They were always behind the market. After discovering you, I perceive that you are an expert in reading the waves, which puts you way ahead of the rest of your peers. And you can read the Waves like you are reading tomorrow’s financial section. I pray you stay healthy. —DZ |
Rise above the rest … SM 2
Rise above the rest …I have only ever met a few people who, in their chosen fields (astrology, medicine, music, martial arts, technical analysis), rise above all the rest and you are one of them…you have ‘the gift’…and that’s why I’m a Trader’s Gold member. —SM |
The best of them JL 2
The best of them …Last couple of years, I subscribed to several ‘market traders’. You are by far the best of them and the personal contact is awesome. Daily and daily updates are very well written! Besides your expertise in EW, I also like your cycles analysis. Best investment I ever made! —JL |
A true expert in Elliott Wave FL 2
A true expert in Elliott Wave …You are a true expert in EW analysis. What you provide is not available anywhere and is priceless. Subscription on your services is the best thing I have ever done. Many thanks for your effort to make me a better investor. I now have more trust in my investment decisions. I hope you will continue the excellent work! —FL |
Have not had a losing week RW 2
Have not had a losing week …I have been with Peter almost a year. The only thing that matters is have I made money with his service. I think I have finally turned the corner using Peter’s EW. I have not had a losing week in the last 5 months. Thanks Peter, for your amazing amount of hard work. —RW |
Get an upper hand … JC 2
Get an upper hand in trading …Seeing all the different currency pairs and the wave structures and hearing you explain why this has to do that on a nightly bases gives one a upper hand when trading. Elliott Wave applies to all stock and indices and can be applied to any candlestick chart. If someone ask what you want for Christmas – Tell them a membership to Peter’s “Traders Gold!”—JC |
Couldn’t be happier … KK 2
Couldn’t be happier …The analysis and insight you provide is simply amazing! I’ve been trading the futures and equity markets for well over thirty years and usually average around 5% monthly. Since joining your Traders Gold Service two months ago, that number has better than doubled. I couldn’t be happier.—KK |
the real deal SM 2
The real deal …‘Educational, insightful and thorough market analysis for all levels of traders. It’s Elliott Wave at its best….Peter Temple is the real deal’ —SM |
US Market Snapshot (based on end-of-week wave structure)
This chart is posted to provide a prediction of future market direction. DO NOT trade based upon the information presented here (certainly NOT from a daily chart).
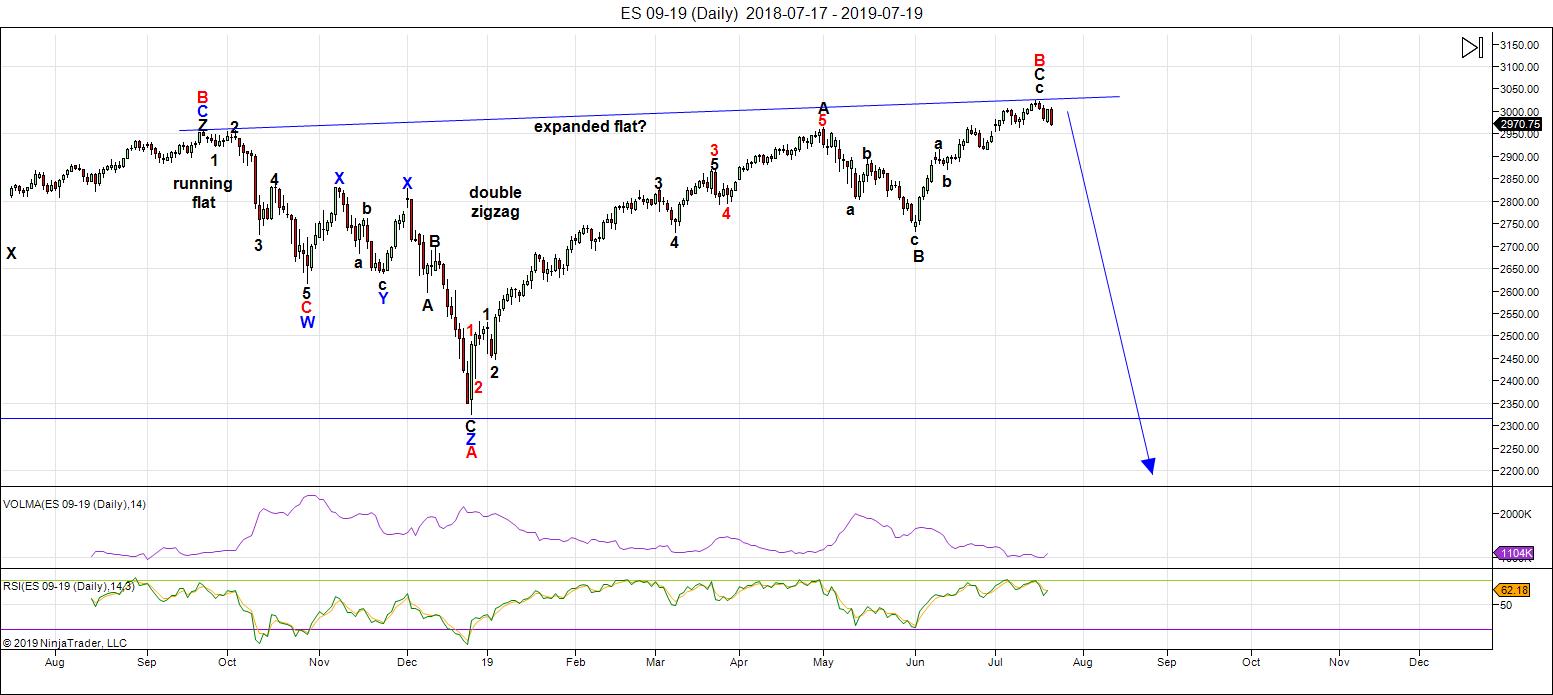
Above is the daily chart of ES (click to enlarge, as with any of my charts).
This week will be an important week that may give us a good indication of timing for a top. This week, we were set up in a questionable ending diagonal (which ended up with trendline which were slightly diverging (which is not a particularly good sign for a top in progress).
On Friday late in the day, the potential ending diagonal broke and now we have a potentially deeper fourth wave to contend with, which will likely add much more time to the topping process — how much time, depends upon how far the fourth wave drops. My preference is for a drop to the 2890 area.
The waves down are corrective, which means we're still looking for a top. The big question in my mind: "Is this drop going to end up postponing a top until early September?" After the fourth wave bottoms, if we end up tracing out a triangle or ending diagonal, that timeframe becomes easily the most likely.
It would still end up producing a flat, as the final wave up is not likely to get much above the current high, perhaps to the 3040 area or a few points higher. It's too early to attempt to select a final target for a top.
Longer term, I'm expecting the C wave of a an expanded flat to the downside. In that case, a first wave should drop to the 2725 area (previous fourth of one lesser degree) and then bounce in a second wave to the 2875 area (62% retrace), before a third wave down to about 2250. After that, a fourth and fifth wave down to under 2100 will round out the drop.
There is an option of a set of zigzags down to the same level, but it's less probable because there are so many flats set up across multiple stocks and indices. If a zigzag is the pattern that traces out, the retraces up will not be as strong as they would be with the C wave of a flat. We'll get a lot of information about the probable path from the first wave down.
The coming drop will be a world-wide phenomenon across all most all sectors. It will last throughout the summer months and most likely culminate in a low and final round of QE.
As I've said since the low on Dec. 26, the waves up are corrective in the NYSE-related indices, and as a result, will completely retrace. Expect an imminent top and a major move to a new low under 2100.
Summary: We have a delay in the expected top, which may add a few more weeks to the process. As the waves down are corrective, we still need to put in a top. This wave down is most likely a fourth wave, with a downside target of around 2890. The larger pattern is a record-breaking broadening top (not an EW pattern).
Once we have a final top in place, I'm looking for a dramatic drop in a 4th wave to a new low. ES will eventually target the previous fourth wave area somewhere under 2100.
Once we've completed the fourth wave down, we'll have a long climb to a final new high in a fifth wave of this 500 year cycle top.
___________________________
Trader's Gold Subscribers get a comprehensive view of the market, including hourly (and even smaller timeframes, when appropriate) on a daily basis. They also receive updates through the comments area. I provide only the daily timeframe for the free blog, as a "snapshot" of where the market currently trades and the next move on a weekly basis.
I do a nightly video on the US indices, USD Index (and related currency pairs), gold, silver, and oil).
______________________________________
Sign up for: The Chart Show
Cancelled this week due to technical issues
Next Date: Wednesday, July 31 at 5:00 pm EST (US market time)

The Chart Show is a one hour webinar in which Peter Temple provides the Elliott Wave analysis in real time for the US market, gold, silver, oil, major USD currency pairs, and more. You won't find a more accurate or comprehensive market prediction anywhere for this price.
Get caught up on the market from an Elliott Wave perspective. There’ll be a Q&A session during and at the end of the webinar and the possibility (depending on time) of taking requests.
For more information and to sign up, click here.
| "I think you are the only Elliot Wave technician on the planet who knows what he's doing.” |
| m.d. (professional trader) |
All registrants will receive the video playback of the webinar, so even if you miss it, you’ll be sent the full video replay within about an hour of its conclusion.


