
 They’re All Lining Up
If you were in the Chart Show this past Wednesday, you caught a really good one! I showed how virtually everything I cover is set up at inflection. There are flats of one type of another all over the place.
Last weekend, I said that I expected the topping process to last into this coming week, and here we are. We have virtually a full count in the US indices (with just a bit more to go in the final subwaves).
My preferred timing for a turn is around the full moon and solar eclipse on July 16. Along with that is the fact that earnings season happens the day after, on July 17, when Alcoa reports (AA). We could certainly hang up here a bit longer, but we’re so close to a top that it could happen anytime after about mid-week, by my estimation.
I expect a lot of red from companies in the next few weeks as they come to terms with Q2 reporting reality. After the share buy-back frenzy in recent months, corporate debt is at an all-time high. At the same time, consumer purchases are way down. You just to take a look at the automotive market to know how dire the economic situation really is.
Italy is in trouble (Spain not far behind), Britain is in turmoil with an election next month and a Halloween deadline for Brexit. Ebola is raising its ugly head and the addition of a measles outbreak is killing thousands in the Congo faster than ever before. I’ve warned for years about a coming pandemic.
On top of that, Deutsche Bank is on its last legs and there’s a sense that the end might be a lot closer than a lot of people think it is. Usually, something breaks at a market top, giving those that don’t understand technical analysis (and how the market really moves) an opportunity to blame an event. After all, we have to keep all those pundits employed!
So, we’ll keep a weather eye open! (an apt expression, since being a sailor, I’d usually much rather be doing that …. except for the next few weeks!
What’s extraordinary from my perspective is that we have Elliott Wave flats of one type of another setting up across indices, gold, and several stocks. So I think we’re for the most part, locked into a 5 wave pattern on the downside (after the top). I’ve never before seen so many market assets at inflection points (internationally).
______________________________
Checking in on The Russell 2000
One of the key indices to watch is IWM (the Russell 2000), which needs a new high at 161.
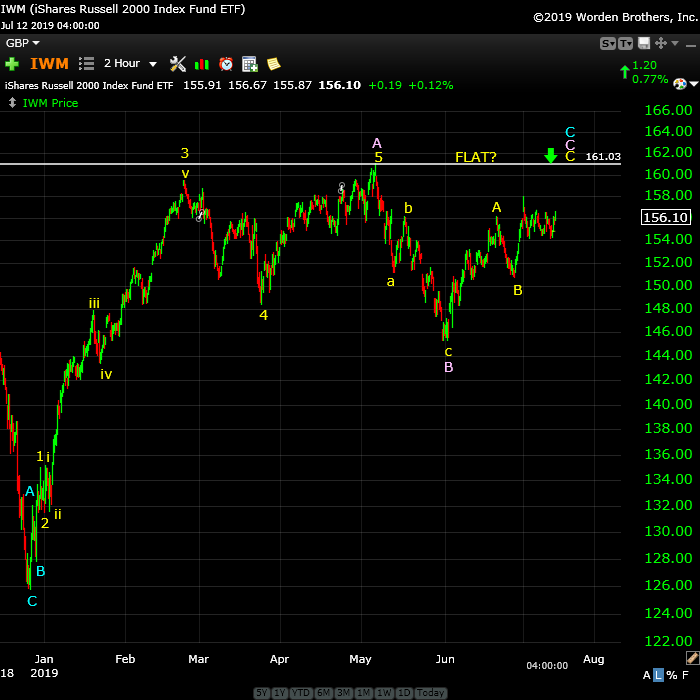
Above is the 2 hour chart of IWM, the EFT for the Russel 2000. It’s in the final fifth wave which needs a new high in the 161 area, due to the fact that the previous wave down is in three waves and must be fully retraced. This index may be the straggler of the US equities indices, as the rest are very much closer to targets. But as of this weekend, there are only 5 points left to go.
Note that the wave down is in three waves and the wave up is also in three waves, which means we likely have a flat (3-3-5 pattern). I’d expect a 5 waver, C wave down to a new low below 144.00.
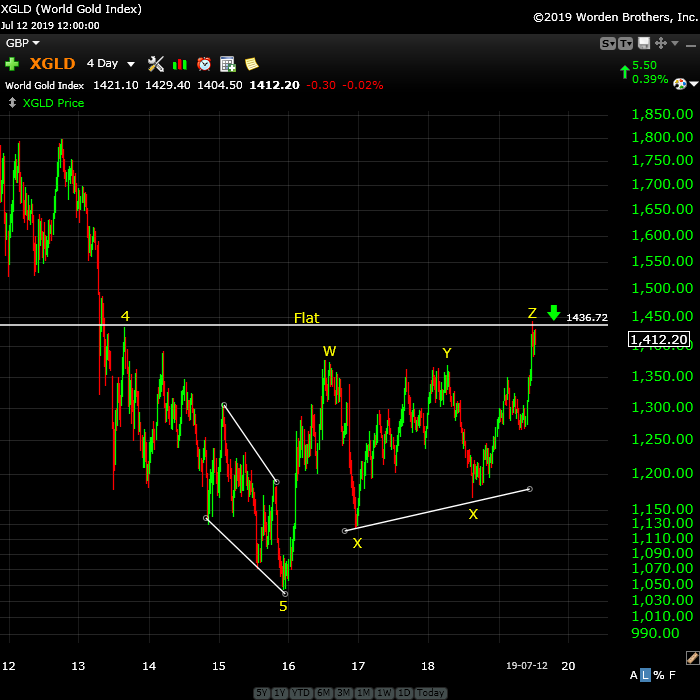
Above is the 4 day chart of XGLD (gold). You can see the same setup exactly in GLD, which offers a more accessible way to trade this setup. The pattern here is yet another flat. It’s a fourth wave flat (very common), with three waves down from the previous 4th wave, then three waves up to the 1436 area. Expect a 5 waver in a C wave down to at least the 1043 area (and it could go much lower).
Adding support to this prognosis is the fact that long exposure is at record highs and it’s hit the main stream media, which is always a sign we’re about to turn in the other direction!
___________________________
Elliott Wave Basics
Here is a page dedicated to a relatively basic description of the Elliott Wave Principle. You’ll also find a link to the book by Bob Prechter and A. J. Frost.
______________________________
Have not had a losing week RW 2
Have not had a losing week …I have been with Peter almost a year. The only thing that matters is have I made money with his service. I think I have finally turned the corner using Peter’s EW. I have not had a losing week in the last 5 months. Thanks Peter, for your amazing amount of hard work. —RW |
Couldn’t be happier … KK 2
Couldn’t be happier …The analysis and insight you provide is simply amazing! I’ve been trading the futures and equity markets for well over thirty years and usually average around 5% monthly. Since joining your Traders Gold Service two months ago, that number has better than doubled. I couldn’t be happier.—KK |
Get an upper hand … JC 2
Get an upper hand in trading …Seeing all the different currency pairs and the wave structures and hearing you explain why this has to do that on a nightly bases gives one a upper hand when trading. Elliott Wave applies to all stock and indices and can be applied to any candlestick chart. If someone ask what you want for Christmas – Tell them a membership to Peter’s “Traders Gold!”—JC |
the real deal SM 2
The real deal …‘Educational, insightful and thorough market analysis for all levels of traders. It’s Elliott Wave at its best….Peter Temple is the real deal’ —SM |
The best of them JL 2
The best of them …Last couple of years, I subscribed to several ‘market traders’. You are by far the best of them and the personal contact is awesome. Daily and daily updates are very well written! Besides your expertise in EW, I also like your cycles analysis. Best investment I ever made! —JL |
Rise above the rest … SM 2
Rise above the rest …I have only ever met a few people who, in their chosen fields (astrology, medicine, music, martial arts, technical analysis), rise above all the rest and you are one of them…you have ‘the gift’…and that’s why I’m a Trader’s Gold member. —SM |
A true expert in Elliott Wave FL 2
A true expert in Elliott Wave …You are a true expert in EW analysis. What you provide is not available anywhere and is priceless. Subscription on your services is the best thing I have ever done. Many thanks for your effort to make me a better investor. I now have more trust in my investment decisions. I hope you will continue the excellent work! —FL |
Tops in your field DZ 2
Tops in your field …You are tops in your field. Tried to follow Elliot Wave international for years. They were always behind the market. After discovering you, I perceive that you are an expert in reading the waves, which puts you way ahead of the rest of your peers. And you can read the Waves like you are reading tomorrow’s financial section. I pray you stay healthy. —DZ |
US Market Snapshot (based on end-of-week wave structure)
This chart is posted to provide a prediction of future market direction. DO NOT trade based upon the information presented here (certainly NOT from a daily chart).
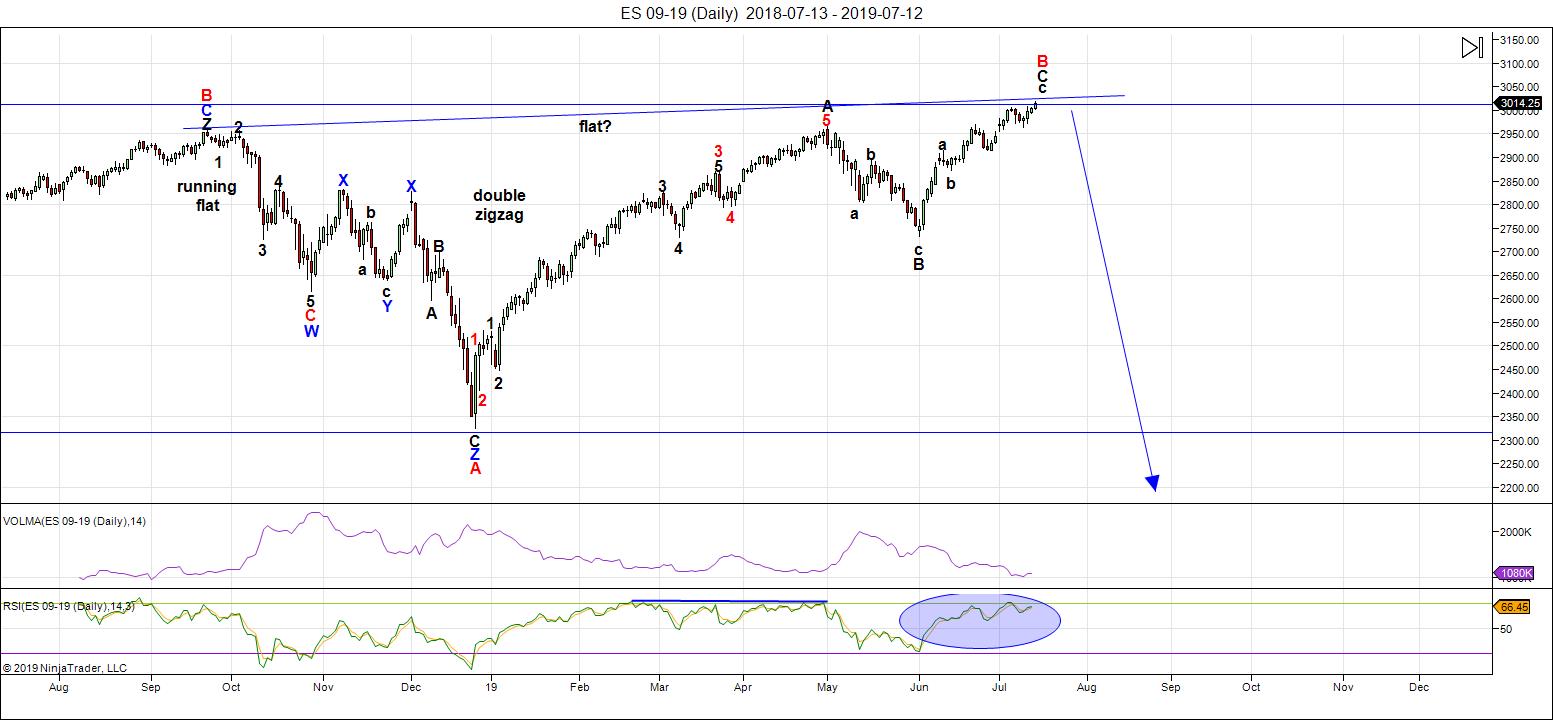
Above is the daily chart of ES (click to enlarge, as with any of my charts).
The direction remains up in the US indices, but not for much longer. We're set up in ES, the sp500, and the DOW as an expanded flat. That suggests very strongly (because we seem to have flats all over the place) that we're going to get a devastating drop to below 2100 in ES and the SP500 that will be in five waves. I think the target will be closer to 1900 for ES and the SP500, but that remains to be seen.
The wave structure of these waves up from June 3 (in what appears to be the last wave of a broadening top formation — also called a megaphone formation) are not what you'd expect for a final wave of a rally; they're corrective and missing the usual signposts (a broadening top is not an Elliott Wave pattern and it's described in Murphy's well-known and respected book on technical analysis as "an unusually difficult pattern to trade").
It certainly has been that: a most difficult pattern to trade!
I'm expecting the C wave of a an expanded flat to the downside. In that case, a first wave should drop to the 2725 area (previous fourth of one lesser degree) and then bounce in a second wave to the 2875 area (62% retrace), before a third wave down to about 2250. After that, a fourth and fifth wave down to under 2100 will round out the drop.
There is an option of a set of zigzags down to the same level, but it's less probable because there are so many flats set up across multiple stocks and indices. If a zigzag is the pattern that traces out, the retraces up will not be as strong as they would be with the C wave of a flat. We'll get a lot of information about the probable path from the first wave down.
The coming drop will be a world-wide phenomenon across all most all sectors. It will last throughout the summer months and most likely culminate in a low and final round of QE.
As I've said since the low on Dec. 26, the waves up are corrective in the NYSE-related indices, and as a result, will completely retrace. Expect an imminent top and a major move to a new low under 2100.
Summary: Expect an imminent top (very possibly this week) to complete this large, corrective "B wave" up from the Dec. 26 low. The larger pattern is a record-breaking broadening top (not an EW pattern).
I'm looking for a dramatic drop in a 4th wave to a new low. ES will eventually target the previous fourth wave area somewhere under 2100.
Once we've completed the fourth wave down, we'll have a long climb to a final new high in a fifth wave of this 500 year cycle top.
___________________________
Trader's Gold Subscribers get a comprehensive view of the market, including hourly (and even smaller timeframes, when appropriate) on a daily basis. They also receive updates through the comments area. I provide only the daily timeframe for the free blog, as a "snapshot" of where the market currently trades and the next move on a weekly basis.
I do a nightly video on the US indices, USD Index (and related currency pairs), gold, silver, and oil).
______________________________________
Sign up for: The Chart Show
Next Date: Wednesday, July 17 at 5:00 pm EST (US market time)

The Chart Show is a one hour webinar in which Peter Temple provides the Elliott Wave analysis in real time for the US market, gold, silver, oil, major USD currency pairs, and more. You won't find a more accurate or comprehensive market prediction anywhere for this price.
Get caught up on the market from an Elliott Wave perspective. There’ll be a Q&A session during and at the end of the webinar and the possibility (depending on time) of taking requests.
For more information and to sign up, click here.
| "I think you are the only Elliot Wave technician on the planet who knows what he's doing.” |
| m.d. (professional trader) |
All registrants will receive the video playback of the webinar, so even if you miss it, you’ll be sent the full video replay within about an hour of its conclusion.


Comments on this entry are closed.
Thanks for the update Peter :- )
This is certainly going to be an interesting week .
Mercury has its mid point July 17
Lunar eclipse July 16 .
Next date being mid August .
We have a set up for a mini crash
I always add 10 days to the start of the mercury retrograde cycle
And typically it’s a low ( it’s not looking like a low today )
Add 10 days to the end point you get August 12 .
Add 6 weeks to the July 2 solar eclipse you get mid August as well .
Everything is great when it’s working and I don’t want to admit
I’m wrong .
That said I’m not liking this set up .
It’s a bearish set up until proven wrong .
Mercury Retrograde Dates in 2019
In 2019, Mercury will be in retrograde three times, during the date ranges of:
July 7 to August 2
October 31 to November 20
peter: as you mentioned , after the wave iv drop to around 2100, there will be another final run up to the 500 year top, according to your count , the run up to the 500 year top will be inflationary , and after the top when market crashing down it will be deflationary? am I read it correctly?
thanks
shunn
yes.