
 The US Dollar – Bigger Picture
There was an article in Zerohedge at the end of this past week that compelled me to do a long overdue technical analysis of the US Dollar Index. The article is about the work some countries have undertaken to develop and alternative to the SWIFT system, which has been weaponized by the US government against anyone it finds disfavour with.
The Article is “EU Announces Channel To Circumvent SWIFT And Iran Sanctions Is Now Operational.“
At the present time, all major international transactions must be done using the American dollar (oil particularly) and any action that reduces the need to use the dollar is deflationary.
We US Dollar chart warns of deflation in the longer term, so the technicals seem to be consistent with the fundamentals. However, the dollar chart is corrective and doesn’t have a huge upside, so this may mean that something else causes a reversal sometime in the future. However, based up the time the dollar takes to move an appreciable distance, that event is likely several years away.
USDollarIndexJuly2019  |
 |
Make sure you zoom the video to full size with frame expander (arrows) in the bottom right hand corner and also set the quality to as high as your web connection allows. This is a high definition (HD) quality video so the best viewing is at that level. |
______________________________
Checking in on The Russell 2000
One of the key indices to watch is IWM (the Russell 2000), which needs a new high.
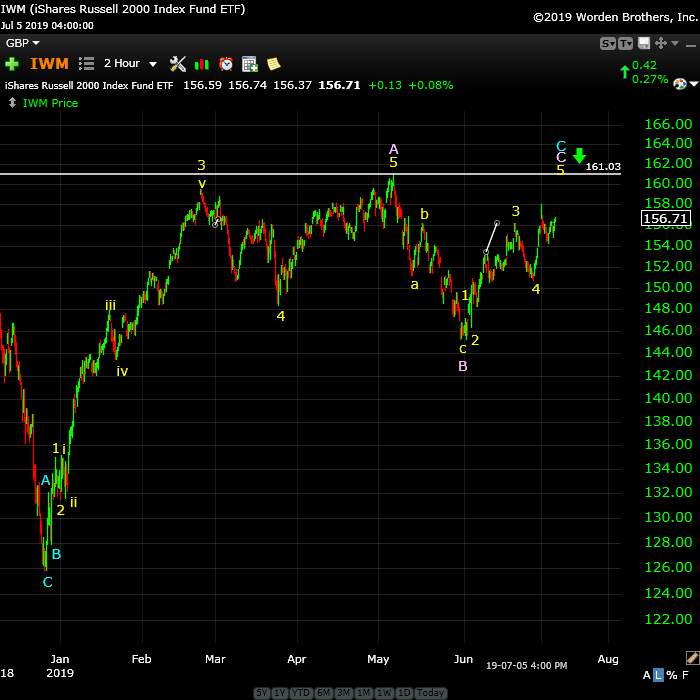
Above is the 2 hour chart of IWM, the EFT for the Russel 2000. It’s in the final fifth wave which needs a new high in the 161 area, due to the fact that the previous wave down is in three waves and must be fully retraced.
___________________________
Elliott Wave Basics
Here is a page dedicated to a relatively basic description of the Elliott Wave Principle. You’ll also find a link to the book by Bob Prechter and A. J. Frost.
____________________________
Registration for Commenting
Want to comment? You need to be logged in to comment. You can register here.
If you register, it protects your information. It also allows you to comment without filling in your information each time. Once you’re registered, simply go to the home page and click on the login link top right in order to log yourself in. Usually, you’ll be logged in for several days before needing to be logged in again.
______________________________
Problem receiving blog comment emails? Try whitelisting the address. More info.
______________________________
Get an upper hand … JC 2
Get an upper hand in trading …Seeing all the different currency pairs and the wave structures and hearing you explain why this has to do that on a nightly bases gives one a upper hand when trading. Elliott Wave applies to all stock and indices and can be applied to any candlestick chart. If someone ask what you want for Christmas – Tell them a membership to Peter’s “Traders Gold!”—JC |
The best of them JL 2
The best of them …Last couple of years, I subscribed to several ‘market traders’. You are by far the best of them and the personal contact is awesome. Daily and daily updates are very well written! Besides your expertise in EW, I also like your cycles analysis. Best investment I ever made! —JL |
A true expert in Elliott Wave FL 2
A true expert in Elliott Wave …You are a true expert in EW analysis. What you provide is not available anywhere and is priceless. Subscription on your services is the best thing I have ever done. Many thanks for your effort to make me a better investor. I now have more trust in my investment decisions. I hope you will continue the excellent work! —FL |
Have not had a losing week RW 2
Have not had a losing week …I have been with Peter almost a year. The only thing that matters is have I made money with his service. I think I have finally turned the corner using Peter’s EW. I have not had a losing week in the last 5 months. Thanks Peter, for your amazing amount of hard work. —RW |
Rise above the rest … SM 2
Rise above the rest …I have only ever met a few people who, in their chosen fields (astrology, medicine, music, martial arts, technical analysis), rise above all the rest and you are one of them…you have ‘the gift’…and that’s why I’m a Trader’s Gold member. —SM |
the real deal SM 2
The real deal …‘Educational, insightful and thorough market analysis for all levels of traders. It’s Elliott Wave at its best….Peter Temple is the real deal’ —SM |
Couldn’t be happier … KK 2
Couldn’t be happier …The analysis and insight you provide is simply amazing! I’ve been trading the futures and equity markets for well over thirty years and usually average around 5% monthly. Since joining your Traders Gold Service two months ago, that number has better than doubled. I couldn’t be happier.—KK |
Tops in your field DZ 2
Tops in your field …You are tops in your field. Tried to follow Elliot Wave international for years. They were always behind the market. After discovering you, I perceive that you are an expert in reading the waves, which puts you way ahead of the rest of your peers. And you can read the Waves like you are reading tomorrow’s financial section. I pray you stay healthy. —DZ |
US Market Snapshot (based on end-of-week wave structure)
This chart is posted to provide a prediction of future market direction. DO NOT trade based upon the information presented here (certainly NOT from a daily chart).

Above is the daily chart of ES (click to enlarge, as with any of my charts).
The direction remains up in the US indices, but not for much longer. This weekend, I put us in the fourth wave of a larger final fifth wave. The target is above 3000 in ES and could go up to the 3040s.
The wave structure of these waves up from June 3 (in what appears to be the last wave of a broadening top formation — also called a megaphone formation) are not what you'd expect for a final wave of a rally; they're corrective and missing the usual signposts (a broadening top is not an Elliott Wave pattern and it's described in Murphy's well-known and respected book on technical analysis as "an unusually difficult pattern to trade").
This weekend, we may still looking for the bottom of this small fourth wave from Friday.
Once that bottom is in place, we'll be looking for a new high across the SP500, the DOW, the Nasdaq, and all the other NYSE sub-indices. The turn down from that high will lead to what I believe will be five waves down over the balance of the summer to a bottom below 2100 in ES.
I'm expecting the C wave of an expanded flat to the downside. The C wave of an expanded flat has the same outcome as that of a regular flat. It will typically be 100-165% of the length of the A wave. An expanded flat is a regular flat with A B wave that is at least 105% the length of the A wave (it rises 5% above the top of the A wave, in this case, which is has done.
There is an option of a set of zigzags down to the same level. If that's the pattern that traces out, the retraces will not be as strong as they would be with the C wave of a flat. We'll get a lot of information about the most probable path from the first wave down.
The coming drop will be a world-wide phenomenon across all most all sectors. It will last throughout the summer months and most likely culminate in a low and final round of QE.
As I've said since the low on Dec. 26, the waves up are corrective in the NYSE-related indices, and as a result, will completely retrace. Expect an imminent top and a major move to a new low under 2100.
Finally, something often "breaks" at the tops of major rallies, and a new article out today regarding the current status of Deutsche Bank is signalling that we might have the making of another Lehman on our hands. The article is "The Deutsche Bank As You Know It Is No More." Time to pay attention to what's happening on the international banking front.
Summary: Expect an imminent top (week or so, perhaps) to complete this large, corrective "B wave" up from the Dec. 26 low. The overall pattern is a record-breaking broadening top (not an EW pattern).
I'm looking for a dramatic drop in a 4th wave to a new low. ES will eventually target the previous fourth wave area somewhere under 2100.
Once we've completed the fourth wave down, we'll have a long climb to a final new high in a fifth wave of this 500 year cycle top.
___________________________
Trader's Gold Subscribers get a comprehensive view of the market, including hourly (and even smaller timeframes, when appropriate) on a daily basis. They also receive updates through the comments area. I provide only the daily timeframe for the free blog, as a "snapshot" of where the market currently trades and the next move on a weekly basis.
I do a nightly video on the US indices, USD Index (and related currency pairs), gold, silver, and oil).
______________________________________
Sign up for: The Chart Show
Next Date: Wednesday, July 17 at 5:00 pm EST (US market time)

The Chart Show is a one hour webinar in which Peter Temple provides the Elliott Wave analysis in real time for the US market, gold, silver, oil, major USD currency pairs, and more. You won't find a more accurate or comprehensive market prediction anywhere for this price.
Get caught up on the market from an Elliott Wave perspective. There’ll be a Q&A session during and at the end of the webinar and the possibility (depending on time) of taking requests.
For more information and to sign up, click here.
| "I think you are the only Elliot Wave technician on the planet who knows what he's doing.” |
| m.d. (professional trader) |
All registrants will receive the video playback of the webinar, so even if you miss it, you’ll be sent the full video replay within about an hour of its conclusion.


Comments on this entry are closed.
A new weekend post is live at: https://worldcyclesinstitute.com/the-all-the-same-market-line-up/