
 Fake-out at the Top
After the apparent wave failure of last week, the market turned right back up this week. Tops are a process and this one is has been hanging on as the really big ones almost always do.
But, the waves don’t lie. The week began with a rally into what appeared to be the third wave of an ending diagonal. That wave appeared to have topped at the end of the day on Friday.
The US indices are setting up for a turn right across the indices. There are potential flats in place topped with ending diagonals. I don’t know how a market could be more obviously telegraphing a major turn coming very soon.
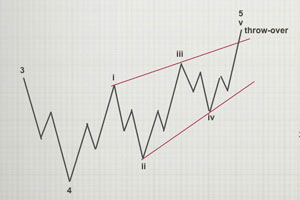
So what we were seeing last week was the first wave of an ending diagonal, which needs to be in three waves. But ending diagonals are rare and you can’t be certain they’re the pattern of choice until the their fourth waves are in place. However, the pattern this time, is almost textbook.
The larger wave structure up from June 3 (in what appears to be the last wave of a broadening top formation — also called a “megaphone formation”) are not what you’d expect for a final wave of a rally; they’re corrective and missing the usual signposts (a broadening top is not an Elliott Wave pattern and it’s described in Murphy’s well-known and respected book on technical analysis as “an unusually difficult pattern to trade“).
It certainly has been that: a most difficult set of subwaves to predict!
Gold seems to be tracing out an ending diagonal and silver is in a larger one, as has been for some time.
Tops are prolonged, frustrating affairs at the best of times. Add in the summer doldrums, really low volume, and the fact that absolutely everything is moving together as one (and must top at the same time), you have a very frustrating situation.
My market rule: The market does the most predictable thing in the most unpredictable manner.
Italy is in trouble (Spain not far behind), Britain is in turmoil (even after the recent election) with a Halloween deadline for Brexit. Ebola is raising its ugly head and the addition of a measles outbreak is killing thousands in the Congo faster than ever before. I’ve warned for years about a coming pandemic.
On top of that, Deutsche Bank is on its last legs and there’s a sense that the end might be a lot closer than a lot of people think it is. Usually, something breaks at a market top, giving those that don’t understand technical analysis (and how the market really moves) an opportunity to blame an event. After all, we have to keep all those pundits employed!
______________________________
Checking in on The Russell 2000
One of the key indices to watch is IWM (the Russell 2000), which needs a new high at 161.
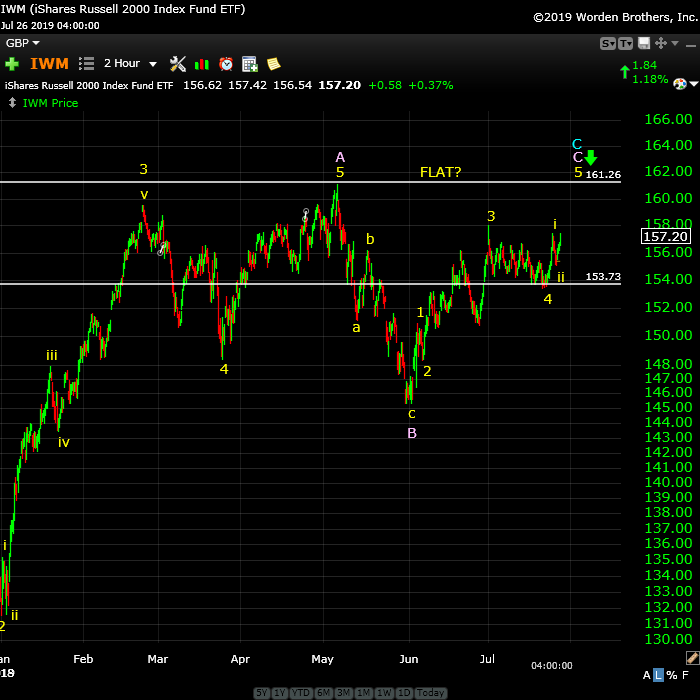
Above is the 2 hour chart of IWM, the ETF for the Russel 2000. It’s now in the final fifth wave after going sideways in a fourth waves for several weeks. As I’ve being saying, it needs a new high in the 161 area, due to the fact that the previous wave down is in three waves and must be fully retraced.
When we reach the 161 area, we have a potential flat (3-3-5 pattern). Note that guidelines for a flat say the B wave (which is the wave we’re in) only has to retrace 90% of the A wave down. So, it’s possible that we will not make the 161 number (90% is at about 159.40), but my preference is a test of the 161 level at least.
___________________________
Elliott Wave Basics
Here is a page dedicated to a relatively basic description of the Elliott Wave Principle. You’ll also find a link to the book by Bob Prechter and A. J. Frost.
______________________________
A true expert in Elliott Wave FL 2
A true expert in Elliott Wave …You are a true expert in EW analysis. What you provide is not available anywhere and is priceless. Subscription on your services is the best thing I have ever done. Many thanks for your effort to make me a better investor. I now have more trust in my investment decisions. I hope you will continue the excellent work! —FL |
Have not had a losing week RW 2
Have not had a losing week …I have been with Peter almost a year. The only thing that matters is have I made money with his service. I think I have finally turned the corner using Peter’s EW. I have not had a losing week in the last 5 months. Thanks Peter, for your amazing amount of hard work. —RW |
Couldn’t be happier … KK 2
Couldn’t be happier …The analysis and insight you provide is simply amazing! I’ve been trading the futures and equity markets for well over thirty years and usually average around 5% monthly. Since joining your Traders Gold Service two months ago, that number has better than doubled. I couldn’t be happier.—KK |
the real deal SM 2
The real deal …‘Educational, insightful and thorough market analysis for all levels of traders. It’s Elliott Wave at its best….Peter Temple is the real deal’ —SM |
The best of them JL 2
The best of them …Last couple of years, I subscribed to several ‘market traders’. You are by far the best of them and the personal contact is awesome. Daily and daily updates are very well written! Besides your expertise in EW, I also like your cycles analysis. Best investment I ever made! —JL |
Rise above the rest … SM 2
Rise above the rest …I have only ever met a few people who, in their chosen fields (astrology, medicine, music, martial arts, technical analysis), rise above all the rest and you are one of them…you have ‘the gift’…and that’s why I’m a Trader’s Gold member. —SM |
Tops in your field DZ 2
Tops in your field …You are tops in your field. Tried to follow Elliot Wave international for years. They were always behind the market. After discovering you, I perceive that you are an expert in reading the waves, which puts you way ahead of the rest of your peers. And you can read the Waves like you are reading tomorrow’s financial section. I pray you stay healthy. —DZ |
Get an upper hand … JC 2
Get an upper hand in trading …Seeing all the different currency pairs and the wave structures and hearing you explain why this has to do that on a nightly bases gives one a upper hand when trading. Elliott Wave applies to all stock and indices and can be applied to any candlestick chart. If someone ask what you want for Christmas – Tell them a membership to Peter’s “Traders Gold!”—JC |
US Market Snapshot (based on end-of-week wave structure)
This chart is posted to provide a prediction of future market direction. DO NOT trade based upon the information presented here (certainly NOT from a daily chart).
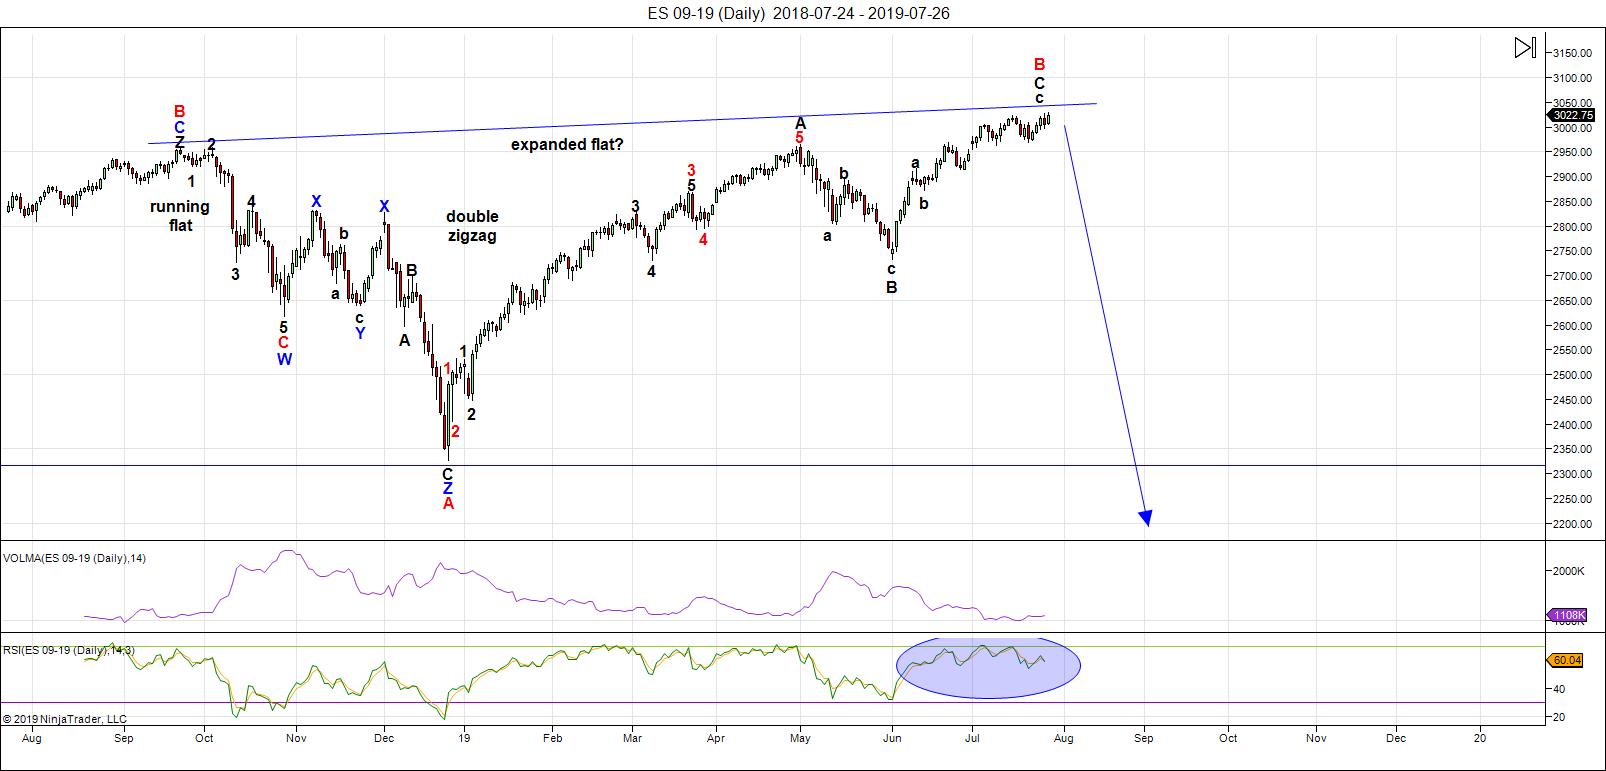
Above is the daily chart of ES (click to enlarge, as with any of my charts).
I'm looking at this coming week as providing a good probability we'll see a top in the US indices.
We appear to have ending diagonals playing out in ES/NQ, the NDX, and SP500. The third wave appears to be in place. My preference now for ES is for a drop to in a fourth wave, following by one more wave up to a slight new high.
I'll be looking for a trend change sometime soon after the Fed announcement on July 31.
Ending diagonals are ending patterns. They mark the end of the trend and are known for dramatic turns in the opposite direction.
The larger pattern, as I've been saying for weeks now, appears to be a flat, which is making itself apparent in the DOW, SP500, NYSE, the Russell 3000, and very possibly, the Russell 2000.
Longer term, I'm expecting the C wave of a an expanded flat to the downside. In that case, a first wave should drop to the 2725-30 area (previous fourth of one lesser degree) and then bounce in a second wave to the 2875 area (62% retrace), before a third wave down to about 2250. After that, a fourth and fifth wave down to under 2100 will round out the drop.
There is an option of a set of zigzags down to the same level, but it's less probable because there are so many flats set up across multiple stocks and indices. If a zigzag is the pattern that traces out, the retraces up will not be as strong as they would be with the C wave of a flat. We'll get a lot of information about the probable path from the first wave down.
The coming drop will be a world-wide phenomenon across all most all sectors. It will last the balance of the summer months and most likely culminate in a low and final round of QE.
As I've said since the low on Dec. 26, the waves up are corrective in the NYSE-related indices, and as a result, will completely retrace. Expect an imminent top and a major move to a new low under 2100.
Summary: A top in the US equities appears imminent, with ending diagonals appearing across the major indices. These ending diagonals are marking the top of a flat pattern (3-3-5), which predicts a five wave drop to a new low below the A wave bottom at about 2300. The larger pattern in ES is a record-breaking broadening top (not an EW pattern).
Once we have a top in place, I'm looking for a dramatic drop in a 4th wave to a new low. ES will eventually target the previous fourth wave area somewhere under 2100.
Once we've completed the fourth wave down, we'll have a long climb to a final slight new high in a fifth wave of this 500 year cycle top.
___________________________
Trader's Gold Subscribers get a comprehensive view of the market, including hourly (and even smaller timeframes, when appropriate) on a daily basis. They also receive updates through the comments area. I provide only the daily timeframe for the free blog, as a "snapshot" of where the market currently trades and the next move on a weekly basis.
I do a nightly video on the US indices, USD Index (and related currency pairs), gold, silver, and oil).
______________________________________
Sign up for: The Chart Show
Next Date: Wednesday, August 6 at 5:00 pm EST (US market time)

The Chart Show is a one hour webinar in which Peter Temple provides the Elliott Wave analysis in real time for the US market, gold, silver, oil, major USD currency pairs, and more. You won't find a more accurate or comprehensive market prediction anywhere for this price.
Get caught up on the market from an Elliott Wave perspective. There’ll be a Q&A session during and at the end of the webinar and the possibility (depending on time) of taking requests.
For more information and to sign up, click here.
| "I think you are the only Elliot Wave technician on the planet who knows what he's doing.” |
| m.d. (professional trader) |
All registrants will receive the video playback of the webinar, so even if you miss it, you’ll be sent the full video replay within about an hour of its conclusion.


Comments on this entry are closed.
Thanks Peter, very interesting.
Do you understand this discrepency between TRAN and BDI?
http://schrts.co/XnSnxsRp
Very curious, isnt it?
Cheers
Serge
This website is for educational purposes relating to Elliott Wave, natural cycles, and the Quantum Revolution (Great Awakening). I welcome questions or comments about any of these subjects. Due to a heavy schedule, I may not have the time to answer questions that relate to my area of expertise.
I reserve the right to remove any comment that is deemed negative, is unhelpful, or off-topic. Such comments may be removed.
Want to comment? You need to be logged in to comment. You can register here.