
 A Challenging Final Leg
After a tumultuous week that was quite predictable (and lucrative for EW traders), on Friday, we bottomed.
That’s not to say we can’t retest the Friday lows. The waves up are questionable and based on news, which is never a good thing.
The prediction for August: sideways. I’ve been saying that if we didn’t get a top in July, we’ll look to September. Nothing much ever happens in August. Decision-makers aren’t around and market volume is just too darned weak.
That doesn’t mean there aren’t some great opportunities; there’s always another trade-train pulling into a station somewhere.
We’re heading “down the stretch.” For the month of August, most assets I cover will move in a single direction … one last wave playing out before the expected, dramatic drop. When they all cross the finish line (reach their final destinations), we’ll top. Because everything is moving in tandem, this particular top is more frustrating than usual. All the players need to top a the same time, which has also made analysis more difficult for the past three years (as these asset classes have gradually moved into sync with each other).
Meanwhile, real estate markets are reporting year-over-year drops and some markets, like Vancouver, are selling higher-end homes at 30% off. This is only the start. The 18.5 real estate cycle topped in mid 2018 (the low was in 2000) and we’ll eventually see prices down to below 20% of their current value. Deflation will level the playing field.
We’re up to seven major trucking companies in the US now that have gone bankrupt. I’ve been warning that we’ll see the transportation infrastructure collapse (international shipping is seeing the same phenomenon) and that means that getting product (like food) to major cities is going to be problematic at best.
Waiting in the wings is a Lehman-like event, as Deutsche Bank (Europe’s largest bank) is crumbling. This could be a factor as early as September.
Italy is in trouble (Spain not far behind), Britain is in turmoil (even after the recent election) with a Halloween deadline for Brexit. Ebola is raising its ugly head and the addition of a measles outbreak is killing thousands in the Congo faster than ever before. I’ve warned for years about a coming pandemic.
It’s time to start thinking about your safety and security (along with your energy supply, food, and water) for the long haul.
Tops are prolonged, frustrating affairs at the best of times. Add in the summer doldrums, really low volume, and the fact that absolutely everything is moving together as one (and must top at the same time), you have a very frustrating situation.
My market rule: The market does the most predictable thing in the most unpredictable manner.
The US Dollar Index
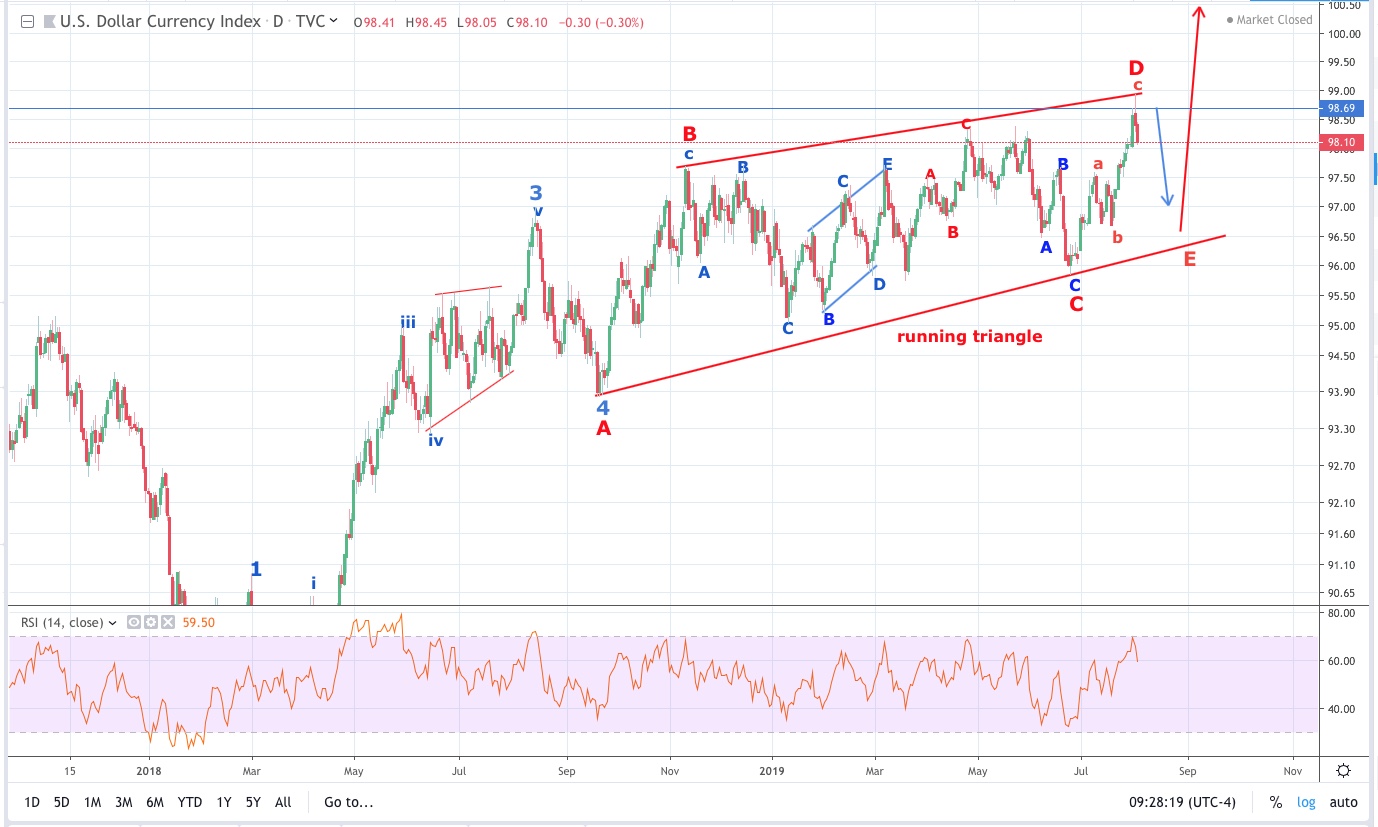
For the past several years, I’ve been writing about the importance of the US Dollar, as the reserve currency, to the international markets, which are all moving to a top at the same time.
The US Dollar Index is a basket of currencies, dominated by the US Dollar; it’s the one everyone watches.
The US Dollar is in an uptrend and the market has been moving more or less with its ups and downs. When the dollar moves down, the US indices move up, for example. The index is currently in a running triangle (a fourth wave) and within that triangle, it has begun its final move to the downside. Once it hits the lower trendline, the US indices should top.
The previous wave up took about a month to play out and I expect a similar timeframe to the trip to the lower trendine. The eventual turn will trigger a turn in the US market, gold, and oil (and international exchanges like TSE, ASX, and DAX).
It will be a devastating downturn that will likely result in a new round of quantitative easing at the bottom (top in the US Dollar Index) as everything reverses for a final wave in this 500 year rally in the US equities.
We’re getting close. Time to start thinking about the future and getting prepared for an entirely different world.
______________________________
Checking in on The Russell 2000
One of the key indices to watch is IWM (the Russell 2000), which needs a new high at 161.
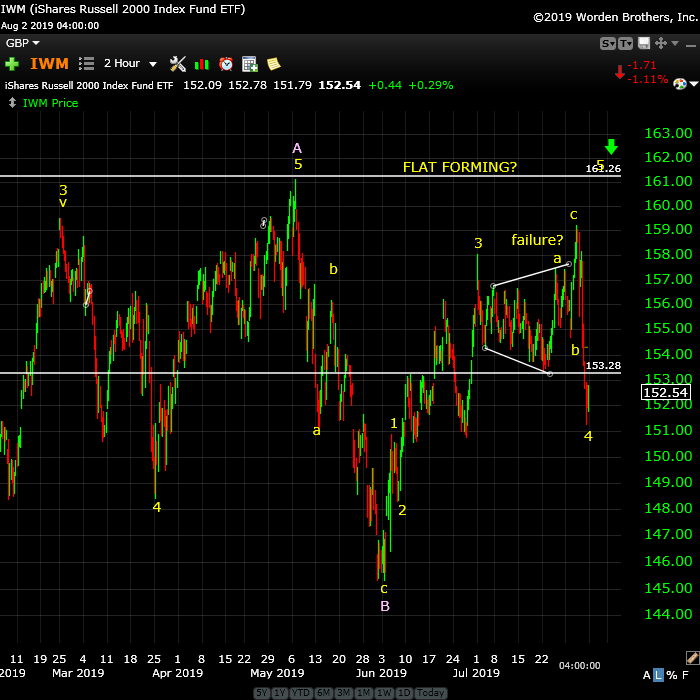
Above is the 2 hour chart of IWM, the ETF for the Russel 2000.
We got to within two dollars of our target this week and the pattern failed. I don’t even know how to label it, as it ended up being corrective. In any event, we ended up with a large 4th wave that came down to the area of the previous fourth wave of one lesser degree.
We turned back up on Friday, but I can’t rule out a test of Friday’s low before we rise in earnest. The target of 161 on the upside hasn’t changed.
When we reach the 161 area, we have a potential flat (3-3-5 pattern). Note that guidelines for a flat say the B wave (which is the wave we’re in) only has to retrace 90% of the A wave down. So, it’s possible that we will not make the 161 number (90% is at about 159.40), but my preference is a test of the 161 level at least.
___________________________
Elliott Wave Basics
Here is a page dedicated to a relatively basic description of the Elliott Wave Principle. You’ll also find a link to the book by Bob Prechter and A. J. Frost.
______________________________
A true expert in Elliott Wave FL 2
A true expert in Elliott Wave …You are a true expert in EW analysis. What you provide is not available anywhere and is priceless. Subscription on your services is the best thing I have ever done. Many thanks for your effort to make me a better investor. I now have more trust in my investment decisions. I hope you will continue the excellent work! —FL |
Tops in your field DZ 2
Tops in your field …You are tops in your field. Tried to follow Elliot Wave international for years. They were always behind the market. After discovering you, I perceive that you are an expert in reading the waves, which puts you way ahead of the rest of your peers. And you can read the Waves like you are reading tomorrow’s financial section. I pray you stay healthy. —DZ |
Have not had a losing week RW 2
Have not had a losing week …I have been with Peter almost a year. The only thing that matters is have I made money with his service. I think I have finally turned the corner using Peter’s EW. I have not had a losing week in the last 5 months. Thanks Peter, for your amazing amount of hard work. —RW |
the real deal SM 2
The real deal …‘Educational, insightful and thorough market analysis for all levels of traders. It’s Elliott Wave at its best….Peter Temple is the real deal’ —SM |
The best of them JL 2
The best of them …Last couple of years, I subscribed to several ‘market traders’. You are by far the best of them and the personal contact is awesome. Daily and daily updates are very well written! Besides your expertise in EW, I also like your cycles analysis. Best investment I ever made! —JL |
Rise above the rest … SM 2
Rise above the rest …I have only ever met a few people who, in their chosen fields (astrology, medicine, music, martial arts, technical analysis), rise above all the rest and you are one of them…you have ‘the gift’…and that’s why I’m a Trader’s Gold member. —SM |
Get an upper hand … JC 2
Get an upper hand in trading …Seeing all the different currency pairs and the wave structures and hearing you explain why this has to do that on a nightly bases gives one a upper hand when trading. Elliott Wave applies to all stock and indices and can be applied to any candlestick chart. If someone ask what you want for Christmas – Tell them a membership to Peter’s “Traders Gold!”—JC |
Couldn’t be happier … KK 2
Couldn’t be happier …The analysis and insight you provide is simply amazing! I’ve been trading the futures and equity markets for well over thirty years and usually average around 5% monthly. Since joining your Traders Gold Service two months ago, that number has better than doubled. I couldn’t be happier.—KK |
US Market Snapshot (based on end-of-week wave structure)
This chart is posted to provide a prediction of future market direction. DO NOT trade based upon the information presented here (certainly NOT from a daily chart).
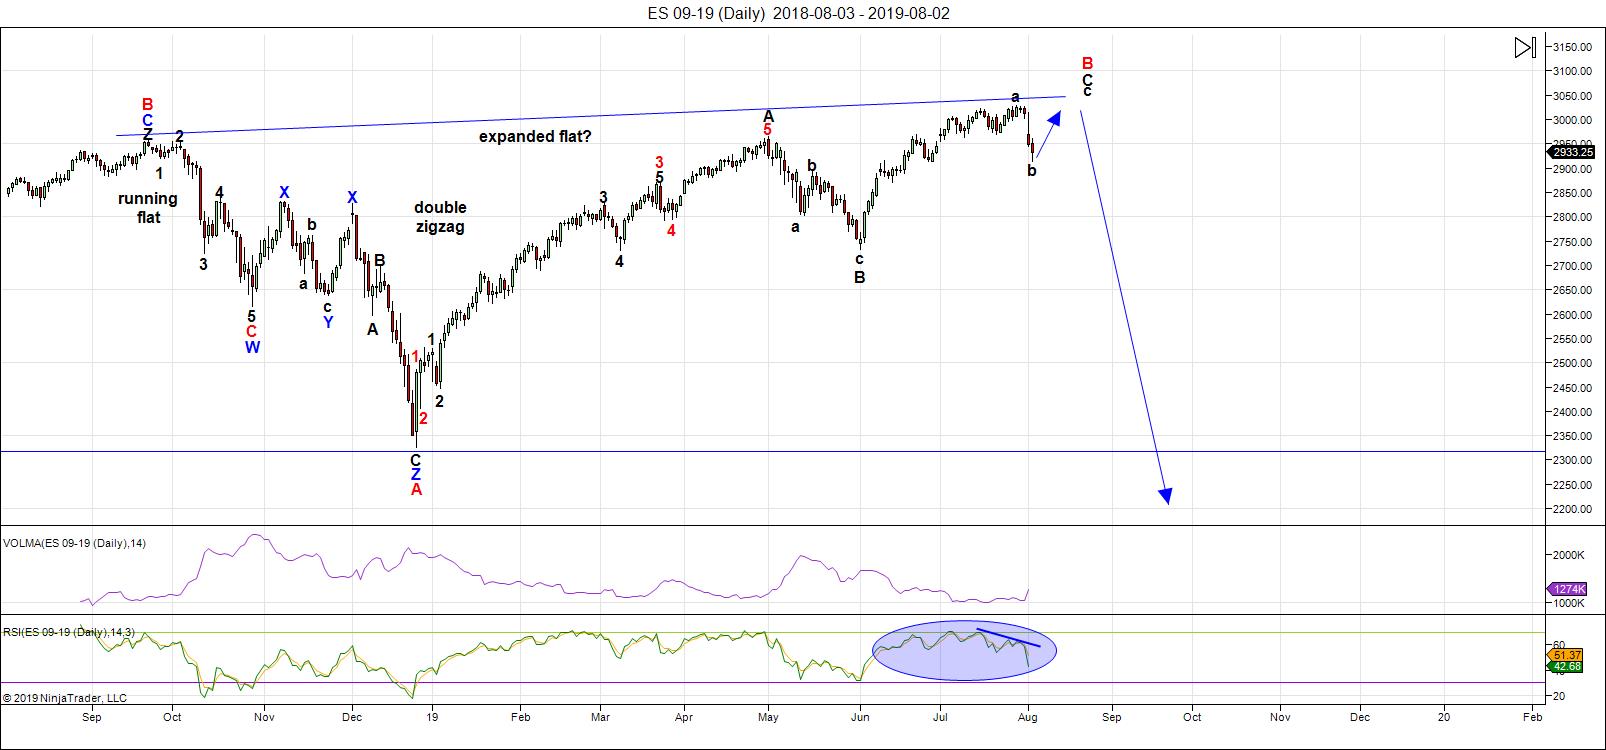
Above is the daily chart of ES (click to enlarge, as with any of my charts).
With the failure this week in some indices (most notably the Russell 2000 — the IWM chart above — and the SP500), you could consider us "back to square one."
In the SP500, the ending diagonal in play failed. However, in ES and NQ, it looks more like we had a five wave pattern up to a slight new high (more non-confirmation, or this too, is a failed diagonal). It doesn't matter, because we've dropped in a large B wave across the board and the count to a final high starts over again.
I don't have a target for a top; it's too early for that. The broadening top has a limit in the 3050 area, but we may not get that high. More importantly, perhaps, is the fact that the failure has dramatically pushed back the projected dates: I'm now looking towards September. If it's earlier, that would be great, but I don't think that'll be the case. We've never had a major August top — volume is too low.
On Thursday afternoon, we had a large C wave drop that was telegraphed well ahead of time (thanks to EW) and triggered by a Trump tweet. That was a lucrative drop.
On Friday, I'd predicted we'd drop to 2915 in ES after a corrective wave up, as two measurements pointed to that target and sure enough, we turned about a point below that number, traced out a bullish triangle and we appear to now be on our way up (it's always possible we could re-test Friday's low).
The US Dollar Index is indicating the final wave will likely take about a month to play out, so I'd expect this final wave up in ES to either trace out a triangle or a diagonal (both patterns tend to move sideways and can last weeks).
The larger pattern on the daily charts, as I've been saying for a few weeks now, appears to be a flat, which is making itself apparent in the DOW, SP500, NYSE, the Russell 3000, and very possibly, the Russell 2000.
The coming drop will be a world-wide phenomenon across all most all sectors. It will last the balance of the summer months and most likely culminate in a low and final round of QE.
As I've said since the low on Dec. 26, the waves up are corrective in the NYSE-related indices, and as a result, will completely retrace. Expect an imminent top and a major move to a new low under 2100.
Summary: On the daily charts, the direction is down, on the hourly charts, it's still up. I expect sideways for the month of August.
A top in the US equities has been delayed by a pattern failure and produced a B wave in futures and the SP500. The larger degree pattern appears to be a flat (3-3-5 wave structures), which predicts a five wave dramatic drop to a new low below the A wave bottom at about 2300. The larger pattern in ES is a record-breaking broadening top (not an EW pattern).
I expect the ultimate bottom will be somewhere under 2100.
Once we've completed the fourth wave down, we'll have a long climb to a final slight new high in a fifth wave of this 500 year cycle top.
___________________________
Trader's Gold Subscribers get a comprehensive view of the market, including hourly (and even smaller timeframes, when appropriate) on a daily basis. They also receive updates through the comments area. I provide only the daily timeframe for the free blog, as a "snapshot" of where the market currently trades and the next move on a weekly basis.
I do a nightly video on the US indices, USD Index (and related currency pairs), gold, silver, and oil).
______________________________________
Sign up for: The Chart Show
Next Date: Wednesday, August 14 at 5:00 pm EST (US market time)

The Chart Show is a one hour webinar in which Peter Temple provides the Elliott Wave analysis in real time for the US market, gold, silver, oil, major USD currency pairs, and more. You won't find a more accurate or comprehensive market prediction anywhere for this price.
Get caught up on the market from an Elliott Wave perspective. There’ll be a Q&A session during and at the end of the webinar and the possibility (depending on time) of taking requests.
For more information and to sign up, click here.
| "I think you are the only Elliot Wave technician on the planet who knows what he's doing.” |
| m.d. (professional trader) |
All registrants will receive the video playback of the webinar, so even if you miss it, you’ll be sent the full video replay within about an hour of its conclusion.


