
 Strange Market Behaviour
After a predictable week the week before, last week was the opposite: It was highly unpredictable!
This week in this free blog, I’m going to provide some insight into the kind of thinking I do at the hourly (and smaller) chart level for the Trader’s Gold subscription service. I seldom share this on the free blog.
Last weekend left us with a non-confirmation between cash and futures: The SP500 bottomed at 2822 while ES (e-mini futures) bottomed lower at slightly below 2780. That’s a 43+ point discrepancy and is unlikely to last. Related indices like this do not like to be out-of-sync and usually find a way to get back into sync.
I had expected that re-synchronization to happen this past week, but instead, all the US indices rallied, some of them tracing out different structures that were corrective, except for the DOW, which rose in five waves. However, in the afternoon of the Friday session, the DOW rallied to a new high, thereby making the wave structure corrective.
Until that happened, I’d been contemplating that we were in the third wave of an ending diagonal (which is supported by the fact that we’re currently likely in a fifth wave, since we’ve already traced out a fourth (or B) wave).
Ending diagonals require internal zigzag structures. However, the current rally in the DOW is now not a zigzag, so my prognosis has changed. Elliott Wave rest on a foundation of probability (decided the most probably outcome, based upon wave structure, combined with fibonacci relationships). The most probable outcome now is that we see a retest of the current low in ES, which would bring the SP500 and ES back into sync.
Once that happens, an ending diagonal is a probable outcome for the final pattern to the top. The waves down are corrective, so a new high is required.
As I said in this week’s Chart Show, this is the most dangerous market I’ve ever experienced; indices are being “pushed around” to extremes by the movement of the US dollar; fake-outs are the order of the day.
There are strange goings on right now. A high degree of CAUTION is warranted until be have a new confirmed pattern in place.
My market rule: The market does the most predictable thing in the most unpredictable manner.
The US Dollar Index
For the past several years, I’ve been writing about the importance of the US Dollar, as the reserve currency, to the international markets, which are all moving to a top at the same time.
The US Dollar Index is a basket of currencies, dominated by the US Dollar; it’s the one everyone watches.
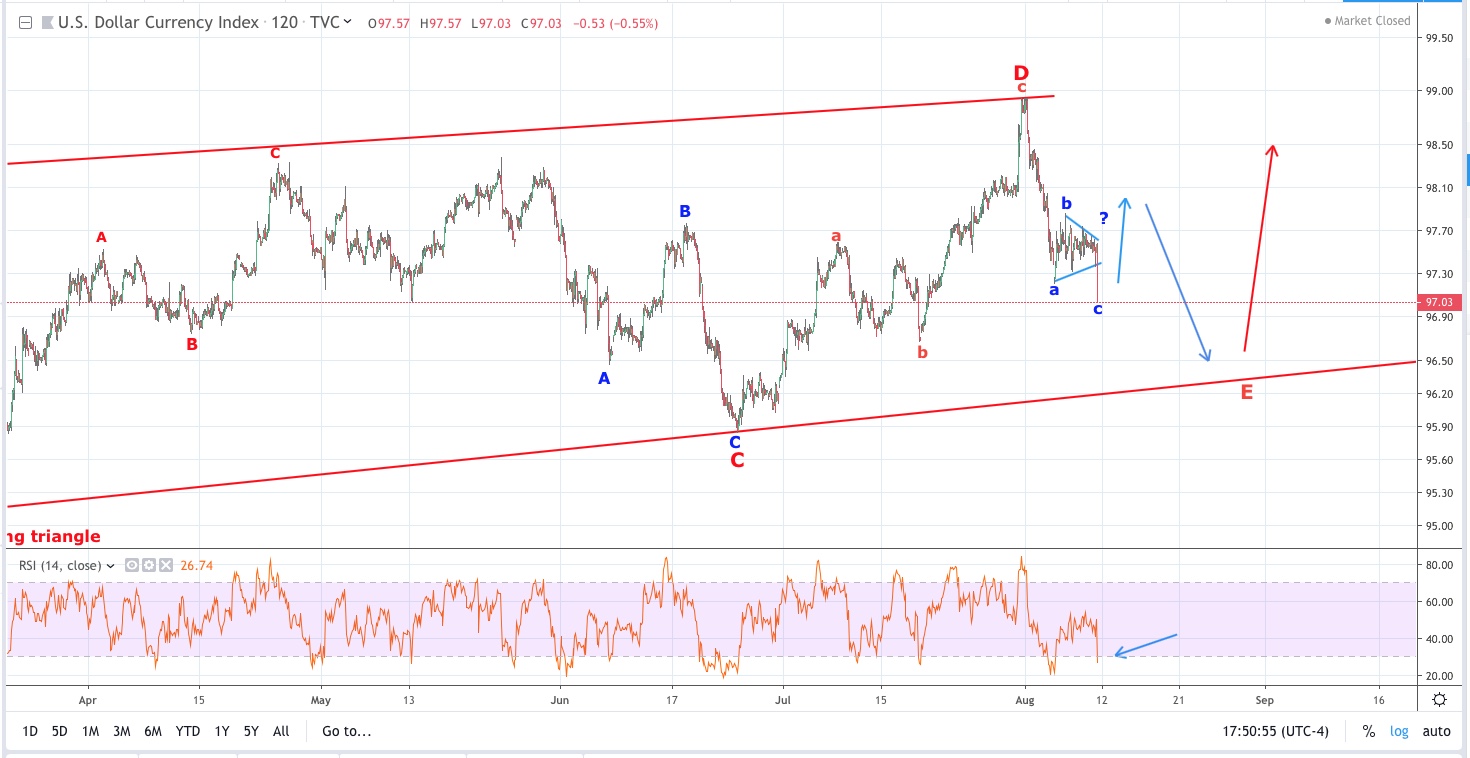
The US Dollar is in an uptrend and the most major asset classes have been moving more or less with its ups and downs. When the dollar moves down, the US indices move up, for example. Shorter term, the index is currently in a running triangle (a fourth wave) and within that triangle, it’s in the midst of its final move to the downside. Once it hits the lower trendline, the US indices should top.
The dollar this past week has become as unpredictable as the US indices. It went sideways for four days, and late on Friday afternoon, it dropped to a new low. This structure is quite strange because it has not traced out an upwards correction of any great magnitude; it would be difficult to classify the structure as an ABC corrective wave, which is required within a running triangle. Therefore, I’m expecting a larger rally to an area above the currently labelled ‘b’ wave.
If that happens, it’s very likely the US indices will drop, perhaps to test the current lows, as I’m suggesting elsewhere. While not anywhere near conclusive, the action of the US dollar is suggesting to me that a rally to the upside (that was expected this week) is still to come.
______________________________
Corrective Wave Structure
One of the key indices to watch is IWM (the Russell 2000), which needs a new high at 161.

Above is the 2 hour chart of IWM, the ETF for the Russel 2000.
The Russell 2000 is somewhat of a “bellwether” (the leading sheep of a flock) for us in terms of foreshadowing the top of the US indices (ie — SP500), in that it must reach a new high at 161 before it heads back down to a new low. That’s because the previous wave down from 161 is in three waves. Three wave patterns always eventually fully retrace.
The eventual test of the 161 area should coincide with the top in the US indices.
In terms of the shorter-term move, the waves up from the 146 area are also in three waves, so they would be expected to retrace, unless they are part of a larger pattern.
Supporting that prognosis is the fact that the wave down from 161, although technically in three waves, looks like a single A wave down (the look of a corrective wave is very important in determining whether it can stand alone or requires another wave to make it “look” more like it’s corrective). In this case, based upon experience, I’d be expecting another wave down from the 163 area to current 146 low so that is has “the right look” fora corrective wave.
However, if it drops to the previous low of 145.32, the count would change and I’d have to reassess the wave structure.
___________________________
Elliott Wave Basics
Here is a page dedicated to a relatively basic description of the Elliott Wave Principle. You’ll also find a link to the book by Bob Prechter and A. J. Frost.
______________________________
Get an upper hand … JC 2
Get an upper hand in trading …Seeing all the different currency pairs and the wave structures and hearing you explain why this has to do that on a nightly bases gives one a upper hand when trading. Elliott Wave applies to all stock and indices and can be applied to any candlestick chart. If someone ask what you want for Christmas – Tell them a membership to Peter’s “Traders Gold!”—JC |
Tops in your field DZ 2
Tops in your field …You are tops in your field. Tried to follow Elliot Wave international for years. They were always behind the market. After discovering you, I perceive that you are an expert in reading the waves, which puts you way ahead of the rest of your peers. And you can read the Waves like you are reading tomorrow’s financial section. I pray you stay healthy. —DZ |
Couldn’t be happier … KK 2
Couldn’t be happier …The analysis and insight you provide is simply amazing! I’ve been trading the futures and equity markets for well over thirty years and usually average around 5% monthly. Since joining your Traders Gold Service two months ago, that number has better than doubled. I couldn’t be happier.—KK |
the real deal SM 2
The real deal …‘Educational, insightful and thorough market analysis for all levels of traders. It’s Elliott Wave at its best….Peter Temple is the real deal’ —SM |
A true expert in Elliott Wave FL 2
A true expert in Elliott Wave …You are a true expert in EW analysis. What you provide is not available anywhere and is priceless. Subscription on your services is the best thing I have ever done. Many thanks for your effort to make me a better investor. I now have more trust in my investment decisions. I hope you will continue the excellent work! —FL |
Have not had a losing week RW 2
Have not had a losing week …I have been with Peter almost a year. The only thing that matters is have I made money with his service. I think I have finally turned the corner using Peter’s EW. I have not had a losing week in the last 5 months. Thanks Peter, for your amazing amount of hard work. —RW |
Rise above the rest … SM 2
Rise above the rest …I have only ever met a few people who, in their chosen fields (astrology, medicine, music, martial arts, technical analysis), rise above all the rest and you are one of them…you have ‘the gift’…and that’s why I’m a Trader’s Gold member. —SM |
The best of them JL 2
The best of them …Last couple of years, I subscribed to several ‘market traders’. You are by far the best of them and the personal contact is awesome. Daily and daily updates are very well written! Besides your expertise in EW, I also like your cycles analysis. Best investment I ever made! —JL |
US Market Snapshot (based on end-of-week wave structure)
This chart is posted to provide a prediction of future market direction. DO NOT trade based upon the information presented here (certainly NOT from a daily chart).
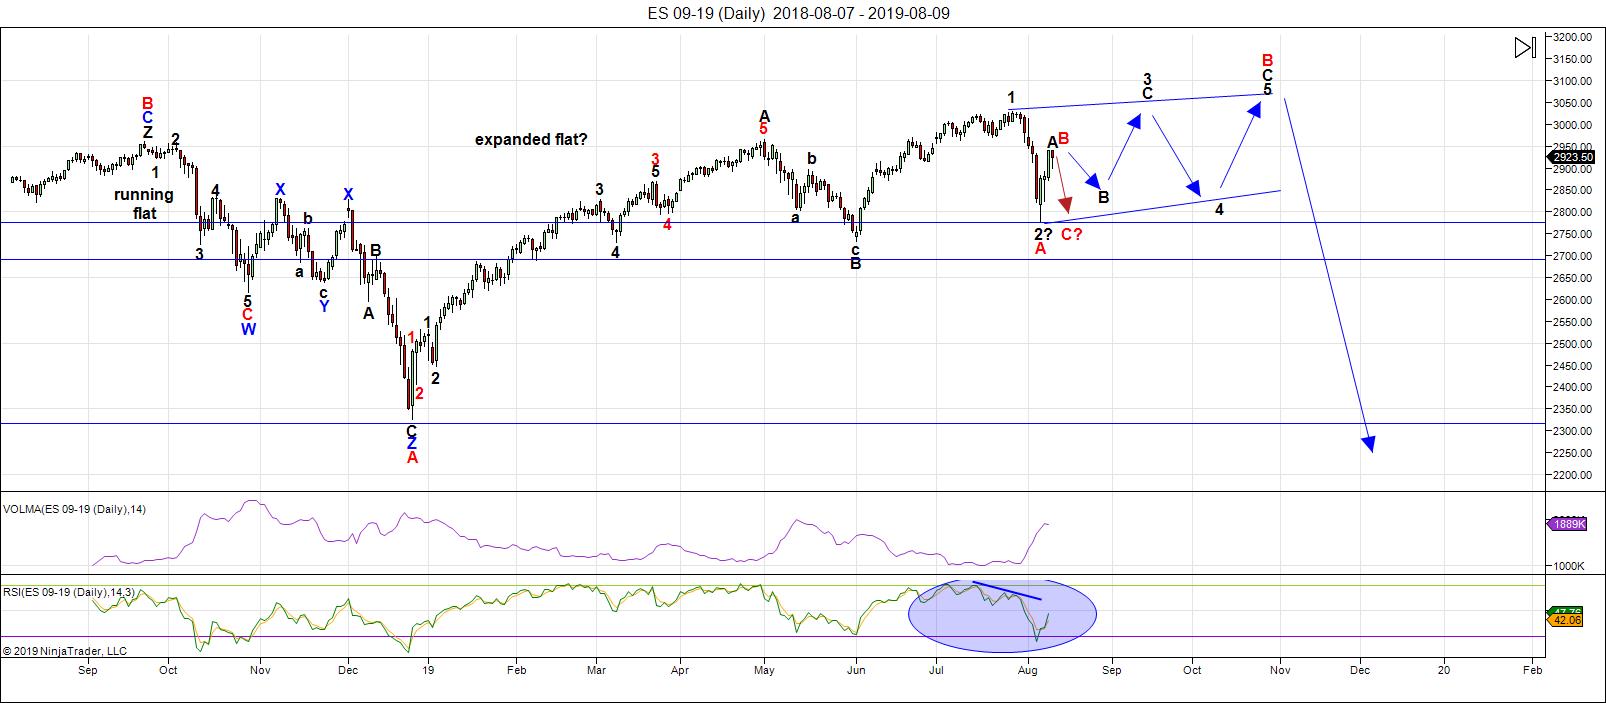
Above is the daily chart of ES (click to enlarge, as with any of my charts).
The danger in the market that I keep referring to is at a high this weekend. There are multiple options for the road ahead. We appear to be in between patterns and that's always a time for CAUTION.
Last weekend, I expected a drop to a new low in the SP500 to get cash and futures back in sync (their current bottoms are at different price levels). That did not happen, but that doesn't mean it still won't. The waves up from last weekend are corrective across all the US indices and futures. That wasn't the case until Friday afternoon, when the DOW's wave pattern also turned corrective.
Until that time, I'd been leaning towards an ending diagonal playing out (this is highly speculative at this point and depends upon what happens this week). The possibility for the ending diagonal arises because the most recent wave down from the all-time high (the red A wave on the chart) comes after we already have a fourth (or B wave) in place (bottomed at about 2730 in ES). That suggests we're in fifth wave territory.
That means that either:
- we're going to bottom at the previous low for ES and then turn up into a bullish pattern, or
- we're in an ending diagonal now and will likely have a large (black) B wave drop in the neighbourhood of 62% of the (black) A wave up from this past week.
I've discounted a contracting triangle as the final pattern, because a triangle would have to include the fourth wave (the black B wave on the chart) and the structure would be difficult to imagine working within the current wave configuration.
This week will be a pivotal week, one way or the other. By the end of the week, we may well have our path to the top defined for us.
As I said last week, I'm now looking towards September for a top. If it's earlier, that would be great, but I don't think that'll be the case. We've never had a major August top — volume is too low.
The larger pattern on the daily charts, as I've been saying for a few weeks now, appears to be a flat, which is making itself apparent in the DOW, SP500, NYSE, the Russell 3000, and very possibly, the Russell 2000.
Longer term, I'm expecting the C wave of a an expanded flat to the downside. In that case, a first wave should drop to the 2725-30 area (previous fourth of one lesser degree) and then bounce in a second wave to the 2875 area (62% retrace), before a third wave down to about 2250. After that, a fourth and fifth wave down to under 2100 will round out the drop.
There is an option of a set of zigzags down to the same level, but it's less probable because there are so many flats set up across multiple stocks and indices. If a zigzag is the pattern that traces out, the retraces up will not be as strong as they would be with the C wave of a flat. We'll get a lot of information about the probable path from the first wave down.
The coming drop will be a world-wide phenomenon across all most all sectors. It will last the balance of the summer months and most likely culminate in a low and final round of QE.
As I've said since the low on Dec. 26, the waves up are corrective in the NYSE-related indices, and as a result, will completely retrace. Expect an imminent top and a major move to a new low under 2100.
Summary: There are options this weekend, but I'm leaning towards a drop to the previous ES low at about 2780.
We have one more new high in store before I expect a devastating drop. The larger degree pattern appears to be a flat (3-3-5 wave structures), which predicts a five wave dramatic drop to a new low below the A wave bottom at about 2300. The larger pattern in ES is a record-breaking broadening top (not an EW pattern).
I expect the ultimate bottom will be somewhere under 2100.
Once we've completed the fourth wave down, we'll have a long climb to a final slight new high in a fifth wave of this 500 year cycle top.
___________________________
Trader's Gold Subscribers get a comprehensive view of the market, including hourly (and even smaller timeframes, when appropriate) on a daily basis. They also receive updates through the comments area. I provide only the daily timeframe for the free blog, as a "snapshot" of where the market currently trades and the next move on a weekly basis.
I do a nightly video on the US indices, USD Index (and related currency pairs), gold, silver, and oil).
______________________________________
Sign up for: The Chart Show
Next Date: Wednesday, August 21 at 5:00 pm EST (US market time)

The Chart Show is a one hour webinar in which Peter Temple provides the Elliott Wave analysis in real time for the US market, gold, silver, oil, major USD currency pairs, and more. You won't find a more accurate or comprehensive market prediction anywhere for this price.
Get caught up on the market from an Elliott Wave perspective. There’ll be a Q&A session during and at the end of the webinar and the possibility (depending on time) of taking requests.
For more information and to sign up, click here.
| "I think you are the only Elliot Wave technician on the planet who knows what he's doing.” |
| m.d. (professional trader) |
All registrants will receive the video playback of the webinar, so even if you miss it, you’ll be sent the full video replay within about an hour of its conclusion.


