
 A Period of Relative Calm?
It was a very tumultuous couple of weeks in the US indices, and a potentially lucrative one, if you follow Elliott Wave structure.
The wave up on Wednesday (on news) was destined for failure, which I identified, but which dropped farther than anticipated.
The Pundits’ Reaction
It was hilarious to see the reaction in the main stream media. On Tuesday, the DOW went up about 600 points very quickly on news. On Wednesday, it came down about 900 points and that’s what sparked the news (in actual fact, only a 300 point drop from a day earlier). By Friday of this week, we were back up to the same level we started at on Tuesday morning, so, in fact, there was no change to the week!
But this shows me the underlying fear out there, which which is consistent with the historical traits of the top of a 500 year cycle. Expect a much more negative outlook and heightening fear as we move into the Christmas season.
After the drama of the last two weeks, at the end of this week, we seem to have finally found a period of relative calm as we appear to be in the C wave of the third wave of an ending diagonal. This wave should end in a new all-time high
Ending Diagonals
In the “Elliott Wave Principle” book, ending diagonals are classified as motive waves, because they can form as the final pattern in an impulsive fifth wave (and occasionally at the top of a third wave). They also form at the ends of C waves in a large correction.
However, I differ in how I classify them. I consider them corrective patterns, because all the waves within the trendlines overlap, signalling that the market is just not strong enough to trace out an impulsive pattern at the top, and is signalling an imminent trend change.
In “The Elliott Wave Principle,” Prechter states that Elliott said that an ending diagonal occurs “when the preceding move has gone ‘too far too fast’,” which I guess amounts to the same thing (I have never been able to find this statement in Elliott’s works, so I don’t know where it originated), as it suggests waning momentum, or weakness.
It’s usually premature to identify an ending diagonal before the start of the fourth wave of that pattern. However, considering that we’re currently in fifth wave territory, and have a corrective wave up in the SP500 from approximately 2728 (on June 3), which would constitute the start of the fifth wave, an ending diagonal, by process of elimination, is the only pattern that currently makes sense.
This first wave of an ending diagonal must be a zigzag (a corrective wave) and that’s what we have up from June 3 (in cash and in futures).
The Timing
That being the case, the path is relatively clear for the next few weeks. The only thing missing is the timing, but with the current bond inversion and the fact that ten year treasuries (TNX) are currently at about 1.3%, the pressure is going to be on the Federal Reserve to lower rates (September 17 announcement) and we may see a rapid drop either on the news, or the day after. Keep in mind that the ending diagonal must be complete at the same time.
Usually, the market rises in anticipation of the announcement; I don’t expect this to change.
If you want a clearer picture and high probability trading information, sign up for the Chart Show this coming week. We’re waiting for a turn in the US Dollar and this should set up opportunities in currency pairs. I also cover oil, gold and silver, bonds, and the DAX. Sign up is below.
My market rule: The market does the most predictable thing in the most unpredictable manner.
___________________________
Elliott Wave Basics
Here is a page dedicated to a relatively basic description of the Elliott Wave Principle. You’ll also find a link to the book by Bob Prechter and A. J. Frost.
______________________________
Have not had a losing week RW 2
Have not had a losing week …I have been with Peter almost a year. The only thing that matters is have I made money with his service. I think I have finally turned the corner using Peter’s EW. I have not had a losing week in the last 5 months. Thanks Peter, for your amazing amount of hard work. —RW |
Rise above the rest … SM 2
Rise above the rest …I have only ever met a few people who, in their chosen fields (astrology, medicine, music, martial arts, technical analysis), rise above all the rest and you are one of them…you have ‘the gift’…and that’s why I’m a Trader’s Gold member. —SM |
Tops in your field DZ 2
Tops in your field …You are tops in your field. Tried to follow Elliot Wave international for years. They were always behind the market. After discovering you, I perceive that you are an expert in reading the waves, which puts you way ahead of the rest of your peers. And you can read the Waves like you are reading tomorrow’s financial section. I pray you stay healthy. —DZ |
Couldn’t be happier … KK 2
Couldn’t be happier …The analysis and insight you provide is simply amazing! I’ve been trading the futures and equity markets for well over thirty years and usually average around 5% monthly. Since joining your Traders Gold Service two months ago, that number has better than doubled. I couldn’t be happier.—KK |
A true expert in Elliott Wave FL 2
A true expert in Elliott Wave …You are a true expert in EW analysis. What you provide is not available anywhere and is priceless. Subscription on your services is the best thing I have ever done. Many thanks for your effort to make me a better investor. I now have more trust in my investment decisions. I hope you will continue the excellent work! —FL |
the real deal SM 2
The real deal …‘Educational, insightful and thorough market analysis for all levels of traders. It’s Elliott Wave at its best….Peter Temple is the real deal’ —SM |
The best of them JL 2
The best of them …Last couple of years, I subscribed to several ‘market traders’. You are by far the best of them and the personal contact is awesome. Daily and daily updates are very well written! Besides your expertise in EW, I also like your cycles analysis. Best investment I ever made! —JL |
Get an upper hand … JC 2
Get an upper hand in trading …Seeing all the different currency pairs and the wave structures and hearing you explain why this has to do that on a nightly bases gives one a upper hand when trading. Elliott Wave applies to all stock and indices and can be applied to any candlestick chart. If someone ask what you want for Christmas – Tell them a membership to Peter’s “Traders Gold!”—JC |
US Market Snapshot (based on end-of-week wave structure)
This chart is posted to provide a prediction of future market direction. DO NOT trade based upon the information presented here (certainly NOT from a daily chart).
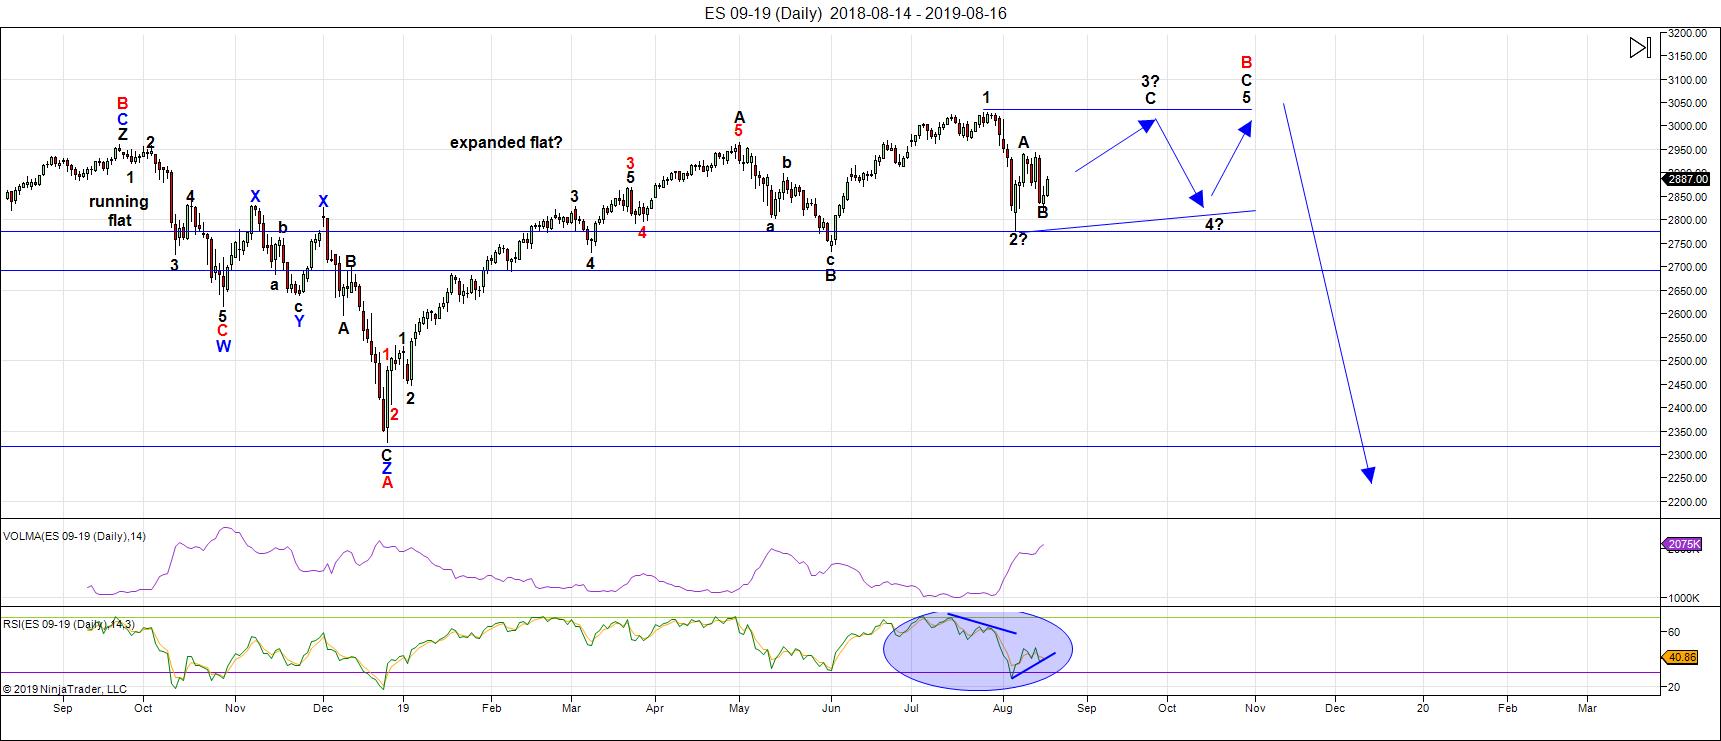
Above is the daily chart of ES (click to enlarge, as with any of my charts).
After a week of volatility and no clear market direction, the market appears to have settled down somewhat.
Last week, due to the process of elimination, I elevated an ending diagonal pattern to the most probable pattern going forward. So far, that appears to be what's tracing out.
What's really odd, though, about the SP500 is that futures and cash have both different price lows (a differential of almost 45 points) which is causing different wave structures to emerge within the ending diagonal. ES has one more wave than the SP500. It's making a short-term prediction very difficult.
If this is indeed an ending diagonal, we're currently in the C wave of the third wave. The direction is up with a target of a slight new high. After that, we'll plummet in a fourth wave to the lower trendline and finally, we'll rally to a final new high.
As I said two weeks ago, I'm now looking towards mid-September for a top. If it's earlier, that would be great, but I don't think that'll be the case. We've never had a major August top — volume is too low.
The larger pattern on the daily charts, as I've been saying for a few weeks now, appears to be a flat, which is making itself apparent in the DOW, SP500, NYSE, the Russell 3000, and very possibly, the Russell 2000.
Longer term, I'm expecting the C wave of a an expanded flat to the downside. In that case, a first wave should drop to the 2725-30 area (previous fourth of one lesser degree) and then bounce in a second wave to the 2875 area (62% retrace), before a third wave down to about 2250. After that, a fourth and fifth wave down to under 2100 will round out the drop.
There is an option of a set of zigzags down to the same level, but it's less probable because there are so many flats set up across multiple stocks and indices. If a zigzag is the pattern that traces out, the retraces up will not be as strong as they would be with the C wave of a flat. We'll get a lot of information about the probable path from the first wave down.
The coming drop will be a world-wide phenomenon across all most all sectors. It will last the balance of the summer months and most likely culminate in a low and final round of QE.
As I've said since the low on Dec. 26, the waves up are corrective in the NYSE-related indices, and as a result, will completely retrace. Expect an imminent top and a major move to a new low under 2100.
Summary: The most probably pattern tracing out at the top of this large corrective wave up from Jan. 26 is an ending diagonal. if so, after 5 mostly sideways waves, it will culminate in a minimal new high, setting up for a devastating drop.
The larger degree pattern appears to be a flat (3-3-5 wave structures), which predicts a five wave dramatic drop to a new low below the A wave bottom at about 2300. The larger pattern in ES is a record-breaking broadening top (not an EW pattern).
I expect the ultimate bottom will be somewhere under 2100.
Once we've completed the fourth wave down, we'll have a long climb to a final slight new high in a fifth wave of this 500 year cycle top.
___________________________
Trader's Gold Subscribers get a comprehensive view of the market, including hourly (and even smaller timeframes, when appropriate) on a daily basis. They also receive updates through the comments area. I provide only the daily timeframe for the free blog, as a "snapshot" of where the market currently trades and the next move on a weekly basis.
I do a nightly video on the US indices, USD Index (and related currency pairs), gold, silver, and oil).
______________________________________
Sign up for: The Chart Show
Next Date: Wednesday, August 28 at 5:00 pm EST (US market time)

The Chart Show is a one hour webinar in which Peter Temple provides the Elliott Wave analysis in real time for the US market, gold, silver, oil, major USD currency pairs, and more. You won't find a more accurate or comprehensive market prediction anywhere for this price.
Get caught up on the market from an Elliott Wave perspective. There’ll be a Q&A session during and at the end of the webinar and the possibility (depending on time) of taking requests.
For more information and to sign up, click here.
| "I think you are the only Elliot Wave technician on the planet who knows what he's doing.” |
| m.d. (professional trader) |
All registrants will receive the video playback of the webinar, so even if you miss it, you’ll be sent the full video replay within about an hour of its conclusion.


