
Powell, Trump, and Xi
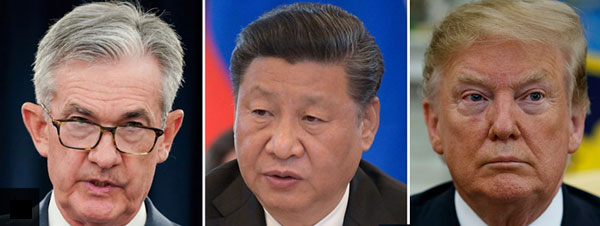 We have an interesting power triangle playing out, at times a kind of a schoolyard rumble, between President Xi of China and President Trump, each attempting to outdo the other in an escalating trade war. There’s no two ways about it: Trade wars are financially destructive.
Fed Chairman Jay Powell sits in the middle as Trump’s punching bag, with very little power to do anything to moderate the situation (contrary to what both Trump and the public think). Powell can lower interest rates, but the economy is already on the verge of collapse due to the unsustainable debt problem (partially caused by inflation), an issue that is not exclusive to the United States — it’s a worldwide phenomenon.
By creating inflation, governments debase the country’s currency, making the general population pourer, as salaries never keep up to rising prices. Those rising prices increase the GDP each year; the higher GDP is what governments use as collateral for international loans. So, in effect, the government steals from its people (lowering the value of our money and making us poor) in order to borrow against our future prosperity (after all, it all has to be paid back at some point in time). Pure evil, if you ask me.
This time, however, the debt levels are far beyond anything that could possibly be paid back — they’re the largest debt levels in history. Default is on the agenda, as has happened over and over again in history. We don’t read history, so we never learn.
This is a process that takes place every 172 years or so and always ends very badly; it’s a natural cycle.
Back to the present. Similar to 1929/30 (with Hoover and the start of the Great Depression), we’re mounting escalating trade wars, this time between China and the US. It brings to mind the analogy of Emperor Nero of the Roman Empire (64 A.D) fiddling as Rome burned to the ground. As the trade war escalates, it’s the economy that gets burned to the ground, and the populace suffers. This event took place at the top of the Roman Empire, as this trade war is blowing up at the top of the US empire. History rhymes.
Now, if you read the history, the fiddle wasn’t invented until much later (so the story isn’t accurate), but the idea of a mistrusted leader not in touch with the needs of his people is the underlying theme — and it recurs like clockwork. Nero was the last emperor of the Roman Republic and you’ll find more on him and his rule here.
His time in power marked the top of a five hundred year cycle, similar to the reign of Henry VIII in the 1500s. I often refer to Trump as the reincarnation of King Henry. Henry was the second Tudor king and his death began decades of civil war. Elizabeth I was the final Tudor monarch (died in 1603).
This time, we’re witnessing the decline of the American Empire, and I’m expecting a civil war to erupt in the next few years, not only in the US, but in other countries around the world.
Know the Past — See the Future.
So here we have President Trump at verbal and financial war with China, sending out emotionally inspired tweets that send the markets either dramatically up, or in the case of Friday, dramatically down. There’s nothing we can do about it, but suffer the consequences.
However, a sudden spike up or down only happens when the wave structure allows for it. For example, a market in the middle of a third wave rally will “shake off” a negative tweet (you won’t see much change). But, if a negative tweet happens at a time where a B wave is possible to the downside, it will exacerbate the situation, leading to a stronger and deeper bearish wave. The same can happen with positive news in the opposite direction.
The move down on Friday appears to have been the C wave of a larger, bearish B wave. The waves down are corrective, so the direction remains up. In fact, all the waves in all the US indices are corrective on the downside, so we must, one way or another, find our way to a new high. That’s the power of Elliott Wave — it’s simply a set of rules and guidelines for how the market moves. it’s highly accurate and i’ve never seen it fail.
It takes time working with it to get comfortable with the simple fact that three wave combinations retrace and five wave combinations partially retrace, but once you’ve seen it happen enough times, it gives you the knowledge to play the market with much more confidence and higher levels of profitability.
That said, the current environment of news and tweets seemingly coming at us at random makes this market extremely dangerous. It’s not a place to get aggressive. That place will be the top of the market, which I believe is going to magically appear in the middle of September when Chairman Powell gets “set up” by President Trump to cut interest rates and send the market into a deep nose dive.
You see, the markets don’t move on news; they move on the mood of the population. News just moves the market enough to make us crazy, but it doesn’t affect the trend. The trend will play out until the mood changes from positive to negative, and then the trend will change.
The schoolyard kids are going to keep bullying each other, paying little attention to what it does to all of us. It will eventually bring down the economy and we’ll head into civil war and revolution right across the world.
We’ll see what happens … (but I know what happens, because history tells us. This time is not any different).
___________________________
Elliott Wave Basics
Here is a page dedicated to a relatively basic description of the Elliott Wave Principle. You’ll also find a link to the book by Bob Prechter and A. J. Frost.
______________________________
Get an upper hand … JC 2
Get an upper hand in trading …Seeing all the different currency pairs and the wave structures and hearing you explain why this has to do that on a nightly bases gives one a upper hand when trading. Elliott Wave applies to all stock and indices and can be applied to any candlestick chart. If someone ask what you want for Christmas – Tell them a membership to Peter’s “Traders Gold!”—JC |
Rise above the rest … SM 2
Rise above the rest …I have only ever met a few people who, in their chosen fields (astrology, medicine, music, martial arts, technical analysis), rise above all the rest and you are one of them…you have ‘the gift’…and that’s why I’m a Trader’s Gold member. —SM |
Tops in your field DZ 2
Tops in your field …You are tops in your field. Tried to follow Elliot Wave international for years. They were always behind the market. After discovering you, I perceive that you are an expert in reading the waves, which puts you way ahead of the rest of your peers. And you can read the Waves like you are reading tomorrow’s financial section. I pray you stay healthy. —DZ |
Couldn’t be happier … KK 2
Couldn’t be happier …The analysis and insight you provide is simply amazing! I’ve been trading the futures and equity markets for well over thirty years and usually average around 5% monthly. Since joining your Traders Gold Service two months ago, that number has better than doubled. I couldn’t be happier.—KK |
The best of them JL 2
The best of them …Last couple of years, I subscribed to several ‘market traders’. You are by far the best of them and the personal contact is awesome. Daily and daily updates are very well written! Besides your expertise in EW, I also like your cycles analysis. Best investment I ever made! —JL |
A true expert in Elliott Wave FL 2
A true expert in Elliott Wave …You are a true expert in EW analysis. What you provide is not available anywhere and is priceless. Subscription on your services is the best thing I have ever done. Many thanks for your effort to make me a better investor. I now have more trust in my investment decisions. I hope you will continue the excellent work! —FL |
Have not had a losing week RW 2
Have not had a losing week …I have been with Peter almost a year. The only thing that matters is have I made money with his service. I think I have finally turned the corner using Peter’s EW. I have not had a losing week in the last 5 months. Thanks Peter, for your amazing amount of hard work. —RW |
the real deal SM 2
The real deal …‘Educational, insightful and thorough market analysis for all levels of traders. It’s Elliott Wave at its best….Peter Temple is the real deal’ —SM |
US Market Snapshot (based on end-of-week wave structure)
This chart is posted to provide a prediction of future market direction. DO NOT trade based upon the information presented here (certainly NOT from a daily chart).
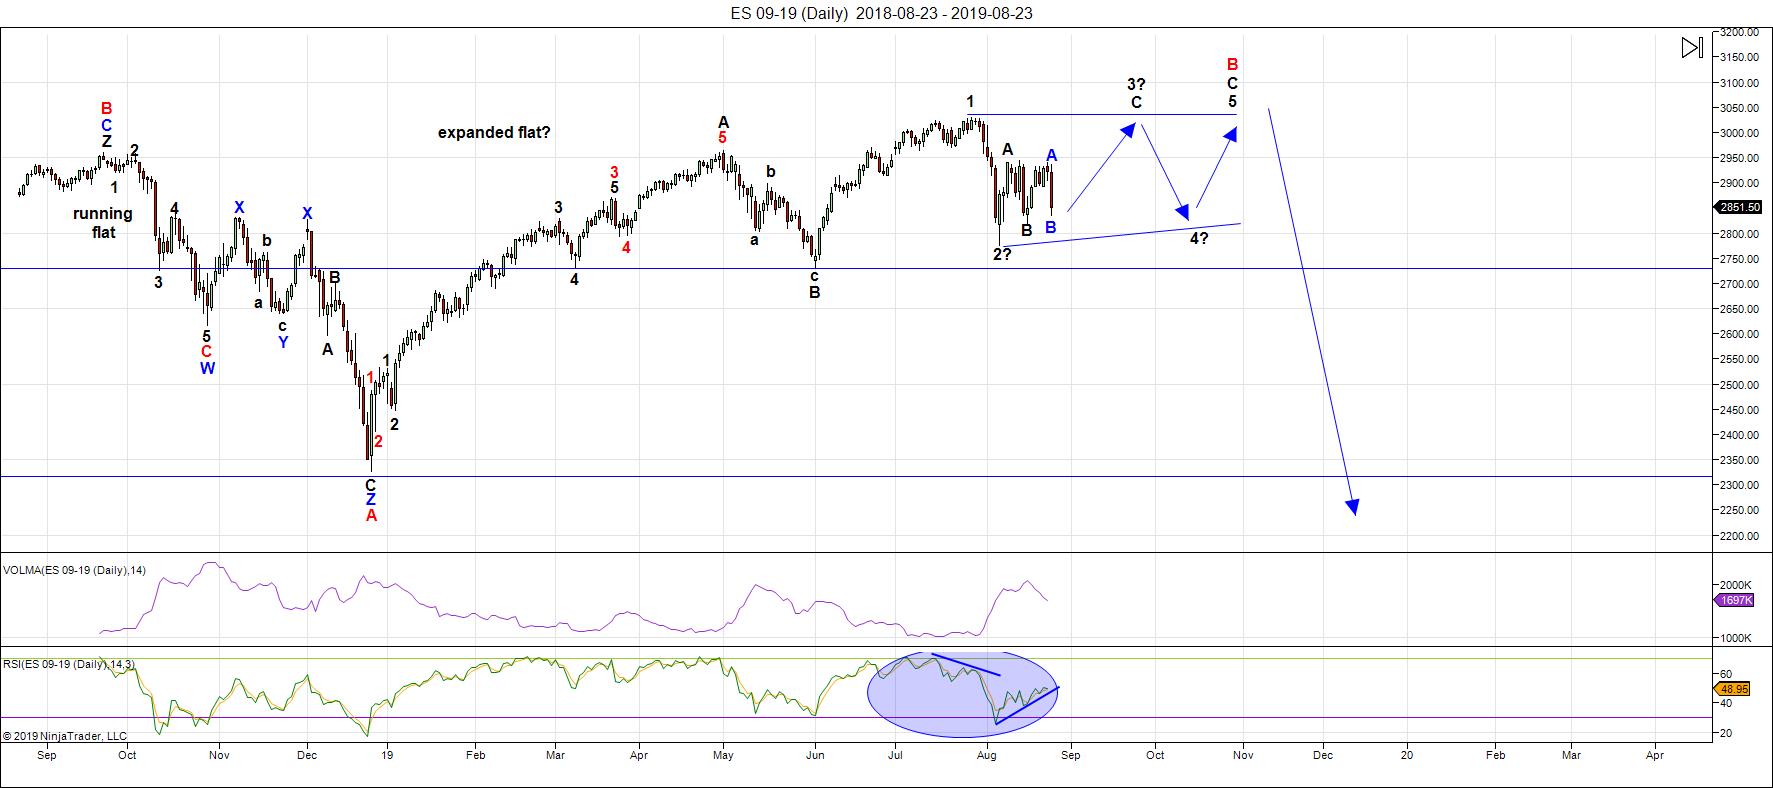
Above is the daily chart of ES (click to enlarge, as with any of my charts).
We had a week of relative calm (which is what I expected) and then Friday made up for it! I've never seen so much news and market reaction all in one day: First it was China, then Powell, and finally (not to be outdone), President Trump.
However, there was no technical damage that I can find anywhere in the bearish drop on Friday. So, there are no real changes to the daily chart from last week ... just another ugly leg down. But Friday was an "inside day," in that we didn't make new highs or new lows and the wave down is corrective. There are some short-term options on the hourly chart, but the overall direction, based on the wave structure, is still to the upside. RSI keeps climbing on the daily chart above.
As I've said the past couple of weeks, by process of elimination (Elliott Wave is all about probabilities based on wave patterns), I believe we're tracing out an ending diagonal in futures and cash across several US market indices. I'll follow this pattern until something breaks; so far, we haven't done anything "wrong."
If we break to a new low below ES 2778, then something else is happening.
There are no rules inside ending diagonals, except for the fact that we expect so see zigzags. We have one in the A wave of the third wave and half of one in the C wave ... we need the other half ... a five-waver up to a new high.
What's really odd, though, is that futures and cash (SP500) have both different price lows (a differential of almost 45 points) which is causing different wave structures to emerge within the ending diagonal. ES has one more wave than the SP500. It's making a short-term prediction more difficult than usual.
As I said a few weeks ago, I'm now looking towards mid-September for a top. If it's earlier, that would be great, but I don't think that'll be the case. We've never had a major August top — volume is too low.
The larger pattern on the daily charts, as I've been saying for a few weeks now, appears to be a flat, which is making itself apparent in the DOW, SP500, NYSE, the Russell 3000, and very possibly, the Russell 2000.
The coming drop will be a world-wide phenomenon across all most all sectors. It will last the balance of the summer months and most likely culminate in a low and final round of QE.
As I've said since the low on Dec. 26, the waves up are corrective in the NYSE-related indices, and as a result, will completely retrace. Expect an imminent top and a major move to a new low under 2100.
Summary: The most probably pattern tracing out at the top of this large corrective wave up from Jan. 26 is an ending diagonal. if so, after 5 mostly sideways waves, it will culminate in a minimal new high, setting up for a devastating drop.
The larger degree pattern appears to be a flat (3-3-5 wave structures), which predicts a five wave dramatic drop to a new low below the A wave bottom at about 2300. The larger pattern in ES is a record-breaking broadening top (not an EW pattern).
I expect the ultimate bottom will be somewhere under 2100.
Once we've completed the fourth wave down, we'll have a long climb to a final slight new high in a fifth wave of this 500 year cycle top.
___________________________
Trader's Gold Subscribers get a comprehensive view of the market, including hourly (and even smaller timeframes, when appropriate) on a daily basis. They also receive updates through the comments area. I provide only the daily timeframe for the free blog, as a "snapshot" of where the market currently trades and the next move on a weekly basis.
I do a nightly video on the US indices, USD Index (and related currency pairs), gold, silver, and oil).
______________________________________
Sign up for: The Chart Show
Next Date: Wednesday, September 3 at 5:00 pm EST (US market time)

The Chart Show is a one hour webinar in which Peter Temple provides the Elliott Wave analysis in real time for the US market, gold, silver, oil, major USD currency pairs, and more. You won't find a more accurate or comprehensive market prediction anywhere for this price.
Get caught up on the market from an Elliott Wave perspective. There’ll be a Q&A session during and at the end of the webinar and the possibility (depending on time) of taking requests.
For more information and to sign up, click here.
| "I think you are the only Elliot Wave technician on the planet who knows what he's doing.” |
| m.d. (professional trader) |
All registrants will receive the video playback of the webinar, so even if you miss it, you’ll be sent the full video replay within about an hour of its conclusion.


