
 The Long and Winding Road
As I thought about the topping process and how all the asset classes i cover are gradually (painfully at times) meandering their way to a common top (common from a timing perspective), it led me to reflect on the bigger picture.
Below is a post that addresses the fact that topping is a process, but for major tops, there’s a certain synchronicity that happens; everything will find their respective Elliott Wave tops at the same time.
But, more than that, the entire Universe will come to the party. Bear with me as I explain.
The song title, “The Long and Winding Road” reflects on the path that these various asset classes are taking. Eventually, they’ll all end up at a logical turning point for each of them, but they often take the “scenic route” to get there.
That song was also the final number one hit for the Beatles (my favourite group) as they broke up in 1970, which also coincided with the top of the EW third wave, and a number of other remarkable historical events (see the DOW chart below). More importantly is the fact that it was also the top of a solar maximum (every 11.2 years), which is a phenomenon that always leads humans to create extraordinary events. For example, Woodstock happened in August of 1969 (an event I attended), and as we celebrate the fifty year anniversary, I’m feeling my age …
Every 100 year cycle has a golden age and the 1960s were that golden age for this most recent cycle. There was also a golden age in the early 1800s, with Beethoven and all his peers. They “rocked the music world” a little differently, and it came to an end with the 1835 depression, the largest depression in the United States at the time (but it was a worldwide event). Patterns and cycles repeat; they repeat based upon the influence of the planets.
1935 marked the top of a 172 year cycle as did 2007 (both years were fourteen years after the conjunction of Uranus and Neptune, with has culminated in a depression each conjunction throughout recorded history). Both conjunctions coincided with markedly colder weather here on Earth.
So … back to the top of the third wave in 1969/70. Right after the top, we went into an EW fourth wave and a recession. It also got demonstrably colder, a period (the 1970s) that brought with the emotional reaction of many who predicted a mini ice-age. Stories of the predicted climate downturn were all over the newspapers of the day.
This is going to be a brutally cold winder coming up and will also mark the top of the third wave of the US market. We’re going to see a really big drop in the SP500 to below 2100, and these drops always accompany a change in climate, interestingly enough. For example, 2007-8 was a very cold two year period.
The idea that we’re all part of one very large, (sometimes) happy family called “The Universe” is foreign to many, but over the coming years, I think it’s an idea that’s going to be accepted more and more. It gets more and more difficult to ignore as every year progresses.
That’s the work I do and I find it fascinating. I have much more to come on this subject over the coming years.

Above is the quarterly chart of the DOW from before the big drop in 1929 to today’s date. The top of the third wave of the current Elliott Wave cycle was arguable in 1969/70. It was also an 11.2 year solar maximum. Alexander Chizhevsky, who spent move of this life explaining their significance, identified a phenomenon that happens at solar maxiums, which he called “the excitability factor.” You’ll find more information on this effect in an older video post of mine here.
2001 was also a solar maximum and it’s responsible for the destruction of the World Trade Center (September 11, 2001) in the United States. You can think of these Sun-powered events as “Full Moons on steroids!” We’re affected by electromagnetic waves from our solar system, whether we want to admit to it, or not.
Know the Past. See the Future.
____________________________
 Tops Are Tough to Trade
For over three years now, I’ve talked about the “All the Same Market” phenomenon, where all the major asset classes are moving more or less in tandem towards a common top. That’s the big picture. They will continue to more or less move in parallet until we get to a final fifth wave top (the top of the 500 year cycle) in about a year or so … somewhere around the end of the year 2020.
Tops themselves (on a smaller scale), however, are different “animals.” The picture above shows how precarious a top can be. One false move can have a devastating affect. At tops there are opposing forces that are evenly matched playing opposite sides of the market, and the result can be quite unpredictable on smaller scale.
You’re seeing this play out right now in the movement of the US Dollar Index (and related currency pairs) as opposed to the movement of the US indices. This past week, we’ve witnessed DXY (the US Dollar Index) moving up while the ES (SP500 futures) has been moving up. What’s happening here?
What’s happening is that the US Dollar index is in a triangle and the US indices are also in a triangle, so the range is quite small relative to what we’ve had to deal with over the past year. The triangle in ES is actually an ending diagonal, which is like a triangle, but the point is that it’s moving primarily horizontally over a range of a little more than 200 points.
The US Dollar Index has been in a triangle for months. It’s in a running triangle, which moves mostly sideways to slightly up. What we’re seeing is oscillating wave patterns in a relatively small range. It means we’re probably in for volatility right up until we reach a top, which I think will be sometime this month.
Ending diagonals can be quite volatile (as we’ve seen) and more so when they get into the fourth and fifth wave. This volatility may also affect oil, gold, and silver.
So … my warning: This is likely to be a volatile, somewhat unpredictable market as we move towards are final top. That means DANGEROUS!. Be careful. The big move is going to come after the top. You want to be in a position to take advantage of it.
___________________________
Elliott Wave Basics
Here is a page dedicated to a relatively basic description of the Elliott Wave Principle. You’ll also find a link to the book by Bob Prechter and A. J. Frost.
______________________________
Rise above the rest … SM 2
Rise above the rest …I have only ever met a few people who, in their chosen fields (astrology, medicine, music, martial arts, technical analysis), rise above all the rest and you are one of them…you have ‘the gift’…and that’s why I’m a Trader’s Gold member. —SM |
Get an upper hand … JC 2
Get an upper hand in trading …Seeing all the different currency pairs and the wave structures and hearing you explain why this has to do that on a nightly bases gives one a upper hand when trading. Elliott Wave applies to all stock and indices and can be applied to any candlestick chart. If someone ask what you want for Christmas – Tell them a membership to Peter’s “Traders Gold!”—JC |
Have not had a losing week RW 2
Have not had a losing week …I have been with Peter almost a year. The only thing that matters is have I made money with his service. I think I have finally turned the corner using Peter’s EW. I have not had a losing week in the last 5 months. Thanks Peter, for your amazing amount of hard work. —RW |
A true expert in Elliott Wave FL 2
A true expert in Elliott Wave …You are a true expert in EW analysis. What you provide is not available anywhere and is priceless. Subscription on your services is the best thing I have ever done. Many thanks for your effort to make me a better investor. I now have more trust in my investment decisions. I hope you will continue the excellent work! —FL |
the real deal SM 2
The real deal …‘Educational, insightful and thorough market analysis for all levels of traders. It’s Elliott Wave at its best….Peter Temple is the real deal’ —SM |
Couldn’t be happier … KK 2
Couldn’t be happier …The analysis and insight you provide is simply amazing! I’ve been trading the futures and equity markets for well over thirty years and usually average around 5% monthly. Since joining your Traders Gold Service two months ago, that number has better than doubled. I couldn’t be happier.—KK |
Tops in your field DZ 2
Tops in your field …You are tops in your field. Tried to follow Elliot Wave international for years. They were always behind the market. After discovering you, I perceive that you are an expert in reading the waves, which puts you way ahead of the rest of your peers. And you can read the Waves like you are reading tomorrow’s financial section. I pray you stay healthy. —DZ |
The best of them JL 2
The best of them …Last couple of years, I subscribed to several ‘market traders’. You are by far the best of them and the personal contact is awesome. Daily and daily updates are very well written! Besides your expertise in EW, I also like your cycles analysis. Best investment I ever made! —JL |
US Market Snapshot (based on end-of-week wave structure)
This chart is posted to provide a prediction of future market direction. DO NOT trade based upon the information presented here (certainly NOT from a daily chart).
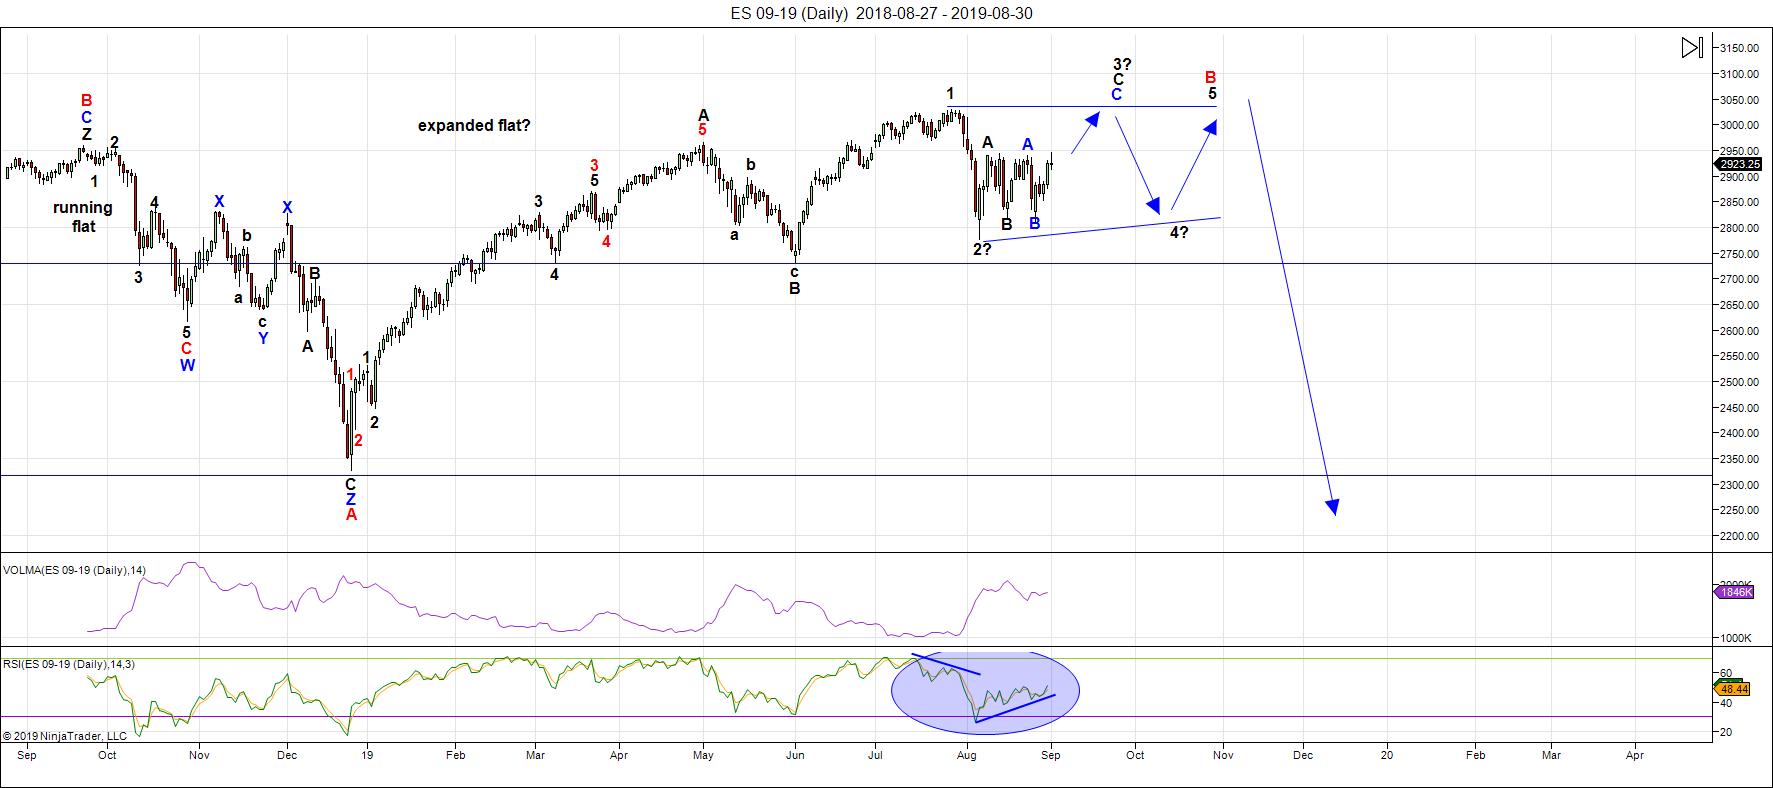
Above is the daily chart of ES (click to enlarge, as with any of my charts).
We've had a calm. bullish week this week, as expected. Even with the volatility of the week before, the ending diagonal remained intact across all the US indices, except IWM (the Russell 2000).
Note that the technicals are still quite supportive (RSI) of a further rally. That being the case, I'm sticking with the ending diagonal pattern for the reasons I outlined last week. Nothing has broken, although the wave structure is quite complex, even for an ending diagonal. I'll follow this pattern until something breaks; so far, the market hasn't done anything "wrong."
If we break to a new low below ES 2778, then something else is happening.
There are no rules inside ending diagonals, except for the fact that we expect so see zigzags. I place us at above the halfway point, with a target of an all-time new high for a third wave. We appear to be tracing out a zigzag, but where we are exactly within the subwaves is not clear.
As I said a few weeks ago, I'm now looking towards mid-September for a top. If it's earlier, that would be great, but I don't think that'll be the case. The next Fed announcement is on the 17th.
The larger pattern on the daily charts, as I've been saying for a few weeks now, appears to be a flat, which is making itself apparent in the DOW, SP500, NYSE, the Russell 3000, and very possibly, the Russell 2000.
Longer term in ES, I'm expecting the C wave of a an expanded flat to the downside. In that case, a first wave should drop to the 2725-30 area (previous fourth of one lesser degree) and then bounce in a second wave to the 2875 area (62% retrace), before a third wave down to about 2250. After that, a fourth and fifth wave down to under 2100 will round out the drop.
There is an option of a set of zigzags down to the same level, but it's less probable because there are so many flats set up across multiple stocks and indices. If a zigzag is the pattern that traces out, the retraces up will not be as strong as they would be with the C wave of a flat. We'll get a lot of information about the probable path from the first wave down.
The coming drop will be a world-wide phenomenon across all most all sectors. It will last the balance of the summer months and most likely culminate in a low and final round of QE.
As I've said since the low on Dec. 26, the waves up are corrective in the NYSE-related indices, and as a result, will completely retrace. Expect an imminent top and a major move to a new low under 2100.
Summary: The most probably pattern tracing out at the top of this large corrective wave up from Jan. 26 is an ending diagonal. if so, after 5 mostly sideways waves, it will culminate in a minimal new high, setting up for a devastating drop.
The larger degree pattern appears to be a flat (3-3-5 wave structures), which predicts a five wave dramatic drop to a new low below the A wave bottom at about 2300. The larger pattern in ES is a record-breaking broadening top (not an EW pattern).
I expect the ultimate bottom will be somewhere under 2100.
Once we've completed the fourth wave down, we'll have a long climb to a final slight new high in a fifth wave of this 500 year cycle top.
___________________________
Trader's Gold Subscribers get a comprehensive view of the market, including hourly (and even smaller timeframes, when appropriate) on a daily basis. They also receive updates through the comments area. I provide only the daily timeframe for the free blog, as a "snapshot" of where the market currently trades and the next move on a weekly basis.
I do a nightly video on the US indices, USD Index (and related currency pairs), gold, silver, and oil).
______________________________________
Sign up for: The Chart Show
Next Date: Wednesday, September 11 at 5:00 pm EST (US market time)

The Chart Show is a one hour webinar in which Peter Temple provides the Elliott Wave analysis in real time for the US market, gold, silver, oil, major USD currency pairs, and more. You won't find a more accurate or comprehensive market prediction anywhere for this price.
Get caught up on the market from an Elliott Wave perspective. There’ll be a Q&A session during and at the end of the webinar and the possibility (depending on time) of taking requests.
For more information and to sign up, click here.
| "I think you are the only Elliot Wave technician on the planet who knows what he's doing.” |
| m.d. (professional trader) |
All registrants will receive the video playback of the webinar, so even if you miss it, you’ll be sent the full video replay within about an hour of its conclusion.


