
The Elliott Wave Principle Book (a peer review)
 “Elliott Wave” is a science. The more I work with it, the more I am convinced — and my concentration over the past few years has been in refining the core principles, based upon Elliott’s original work. Understanding of scientific principles evolves over time, as does our understanding of the influence of the Universe on virtually everything we do on Earth. The Elliott Wave Principle is but one example of this. This is a reprint of my earlier work in this area, with some minor refinements.
In the process of building on the work of Ralph Nelson Elliott (and the interpretation of his work provided by Robert Prechter and A.J. Frost), my research has uncovered several errors and omissions in “The Elliott Wave Principle” (EWP) book. I would assume that any good EW analyst has done much of the same critical analysis. Or do they believe everything they read?
I often hear the criticism that Elliott Waves are not predictive. However, my experience over ten years proves the exact opposite: It is highly predictive when used properly, which requires adhering to the refinements I’ve made. The difference is in the analyst. After all, there are good lawyers and bad; it’s the same in any profession.
I’ve decided to provide my findings as a lead-in to a book (and possibly an online course) I’m developing. This summary is an example of the erroneous information that’s out there on the internet. My work suggests that the basic tools many EW analysts use are flawed. This is the reason for much of the EW misinformation out there on the internet, along with EW wave counts that are simply incorrect.
I came to Elliott Wave Theory through Robert Prechter and his Elliott Wave International website. After over a year as a subscriber, I became so dismayed with the continual errors of his analysts, that I decided to take a few years, devote myself to the market and the EW principle, with a goal of eventually excelling in its use. During well over 20,000 hours of analysis, I’ve discovered so much more in the process than has been written by either Prechter or Elliott (and a few major errors in the Prechter/Frost publication).
But I’m only expanding on their original work; I’m not doing anything extraordinarily ground-breaking. My belief it that the work I’ve done solidifies the principle and maybe, just maybe, it will help others in their analysis, as well help raise the understanding of this extraordinary method of predicting the market.
I’m convinced that Elliott’s description of the movement of the market should be considered a science. The reason that EW analysts differ in their wave counts is because of the errors in the Elliott Wave Principle book, many of them due to the additions, or changes to Elliott’s original work, done without enough in-depth research.
Following are key errors in the original work (all the charts expand when you click on them):
Ending Diagonals
There are two examples of ending diagonals in the book, one totally invalid.
The first example (p.39, fig 1-18) isn’t an ending diagonal, and it’s glaringly obvious as to why. One of the key requirements of ending diagonals is that the fourth wave must intersect the area of the first wave; they must overlap.
In the above example, they don’t. End of story. I would label this pattern as a simple wedge.
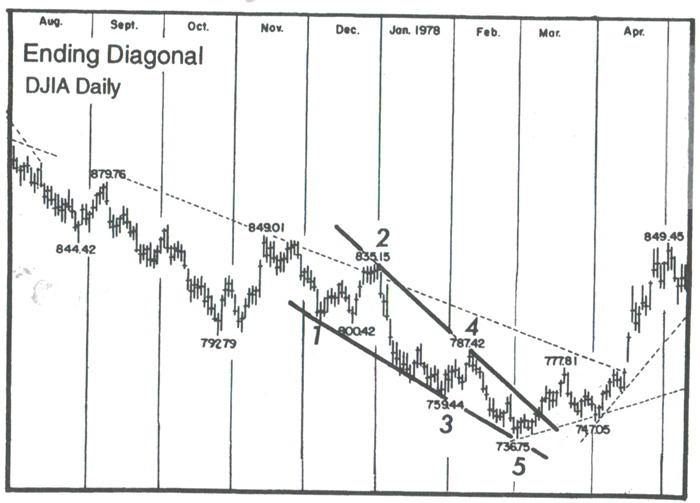
The second example (p. 38, fig. 1-17) is a valid example of an ending diagonal. However, one of the defining tests is that it must be in a fifth wave, in this case, above the fourth wave. However, the trendlines drawn suggest that the fourth wave is part of the ending diagonal. It cannot be, based upon the very definition of an ending diagonal.
A fourth wave triangle has the fourth wave as part of the triangle (it forms the A wave, in fact)—an ending diagonal does not.
An ending diagonal starts with the first wave of the diagonal (which is the fourth wave bottom); however, the fourth wave isn’t actually considered part of the ending diagonal. As a result, In this example, the lower trendline should begin on wave ii and finish at wave iv.
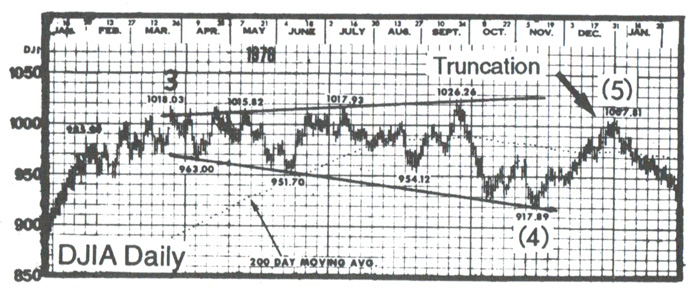
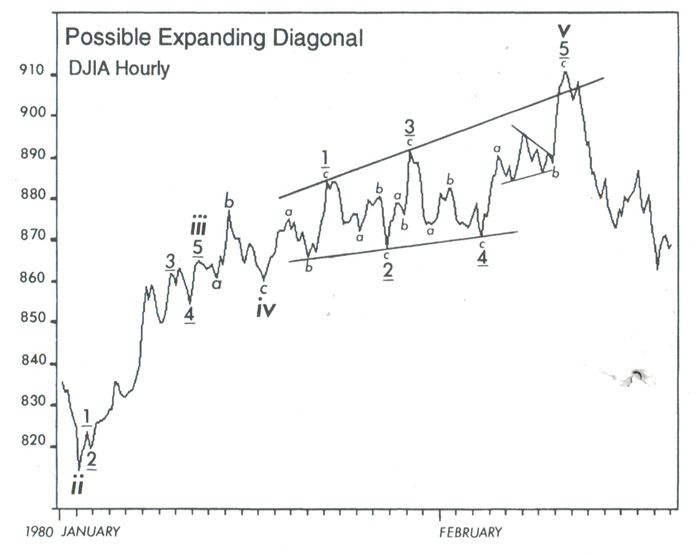 An ending expanding diagonal is a Robert Prechter addition (added to Elliott’s work). However, to my knowledge, nobody has ever seen one. I’ve identified these probable patterns in their early and intermediate stages, but they always seem to “break” before they fully form. So, I’m skeptical they exist. All we have is a line drawing in the book and it’s shown to the left (p. 39, fig. 39)
When I went to the original source, which is a DJIA hourly chart from early 1980, I found that the position of this pattern within the larger structure didn’t support the pattern guidelines at all.
It’s at the top of a B wave in a continuing corrective pattern. Ending diagonals are supposed to be at the end of corrective C waves, or impulsive fifth wave of a trend. This one is not.
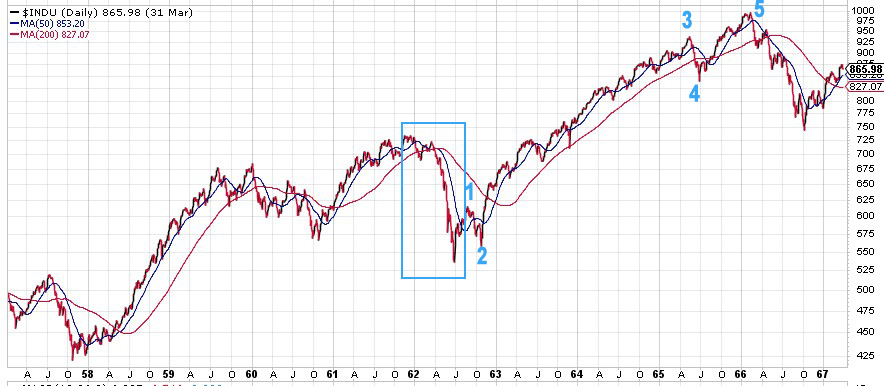
Below is a chart pulled from the DJIA showing the above example in its original habitat.
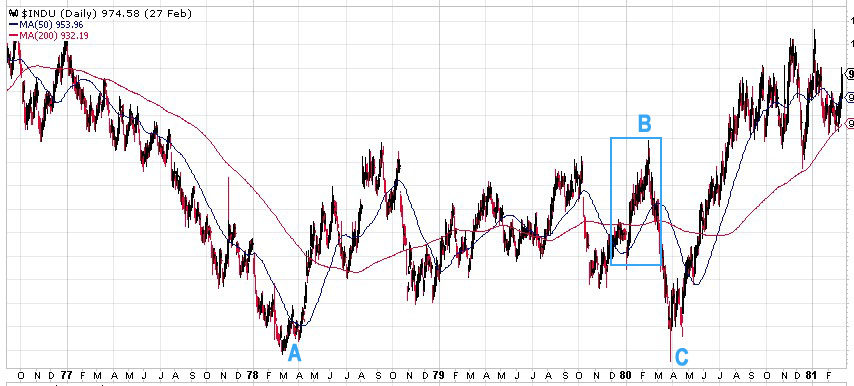
Above is a daily chart of DJIA showing the position of the supposed ending expanding diagonal. It’s at the top of a B wave in a large bearish correction. It’s part of a bottoming pattern, non distinctive.
My work has shown that ending diagonals can appear at the tops of impulsive third waves, and very rarely at the tops of corrective B waves (I have examples of each). I believe they should be reclassified as corrective patterns, because the subwaves are corrective, and in impulsive situations, they appear to be final patterns of what would otherwise be a fifth wave, but the market lacks the required impulsive strength, resulting in an overlapping pattern, forecasting an imminent trend change.
_______________________
Leading diagonals
Here’s another “ghost of charts past.” There has not been a valid chart presented to support this pattern anywhere that I can find. It was a Prechter/Frost addition to Elliott’s work.
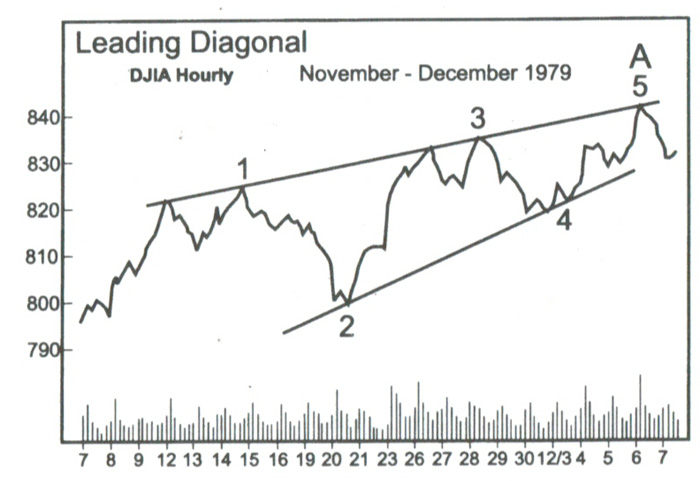
The only example we have is in the book and it comes from the DJIA hourly chart in 1979 (p. 40, fig. 40)
Let’s look at where this leading diagonal originally existed, by taking a look at the original chart, but over a longer period of time.
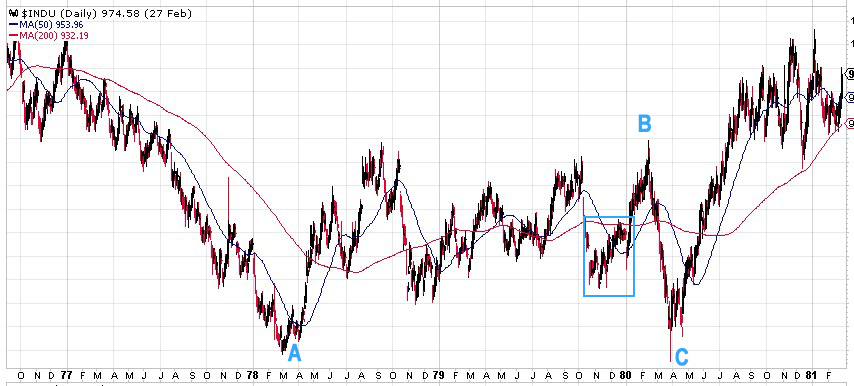
Above is a daily chart of DJIA. It’s actually the same chart from the ending expanding diagonal idea described above. So, what we have is an example of a leading diagonal and an ending expanding diagonal in the same corrective B wave. That’s quite a wave, just chocked full of diagonals! And it’s a B wave, a place where diagonals are very unlikely to appear.
Even if this was a repeatable pattern, providing an example in a corrective B wave is hardly a defining example of one, and would have little relevance in the wave count. It certainly doesn’t here. It’s at most an odd pattern that’s not particularly interesting, and is of little practical value.
Outside of this questionable example, nobody else has ever seen one.
__________________________
Truncations
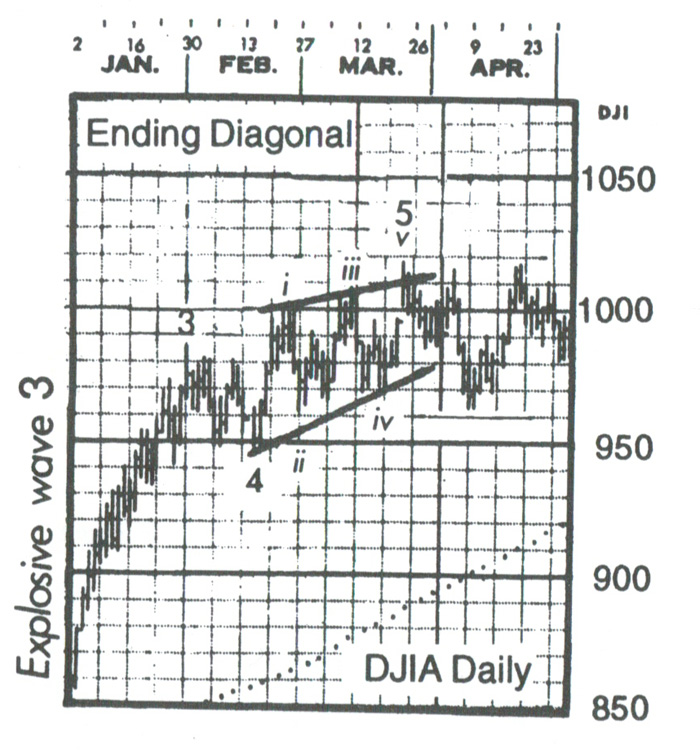
They do not exist. The example charts in the book on this subject are invalid. The example on the left is a three-wave, fourth wave of a sequence, mislabelled in the chart to the left (p. 36, fig. 1-13).
It looks good here, but if you look at the bigger picture, it makes no sense. The chart below tells the real story.
It’s really an odd example, because it’s an ABC structure, which is a corrective wave. The C wave down already has a small fifth wave within it, and the overall look is consistent with a normal C wave.
Above is a daily chart of the DJIA showing the “truncation” example above in its natural habitat—in a bullish third wave sequence, surrounded by impulsive waves, it’s simply a corrective pattern, not a truncation of anything. As such, it’s supposed to be in three waves!
Truncation Example #2
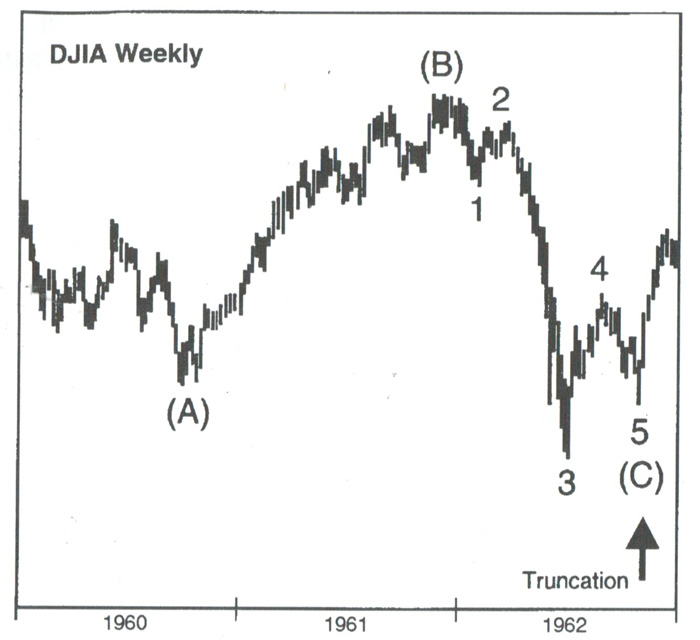
Above is the second example of a truncation from the book (p.36, fig 1-14).
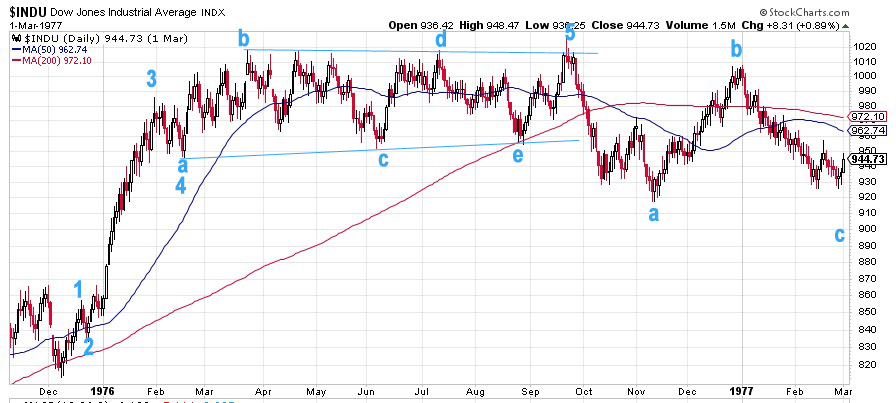
Here’s the same chart labelled properly – another daily chart of DJIA. This wave up from December, 1975 is an impulsive wave with a simple contracting triangle as a fourth wave (abcde), with a small 5th wave up to a final high. Elliott Wave patterns are extremely precise, and the original labelling of this pattern was not. If you’re an analyst, a general rule (as Mr. Prechter states in the book) is that all other options should be exhausted. In this case, he apparently didn’t heed his own advice.
Bob Prechter, in his writings, has expressed a desire that EW Theory be classified as a science. However, his adoption of this truncation “anomaly” certainly doesn’t support this desire. You can’t have a valid scientific theory that fails periodically. After going back a hundred years in the DOW, I can’t find a single occurrence of a truncation either at market highs or lows.
As far as I’m concerned, truncations don’t exist; nobody has ever seen one.
_______________________
Inadequacies in the book
Here are some areas in which the information in the book is not complete:
Second Waves. Second waves in an impulsive pattern must retrace 62%, based upon my experience. I’ve cited this several times over the past three years and it has yet to fail. A few times over the past three years, we’ve been waiting often several days for one of the NYSE indices to achieve this retrace level in order for the wave pattern of all of them, as a group, to progress.
This 62% retrace requirement in impulsive waves is often the difference as to whether analysts are correct in their calls. In Prechter’s book, the requirement is that they only have to retrace 38%, which has caused analysts to be wrong over and over again.
Fibonacci Ratios. The role of fibonacci ratios in both corrective and impulsive markets is woefully incomplete in the book and, in my work, has time and again proven one of the the most important factors in predicting and confirming both wave end-targets and whether a structure is corrective, or not.
Third waves of an impulsive sequence are almost always (I haven’t found an exception yet) 1.618 or 2.618 (in an extension) times the length of the first wave. Fifth waves are typically 1.618 X the length of the first wave. They can extend to 2.618 times the length of the first wave, but this is rare.
First Waves
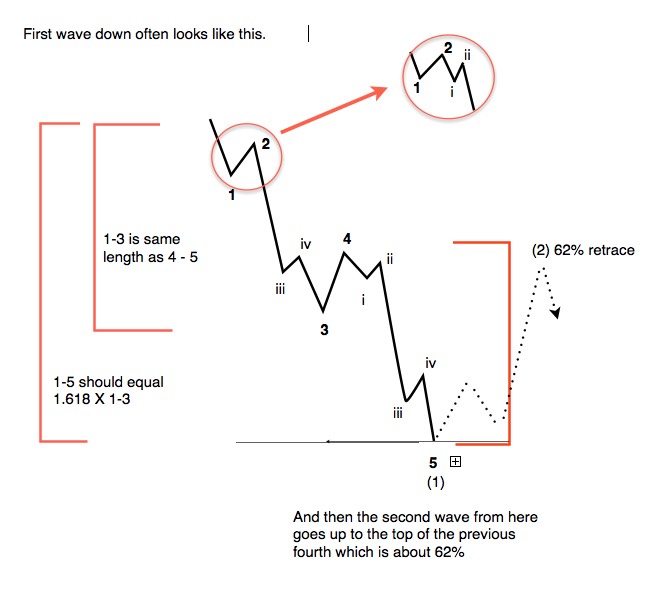 First waves of an impulsive pattern have a different structure than all other impulsive waves. This fact simply isn’t addressed in the book. This is why first waves often have the appearance of a three wave sequence. The different is subtle.
In a true impulsive first wave, wave 4 must retrace to the level of wave iv in the diagram and also must reach a retrace level of 38% of the distance to the beginning of the first wave. If it does not achieve this level, the entire sequence will prove to be corrective.
The wave pattern would then prove to be a zigzag, which is a 5-3-5 combination (corrective).
Simple Fives
There are two types of “five wavers” – “simple” and “impulsive.” Impulsive waves are actually quite rare and are only found in trending markets, not corrective ones. The rules for an impulsive wave are very strict: Waves 1, 3, and 5 must have 5 subwaves, the wave must have “the right look” (the correct proportions) and the lengths of all the waves must measure to the correct fibonacci lengths:
- wave 1 = 1 unit
- wave 2 retraces at least 62% of wave 1 in a corrective pattern
- wave 3 = 1.618 or 2.618 X the length of wave 1
- wave 4 retraces at least 38% of the first 3 waves combined in a corrective pattern
- wave 5 = 1.618 or 2.618 X wave 1 (and very rarely .618 of wave 1 or the same length)
Since 2009, we have had no impulsive waves in the NYSE indices. However, we have in the Nasdaq-related indices, but only on the way up from the low in 2009.
Simple 5-wavers are found in corrective wave patterns, are not impulsive, but often some of their subwaves (but not all) can form fibonacci relationships, similar to impulsive waves. You can find “simple fives,” as I like to call them, in A, B, and C waves (ie – in any corrective wave).
In the corrective wave structures, you will never find impulsive waves, so here are the obvious corrections to the book:
- zigzags never have impulsive waves (structure: simple 5, 3, simple 5)
- the C wave of a running, extended, or regular flat is never impulsive (structure: 3, 3, simple 5). In fact, these C waves usually have a 5th wave subwave that is not itself in 5 waves, but rather three)
C waves are never impulsive waves; they can be “simple fives,” or 3’s, or some other pattern, like an ending diagonal, for example. In other words, they can be just about anything they want to be, except impulsive.
Where a lot of confusion comes in, I think, is that the convention is to number impulsive waves the same way we label “simple fives.” However, one is in a trending market (impulsive) and has VERY strict guidelines and the other is in corrective patterns (simple five) and has few guidelines, other than the fact that you must be able to count 5 waves within them.
The difference between these waves isn’t addressed in the book and it took me a couple of years early on to prove the difference and refine my own set of rules around them. So, the book is a good start, but Prechter and Frost made changes to Elliott’s work (and some assumptions) that were made without enough research.
I consider the Elliott Wave Principle to be a science. As with any science, it evolves as we study it more over time and truly understand its intricacies. Too many have taken the book at face value, a book written decades ago.
B Waves as Irregular Tops.
I’ve tackled this interesting phenomenon at the top of this EW expose with a chart showing the SP500 from 2009 to today. Irregular tops appear (if at all) at the top of an impulsive trend. This is referred to as an “irregular top,” which Elliott identified as a feature of his theory, for different reasons that don’t apply to the current situation I describe above.
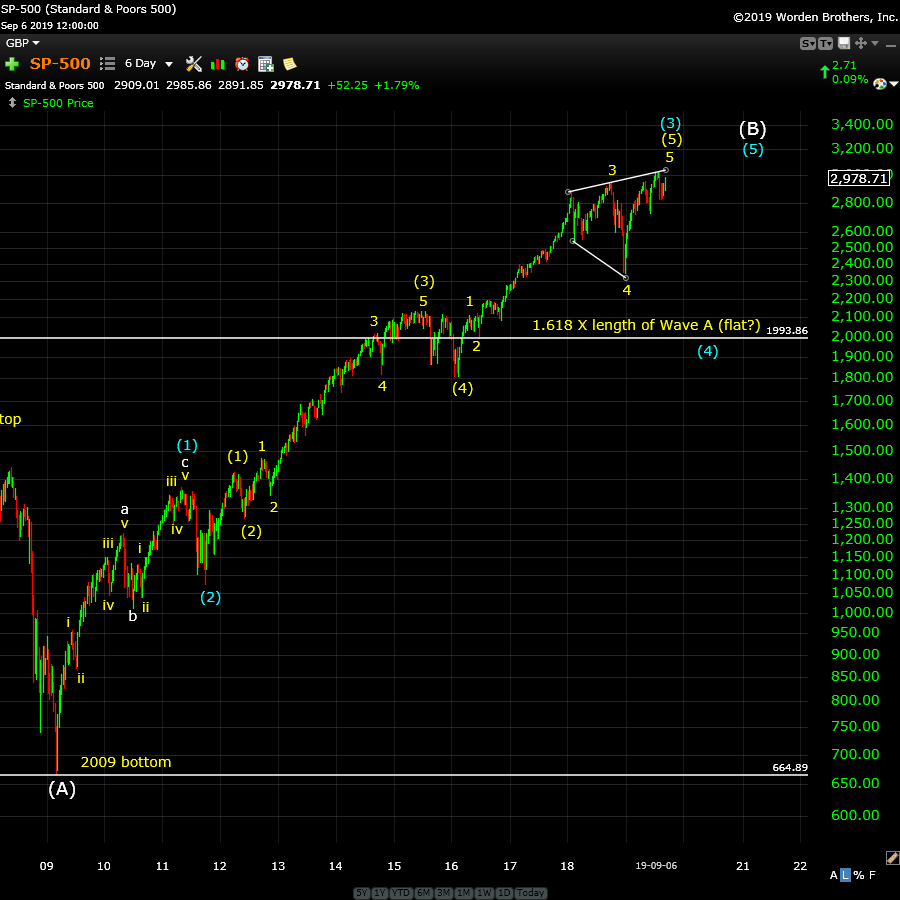
Above is a 6 day chart of the SP500 showing a corrective wave up from the 2009 bottom. Note that there is no valid second wave. The first set of waves up from the bottom is a zigzag, which is a corrective pattern. The second wave (ii) marked on the chart doesn’t even retrace 38%, so it’s not even close to fulfilling any requirement or guideline for an impulsive pattern.
But, here we are with a B wave up from a 2009 bottom. It should not be ignored, or “papered over” by ignoring the EW rules. The other element that often enters the picture is bias. Bob Prechter wrote an excellent warning about injecting bias into analysis under a sub-chapter, “Practical Application” on page 94. Maintaining objectivity is paramount to being a successful EW analyst.
It’s also critically important in advancing the Theory as a bonafide science. Recently, I’ve seen a chart from the EWI group that ignores a fifth wave in order to skirt the issue of this irregular top. However, in EW analysis, all waves must be accounted for.
In summary, what we have in the “Elliott Wave Principle” book is a technical publication containing some errors that reduce the predictive accuracy of the Elliott Wave Principle. It’s no wonder that Elliottwave practitioners come up with different counts. However, there is seldom more than one correct count. The cause of these multiple counts is the questionable accuracy of the tools they’re using.
I’ve been attempting to research these tools with the goal of clearing up the misconceptions. That’s been much of my focus over the past ten years, or so.
I’m not disparaging the work of Robert Prechter. He did a great service by publishing this book, which in my view, is the most comprehensive interpretation available of Mr. Elliott’s work. However, like any science, it often undergoes intense scrutiny, testing, and revising, with the ultimate goal of proving its viability without doubt. In my small way, this is what I’ve been attempting to do, and all the research I’ve done doubles down on the integrity of Ralph Elliott’s work and the Elliott Wave Principle itself.
________________________
I get asked often why EW analysts come up with different counts. Erroneous information is a great foundation on which to construct a building that will eventually collapse. If science is rock solid, then the building will stand forever.
However, if your tools are blunt, you’re going to do a less than adequate job as an analyst, through no fault of your own (other than laziness, I suppose).
Some have offered statements to the effect that the Elliott Wave Principle is a subjective method of analyzing the market. That’s an attitude that suggests a minimal understanding of the process.
Prechter himself spent a few pages on this very topic, summarized here:
“Despite the fact that many analysts do not treat it as such, the Wave Principle is by all means an objective study, or as Collins* put it, ‘a disciplined form of technical analysis.’” — page 94
• Charles Collins wrote the foreword to the Elliott Wave Principle.
As a result, I don’t generally look at anybody else’s work. I don’t let news or events play any part in my analysis. My job is to remain completely objective. I only look at indicators after I have done my initial analysis to see if they support (or not) my prognosis.
So, as an EW analyst, are you an “artist?” Perhaps, because you’re given a set of tools that are roughly hewn and have to use them to bring clarity to a market that moves in a predictable manner, churning out the same patterns over and over again, with Fibonacci relationships to each other most often provide multiple target options.
I suppose the real art is weeding out those options through experience. So, there is art in analysis, but I believe how the market moves to be a science that was uncovered by Ralph Elliott, with rules and guidelines that were refined, clarified, and communicated by Prechter and Frost. As a science, peer review often leads to a better understanding, and increased consensus as to it’s veracity.
My interest has been in refining the tools, finding the errors in the communication of Elliott’s work. Using these refinements, I continue to prove its value and over again in predicting the market with a very high degree of accuracy.
_________________________________
Elliott Wave Basics
Here is a page dedicated to a relatively basic description of the Elliott Wave Principle. You’ll also find a link to the book by Bob Prechter and A. J. Frost.
______________________________
The best of them JL 2
The best of them …Last couple of years, I subscribed to several ‘market traders’. You are by far the best of them and the personal contact is awesome. Daily and daily updates are very well written! Besides your expertise in EW, I also like your cycles analysis. Best investment I ever made! —JL |
Get an upper hand … JC 2
Get an upper hand in trading …Seeing all the different currency pairs and the wave structures and hearing you explain why this has to do that on a nightly bases gives one a upper hand when trading. Elliott Wave applies to all stock and indices and can be applied to any candlestick chart. If someone ask what you want for Christmas – Tell them a membership to Peter’s “Traders Gold!”—JC |
Have not had a losing week RW 2
Have not had a losing week …I have been with Peter almost a year. The only thing that matters is have I made money with his service. I think I have finally turned the corner using Peter’s EW. I have not had a losing week in the last 5 months. Thanks Peter, for your amazing amount of hard work. —RW |
Tops in your field DZ 2
Tops in your field …You are tops in your field. Tried to follow Elliot Wave international for years. They were always behind the market. After discovering you, I perceive that you are an expert in reading the waves, which puts you way ahead of the rest of your peers. And you can read the Waves like you are reading tomorrow’s financial section. I pray you stay healthy. —DZ |
Couldn’t be happier … KK 2
Couldn’t be happier …The analysis and insight you provide is simply amazing! I’ve been trading the futures and equity markets for well over thirty years and usually average around 5% monthly. Since joining your Traders Gold Service two months ago, that number has better than doubled. I couldn’t be happier.—KK |
the real deal SM 2
The real deal …‘Educational, insightful and thorough market analysis for all levels of traders. It’s Elliott Wave at its best….Peter Temple is the real deal’ —SM |
Rise above the rest … SM 2
Rise above the rest …I have only ever met a few people who, in their chosen fields (astrology, medicine, music, martial arts, technical analysis), rise above all the rest and you are one of them…you have ‘the gift’…and that’s why I’m a Trader’s Gold member. —SM |
A true expert in Elliott Wave FL 2
A true expert in Elliott Wave …You are a true expert in EW analysis. What you provide is not available anywhere and is priceless. Subscription on your services is the best thing I have ever done. Many thanks for your effort to make me a better investor. I now have more trust in my investment decisions. I hope you will continue the excellent work! —FL |
US Market Snapshot (based on end-of-week wave structure)
This chart is posted to provide a prediction of future market direction. DO NOT trade based upon the information presented here (certainly NOT from a daily chart).
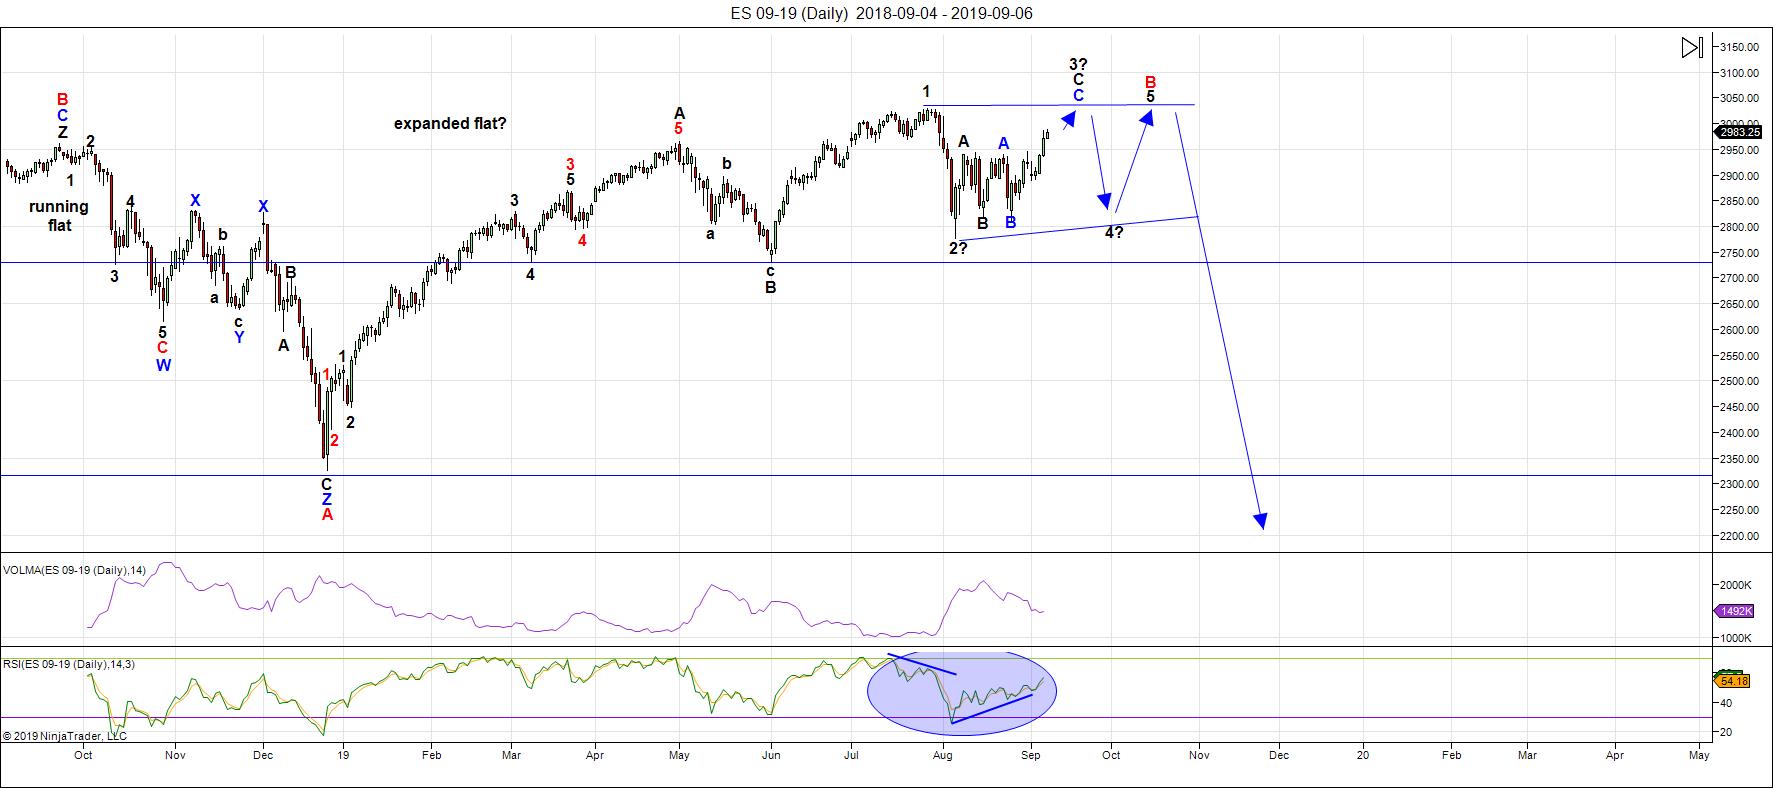
Above is the daily chart of ES (click to enlarge, as with any of my charts).
We've had a calm. bullish week this week, as expected. Even with the volatility of the week before, the ending diagonal remained intact across all the US indices, except IWM (the Russell 2000).
Note that the technicals are still quite supportive (RSI) of a further rally. That being the case, I'm sticking with the ending diagonal pattern for the reasons I outlined in past weeks. Nothing has broken, although the wave structure is quite complex, even for an ending diagonal. I'll follow this pattern until something breaks; so far, the market hasn't done anything "wrong."
If we break to a new low below ES 2778, then something else is happening.
There are no rules inside ending diagonals, except for the fact that we expect so see zigzags. I place us at above the halfway point, with a target of an all-time new high for a third wave. We appear to be tracing out a zigzag, but where we are exactly within the subwaves is not clear.
As I said a few weeks ago, I'm now looking towards mid-September for a top. If it's earlier, that would be great, but I don't think that'll be the case. The next Fed announcement is on the 17th. My preference, though, now, is for the 17th to mark the top of the third wave of the ending diagonal; the final top will most likely happen in the first half of October.
The larger pattern on the daily charts, as I've been saying for a few weeks now, appears to be a flat, which is making itself apparent in the DOW, SP500, NYSE, the Russell 3000, and very possibly, the Russell 2000.
Longer term in ES, I'm expecting the C wave of a an expanded flat to the downside. In that case, a first wave should drop to the 2725-30 area (previous fourth of one lesser degree) and then bounce in a second wave to the 2875 area (62% retrace), before a third wave down to about 2250. After that, a fourth and fifth wave down to under 2100 will round out the drop.
There is an option of a set of zigzags down to the same level, but it's less probable because there are so many flats set up across multiple stocks and indices. If a zigzag is the pattern that traces out, the retraces up will not be as strong as they would be with the C wave of a flat. We'll get a lot of information about the probable path from the first wave down.
The coming drop will be a world-wide phenomenon across all most all sectors. It will last the balance of the summer months and most likely culminate in a low and final round of QE.
As I've said since the low on Dec. 26, the waves up are corrective in the NYSE-related indices, and as a result, will completely retrace. Expect an imminent top and a major move to a new low under 2100.
Summary: The most probably pattern tracing out at the top of this large corrective wave up from Jan. 26 is an ending diagonal. if so, after 5 mostly sideways waves, it will culminate in a minimal new high, setting up for a devastating drop.
The larger degree pattern appears to be a flat (3-3-5 wave structures), which predicts a five wave dramatic drop to a new low below the A wave bottom at about 2300. The larger pattern in ES is a record-breaking broadening top (not an EW pattern).
I expect the ultimate bottom will be somewhere under 2100.
Once we've completed the fourth wave down, we'll have a long climb to a final slight new high in a fifth wave of this 500 year cycle top.
___________________________
Trader's Gold Subscribers get a comprehensive view of the market, including hourly (and even smaller timeframes, when appropriate) on a daily basis. They also receive updates through the comments area. I provide only the daily timeframe for the free blog, as a "snapshot" of where the market currently trades and the next move on a weekly basis.
I do a nightly video on the US indices, USD Index (and related currency pairs), gold, silver, and oil).
______________________________________
Sign up for: The Chart Show
Next Date: Wednesday, September 18 at 5:30 pm EST (US market time)

The Chart Show is a one hour webinar in which Peter Temple provides the Elliott Wave analysis in real time for the US market, gold, silver, oil, major USD currency pairs, and more. You won't find a more accurate or comprehensive market prediction anywhere for this price.
Get caught up on the market from an Elliott Wave perspective. There’ll be a Q&A session during and at the end of the webinar and the possibility (depending on time) of taking requests.
For more information and to sign up, click here.
| "I think you are the only Elliot Wave technician on the planet who knows what he's doing.” |
| m.d. (professional trader) |
All registrants will receive the video playback of the webinar, so even if you miss it, you’ll be sent the full video replay within about an hour of its conclusion.


