
 Between a Rock and a Hard Place
The central bankers of the world are powerless to stop the deflationary situation which is unfolding. They’ve been trying to turn it around for the past 10 years (ever since 2008), but have been unable to do so. The past few days, treasury yields have been rising, but Trump is calling for cuts. It’ll be interesting to see what happens with interest rates on Wednesday, but in fact, it won’t make any difference whatsoever. The market will come down.
We’ve been here before, of course.
In the late 1920s, there was a “deal” struck between the Bank of England and the Federal Reserve to keep US interest rates artificially low. As a result, US dollars were inexpensive to borrow and this fuelled speculation in the stock market, the same phenomenon we have today. However the difference between then and now was that most countries in the early 20th century were tied to the gold standard. Since 1944, at least (until 1971), US Dollars could be redeemed at any time for gold at pegged price of $35 an ounce.
The specific problem in the 1920s was that England was concerned about their economy. The first World War had stripped Britain of much of its gold reserves. To build them back up, they made a deal with the US government to lower US interest rates so that investment money (and gold) would stream to the United Kingdom, seeking the higher rates.
Today, currency rates float (currencies are no longer pegged to the gold price), so international market forces have a much bigger influence on currency values.
In spite of the manipulation (high inflation) in the 1920s, US Treasury rates eventually started to sneak up, particularly in 1928 and this forced the Federal Reserve to raise rates.
It’s the same situation today. Exactly. And we’ve seen the Federal Reserve react and pretend that they’re in complete control of the economy. However, they have no idea where the economy is going and are simply reacting to market forces. Obviously, behind the facade, they have to be scared to death.
Interest Rates Before the Great Depression
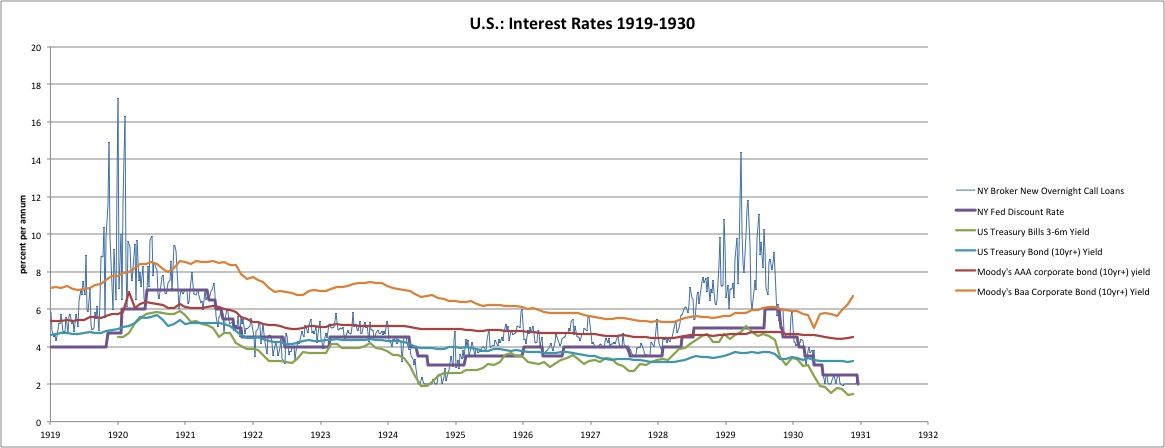
The above chart comes from New World Economics and tracks the US interest rate during the 1920s, leading up to the Great Depression.
What’s important in the chart above is the fact that the Federal Reserve does not raise rates “on their own.” In fact, when Alan Greenspan was asked on CNBC, “Did you keep the interest rates too low for too long in 2002-2003?” blurted, “We didn’t raise rates. The market did.”
You can see on the chart above that the green Treasury Bond (10yr+) yield began to rise going into 1928. The Federal Reserve was bound to follow (purple line) and, sure enough, it did.
Treasury Rates and the Economy
The U.S. Treasury sells bonds at auction. It sets a fixed face value and interest rate for each bond. If there is a lot of demand for Treasurys, they will go to the highest bidder at a price above the face value. That decreases the yield, or the total return on investment. That’s because the bidder has to pay more for the bonds, but receives the same amount in return. In other words, the yield (or profit) to the buyer is less.
If there isn’t a lot of demand, the bidders will pay less than the face value. That increases the yield. The bidder pays less to receive the stated interest rate. That is why yields always move in the opposite direction of Treasury prices.
When there’s not much demand, then bond prices drop. Yields increase to compensate. That makes it more expensive to buy a home because mortgage interest rates rise. Buyers have to pay more for their mortgage, so they’re forced to buy a less expensive home. That makes builders lower home prices. Since home construction is a component of gross domestic product, then lower home prices slow economic growth.
Rising Treasury rates then can be deflationary (people don’t borrow when rates are high, which means there is less money in the economy). As rates rise in the market we’re currently in, at some point, the market is going to head south. What will that point be? That’s the big question.
On the other hand, in an economy that is faltering (that is already experiencing deflation—or the latest buzzword, like “disinflation”—anything to obfuscate the truth), money tends to seek safe havens. US treasury bonds are perceived as a safe haven in times of turmoil. They’re in greater demand even at low interest rates. Looking at the ten year treasuries chart below, it looks to me that rates are going lower (this was my forecast when I originally wrote this article, and it’s proven out)..
Low yields on Treasurys mean lower rates on mortgages. Homebuyers can afford a larger home. The increased demand stimulates the real estate market. That boosts the economy. Lower rates also allow homeowners to afford a second mortgage. They’ll use that money for home improvements, or to purchase more consumer products. Both stimulate the economy. BUT when we get to a point of too much debt, fear starts to enter the equation. Under this scenario, expect a deflationary spiral and a market collapse.
The Current 10 Year Treasury Rate
So rather than watching the Federal Reserve and interest rates, it makes much more sense to watch the TNX chart below and you’ll have a much better idea of what’s going to happen at any of the coming Federal Reserve meetings.
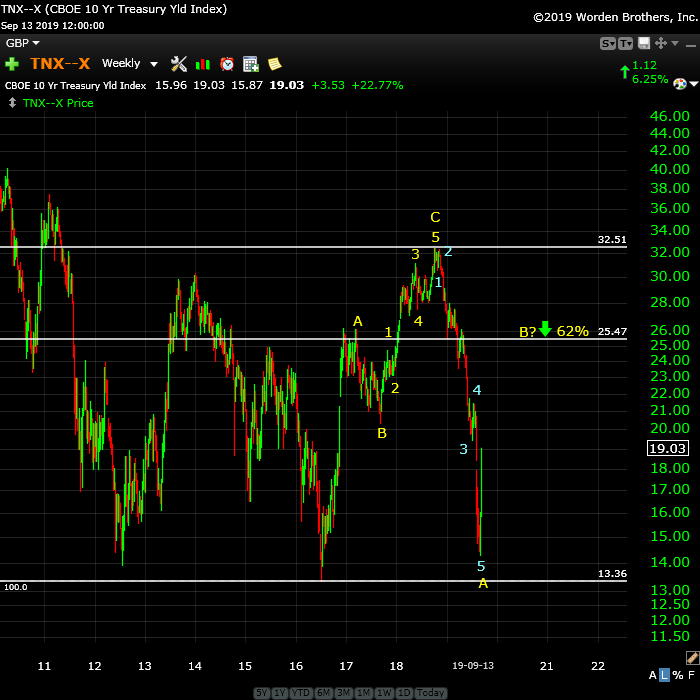
Above is the weekly chart of TNX (the 10 year Treasury yield).
In mid 2016, interest rates bottomed and then rose to about 3.250 in a corrective wave. From an Elliott Wave perspective, it was obvious rates were going to head down. They bottomed recently at about 1.3%. In the past few days, we’ve spiked back up to the point that we’re sitting at 1.9%. This wave up should be an ABC retrace and it looks like it will eventually rise to the 62% retrace level, which is a little higher than 2.5%.
Then the will turn right back down and go do a new low. The bottom line is that interest rates are going to be headed lower … much lower.
The Fed typically follows treasuries. But now, we have Trump calling for lower rates at a time where they’re starting to rise (they’re not going through the roof, but the timing of the rise is certainly interesting. It puts the Fed between a rock and a hard place. We’ll see what they decide to do. It won’t make any difference to where the market goes; it’s going to head down.
What will be really interesting is how they explain it all …..
We’ve been here before, we’re here again now, and it’s just a matter of time (not very much time now) until the larger market tops … and drops.
What’s important is that it’s NOT the Federal Reserve that determines the future of the market, it’s actually the market itself. However, humans don’t necessarily think that way and so you can have a really good grasp of the future by keeping an eye on Treasury rates. You’ll be ahead of the market.
_________________________________
Fun Times!
I got sent a link to a video put out by Elliott Wave International, which is complete nonsense. Absolutely nothing in it makes any sense. I left a very detailed comment to attempt to explain what they should know. We’ll see if they allow it to remain on the screen … lol.
Here is the link: https://youtu.be/hGgALzJXCbc
I do get tired of these folks destroying what little credibility Elliott Wave still has. I think it’s criminal, but I suppose that’s just me. They’re coming across as more incompetent every month.
_________________________________
Elliott Wave Basics
Here is a page dedicated to a relatively basic description of the Elliott Wave Principle. You’ll also find a link to the book by Bob Prechter and A. J. Frost.
______________________________
Tops in your field DZ 2
Tops in your field …You are tops in your field. Tried to follow Elliot Wave international for years. They were always behind the market. After discovering you, I perceive that you are an expert in reading the waves, which puts you way ahead of the rest of your peers. And you can read the Waves like you are reading tomorrow’s financial section. I pray you stay healthy. —DZ |
A true expert in Elliott Wave FL 2
A true expert in Elliott Wave …You are a true expert in EW analysis. What you provide is not available anywhere and is priceless. Subscription on your services is the best thing I have ever done. Many thanks for your effort to make me a better investor. I now have more trust in my investment decisions. I hope you will continue the excellent work! —FL |
Couldn’t be happier … KK 2
Couldn’t be happier …The analysis and insight you provide is simply amazing! I’ve been trading the futures and equity markets for well over thirty years and usually average around 5% monthly. Since joining your Traders Gold Service two months ago, that number has better than doubled. I couldn’t be happier.—KK |
the real deal SM 2
The real deal …‘Educational, insightful and thorough market analysis for all levels of traders. It’s Elliott Wave at its best….Peter Temple is the real deal’ —SM |
Rise above the rest … SM 2
Rise above the rest …I have only ever met a few people who, in their chosen fields (astrology, medicine, music, martial arts, technical analysis), rise above all the rest and you are one of them…you have ‘the gift’…and that’s why I’m a Trader’s Gold member. —SM |
Have not had a losing week RW 2
Have not had a losing week …I have been with Peter almost a year. The only thing that matters is have I made money with his service. I think I have finally turned the corner using Peter’s EW. I have not had a losing week in the last 5 months. Thanks Peter, for your amazing amount of hard work. —RW |
Get an upper hand … JC 2
Get an upper hand in trading …Seeing all the different currency pairs and the wave structures and hearing you explain why this has to do that on a nightly bases gives one a upper hand when trading. Elliott Wave applies to all stock and indices and can be applied to any candlestick chart. If someone ask what you want for Christmas – Tell them a membership to Peter’s “Traders Gold!”—JC |
The best of them JL 2
The best of them …Last couple of years, I subscribed to several ‘market traders’. You are by far the best of them and the personal contact is awesome. Daily and daily updates are very well written! Besides your expertise in EW, I also like your cycles analysis. Best investment I ever made! —JL |
US Market Snapshot (based on end-of-week wave structure)
This chart is posted to provide a prediction of future market direction. DO NOT trade based upon the information presented here (certainly NOT from a daily chart).
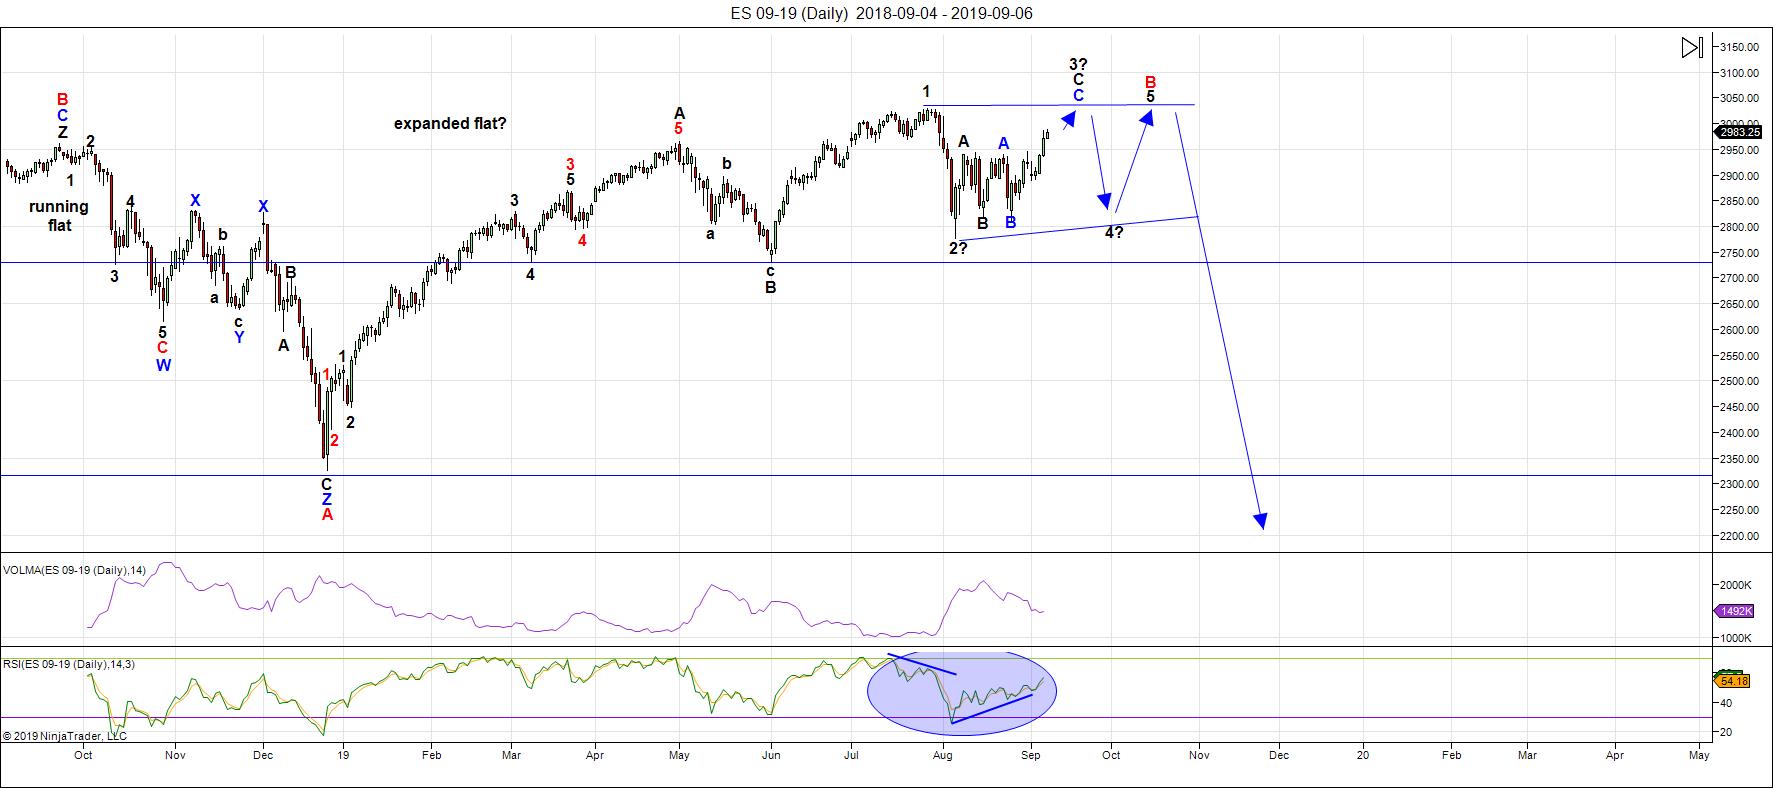
Above is the daily chart of ES (click to enlarge, as with any of my charts).
We've had another bullish week this week, as expected. The ending diagonal pattern seems to be playing out as predicted.
Note that the daily technicals (RSI) are still quite supportive of a continuing rally.
I put us near the top of the third wave of the ending diagonal. We need to get to a new high before turning back down in the fourth wave, which I expect to descend about 200 points to the lower trendline.
The slope of the upper trendline gets determined by the third wave high, but because of restrictions in the SP500, I don't expect much higher than about 3040.
The lower trendline is determined by the bottom of the fourth wave. There's a restriction here, as well, in that the trendlines cannot diverge. They usually get close to being parallel, but if they diverge, then the ending diagonal breaks and I would expect us to descend further in that case.
After the fourth wave is complete, there is one more wave up to a new high to complete the ending diagonal.
All eyes should be on the Fed announcement on September 17 as a market trigger.
Longer term in ES, I'm expecting the C wave of a an expanded flat to the downside. In that case, a first wave should drop to the 2725-30 area (previous fourth of one lesser degree) and then bounce in a second wave to the 2875 area (62% retrace), before a third wave down to about 2250. After that, a fourth and fifth wave down to under 2100 will round out the drop.
There is an option of a set of zigzags down to the same level, but it's less probable because there are so many flats set up across multiple stocks and indices. If a zigzag is the pattern that traces out, the retraces up will not be as strong as they would be with the C wave of a flat. We'll get a lot of information about the probable path from the first wave down.
The coming drop will be a world-wide phenomenon across all most all sectors. It will last the balance of the summer months and most likely culminate in a low and final round of QE.
As I've said since the low on Dec. 26, the waves up are corrective in the NYSE-related indices, and as a result, will completely retrace. Expect an imminent top and a major move to a new low under 2100.
Summary: The most probably pattern tracing out at the top of this large corrective wave up from Jan. 26 is an ending diagonal. if so, after 5 mostly sideways waves, it will culminate in a minimal new high, setting up for a devastating drop.
The larger degree pattern appears to be a flat (3-3-5 wave structures), which predicts a five wave dramatic drop to a new low below the A wave bottom at about 2300. The larger pattern in ES is a record-breaking broadening top (not an EW pattern).
I expect the ultimate bottom will be somewhere under 2100.
Once we've completed the fourth wave down, we'll have a long climb to a final slight new high in a fifth wave of this 500 year cycle top.
___________________________
Trader's Gold Subscribers get a comprehensive view of the market, including hourly (and even smaller timeframes, when appropriate) on a daily basis. They also receive updates through the comments area. I provide only the daily timeframe for the free blog, as a "snapshot" of where the market currently trades and the next move on a weekly basis.
I do a nightly video on the US indices, USD Index (and related currency pairs), gold, silver, and oil).
______________________________________
Sign up for: The Chart Show
Next Date: Wednesday, September 25 at 5:00 pm EST (US market time)

The Chart Show is a one hour webinar in which Peter Temple provides the Elliott Wave analysis in real time for the US market, gold, silver, oil, major USD currency pairs, and more. You won't find a more accurate or comprehensive market prediction anywhere for this price.
Get caught up on the market from an Elliott Wave perspective. There’ll be a Q&A session during and at the end of the webinar and the possibility (depending on time) of taking requests.
For more information and to sign up, click here.
| "I think you are the only Elliot Wave technician on the planet who knows what he's doing.” |
| m.d. (professional trader) |
All registrants will receive the video playback of the webinar, so even if you miss it, you’ll be sent the full video replay within about an hour of its conclusion.


