Santa Showed Up, but …
This topping process has been the most extraordinary thing I’ve ever seen. Absolutely everything has traced out corrective waves at the top — that’s never happened before in any market, as far as I’m aware. But it does help to confirm the current pattern — an expanded flat.
Since the bottom on Dec. 26, 2018, we’ve been in a rising corrective B wave of a flat. It will completely retrace to the downside in five waves. The wait has been a long one, but it’s almost over.
Keep in mind that the B wave of a flat is the one of the most difficult waves to catch to top of (bottom in a bear market). When it ends, it ends. The final subwaves are typically corrective and there’s little warning of the turn.
What helps this time is that all the major asset classes have been getting more and more tightly aligned and they will all turn at close to the same time.
Currencies, oil, and the US indices have lined up for a turn to the downside. There is a little more work to be done, but we’re now talking about a matter of hours, not days. We seem to be targeting year-ends, or beginnings for these major turns.
We may even end up getting gold and silver to a new high for the same turn, but that one is up in the air at the moment.
“The market does the most predictable thing, in the most unpredictable manner.”
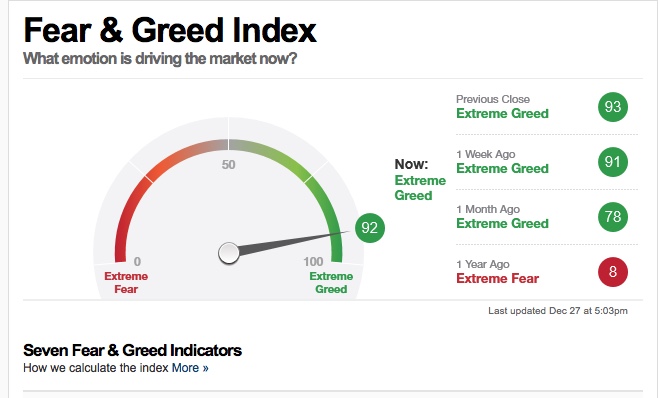
Here’s the latest market sentiment level from the CNN fear and greed index:

Sentiment mid-day on Thursday actually hit 93, which is the highest level I’ve ever seen on this index. That signifies that everyone’s pretty much “in” the market and feeling very good about they money they’ve made — an excellent foreshadowing of a top.
As I’ve mentioned, all major asset classes i cover are moving towards a common inflection point. I expect all of them to turn at about the same time. That most likely means we’re going to get what will be referred to as a “flash crash.” Everything is going to drop in tandem and that can only mean it will be a spectacular show.
Again, we’ve never seen anything like this set-up before (at the top of a market), but otherwise, it should follow the prescribed pattern … with a dramatic wave down to under 2100 for ES/SPX.
Know the Past. See the Future
____________________________
The “All the Same Market” Problem
There’s good news and bad news with everything moving in tandem now. It means that trades are far and few between. In other words, they all happen together. There’s a long period of topping (which is a different trading environment) and then everything turns at the same time, so you need to instigate your trades together.
The good side of all this is that you have several asset classes that reinforce the trade direction, because they all change direction at the same time. This is likely to continue to be the case for indices, oil, gold and silver, and currency pairs for the foreseeable future.
_________________________________
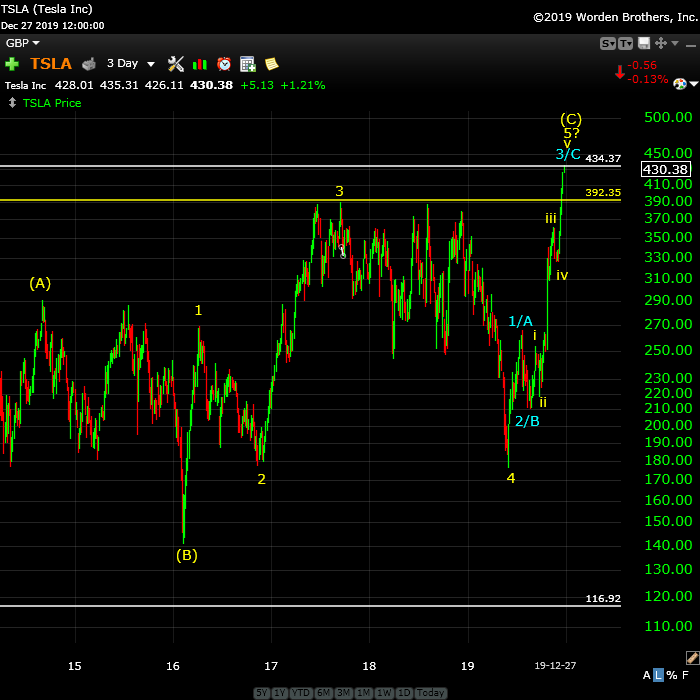
Telsa Update (TSLA)

Above is the 2 hour chart of the TSLA (Tesla). I’ve been watching this final pattern unfold over the past couple of weeks. That larger pattern is corrective and so is this final wave up. I have labelled it as both corrective and as an unfinished possible motive wave up. I see this as a possible final top.
If a wave down drops below 265, there’s a good chance the top is in. I’d want to see that the wave down is not obviously corrective before committing to a short, but if you’re interesting in shorting it, an out of the money, low risk put would do it. It has some pretty amazing swings to it, so be careful. I’d be looking at three months to a wave bottom.
The structure of the resulting wave down will be very important in determining whether a final top is in place.
____________________________
Elliott Wave Basics
Here is a page dedicated to a relatively basic description of the Elliott Wave Principle. You’ll also find a link to the book by Bob Prechter and A. J. Frost.
______________________________
US Market Snapshot (based on end-of-week wave structure)
This chart is posted to provide a prediction of future market direction. DO NOT trade based upon the information presented here (certainly NOT from a daily chart).

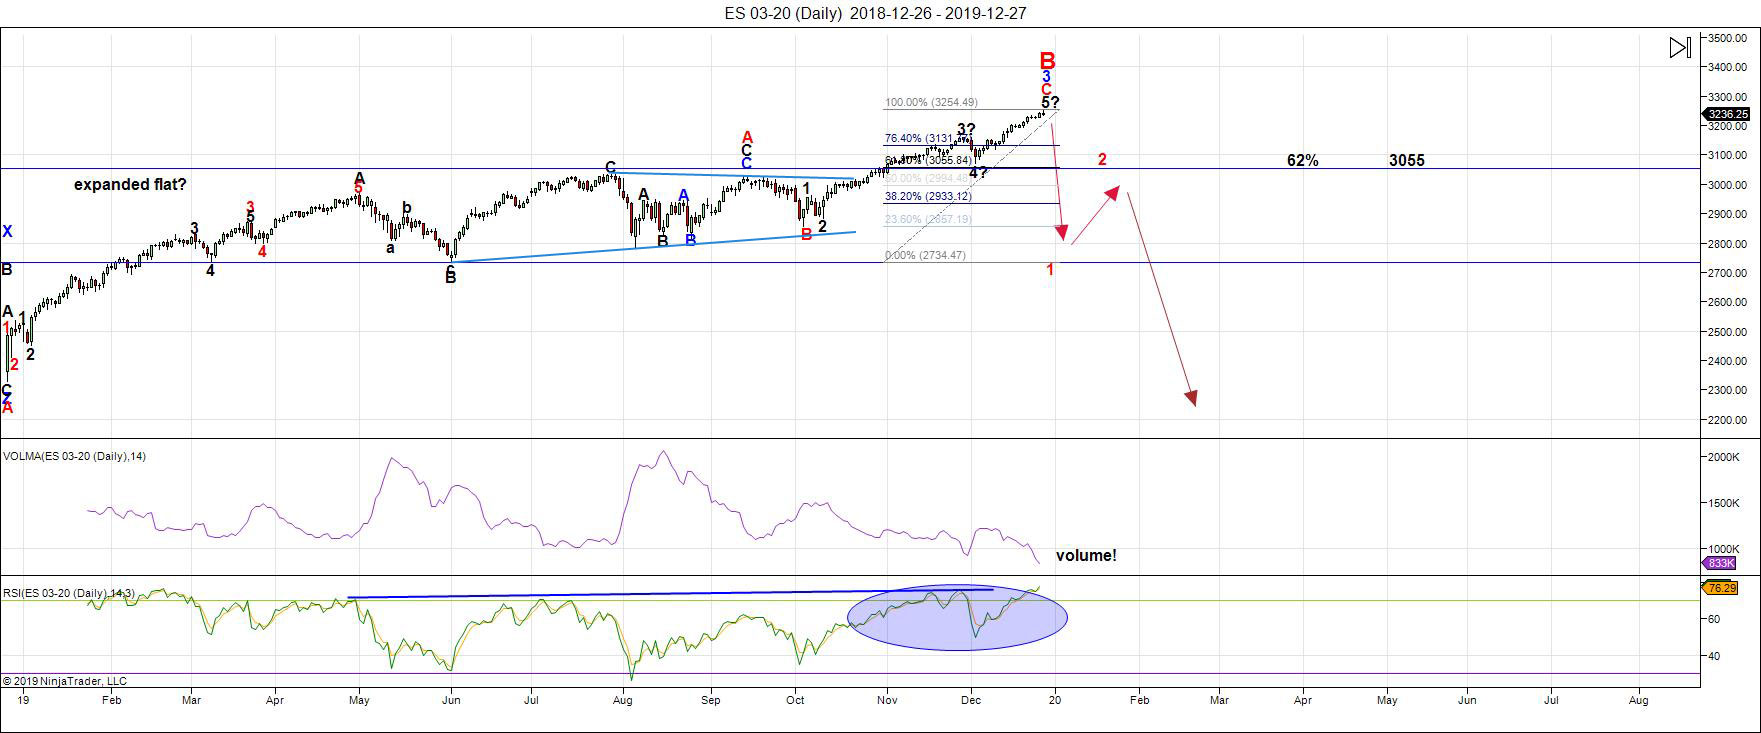
Above is the daily chart of ES (click to enlarge, as with any of my charts).
The direction is still up, but not much longer. We've been waiting for currencies to top (the US Dollar to bottom), but nothing's been moving for over a week. Finally, late this week, all USD currencies suddenly moved towards their targets in a space of about 24 hours.
This weekend, we're sitting with everything very close to a final top in wave count and measurements. However, the final small fifth waves up (that I highlighted in last week's NYSE video) turned corrective and moved a few more points, as a result.
However, with sentiment at new extremes, DAX near a top, oil near a top, and the US Dollar index close to a double bottom, a turn down is imminent.
We may still get that turn before we see New Year's Eve play out.
As I wrote a couple of weeks ago, the Fed is battling a US Dollar liquidity problem, which is bearish for the overall market, bullish for the US Dollar, and a clear signal that deflation is waiting right around the corner.
The overall pattern across all US indices now is a flat. That strongly suggests we're going to see a 5 wave pattern to the downside under the 2100 level, as I've been predicting.
_______________________
There is an option of a set of zigzags down to the same level, but it's much less probable because there are so many flats set up across multiple stocks and indices. If a zigzag is the pattern that traces out, the retraces up will not be as strong as they would be with the C wave of a flat. We'll get a lot of information about the probable path from the first wave down.
___________________________
Summary: The current B wave up is most probably the B wave of an expanded flat. The A wave ended on Jan. 26, 2018. The B wave up will end in a set of corrective subwaves. A trend change is imminent.
We're at the top this weekend of a final fifth of fifth subwave. This week is set up for a turn due to measurements, and wave structure. There are large liquidity issues for the US Dollar which should increase as we move into the New Year.
Look for the ultimate bottom to be somewhere under 2100 in ES.
Once we've completed the fourth wave down, we'll have a long climb to a final slight new high in a fifth wave of this 500 year cycle top.
___________________________
Trader's Gold Subscribers get a comprehensive view of the market, including hourly (and even smaller timeframes, when appropriate) on a daily basis. They also receive updates through the comments area. I provide only the daily timeframe for the free blog, as a "snapshot" of where the market currently trades and the next move on a weekly basis.
I do a nightly video on the US indices, USD Index (and related currency pairs), gold, silver, and oil).
______________________________________
Sign up for: The Chart Show
CANCELLED FOR CHRISTMAS AND NEW YEAR'S DAY
Next Date: Wednesday, January 5 at 5:00 pm EST (US market time)

The Chart Show is a one hour webinar in which Peter Temple provides the Elliott Wave analysis in real time for the US market, gold, silver, oil, major USD currency pairs, and more. You won't find a more accurate or comprehensive market prediction anywhere for this price.
Get caught up on the market from an Elliott Wave perspective. There’ll be a Q&A session during and at the end of the webinar and the possibility (depending on time) of taking requests.
For more information and to sign up, click here.
| "I think you are the only Elliot Wave technician on the planet who knows what he's doing.” |
| m.d. (professional trader) |
All registrants will receive the video playback of the webinar, so even if you miss it, you’ll be sent the full video replay within about an hour of its conclusion.


