

Thank You, Central Banks …
… for stealing our money and ruining the economy worldwide.
This smaller bubble (still one more final high to go in 2021) is about to pop and we’re going to see the Fed “without any clothes,” so to speak. So many signals are pointing to a top here.
When I took a look at the charts of the US indices on Friday night, it was obvious we were tracing out a small ending diagonal. This is a terminal pattern. Once it hits a new high, it will turn to the downside in a dramatic fashion.
Everything I see is pointing to an impending turn. We even had some sort of news conference with Trump and the gang talking about how wonderful they are and how the market was doing so well … (a sign of extreme bullishness …)
The market is “all over the news” … another sure sign a top is in progress.
Arch Crawford put out a little Facebook post saying Trump’s astrological chart isn’t looking very good for Jan. 8 – 16 … another sign of impending volatility.
I’m looking at this coming Monday or Tuesday for a turn. But it’s tricked us before, so maybe it can somehow last a little longer. I personally doubt it, but we’ll see what Monday morning looks like.
We may even end up getting gold and silver to a new high for the same turn; gold is very close to its target this weekend, but silver has a little more to go …
Then there’s the Fed’s liquidity problem, with another round starting on Monday, as per this article.
“The market does the most predictable thing, in the most unpredictable manner.”
Here’s the latest market sentiment level from the CNN fear and greed index:
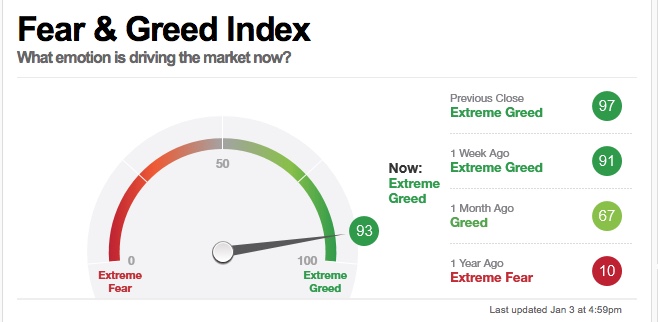
Sentiment this week actually hit 97, which is the highest level I’ve ever seen on this index. That signifies that everyone’s pretty much “in” the market and feeling very good about they money they’ve made — an excellent foreshadowing of a top. It’s back down to 93 this weekend, but that’s still exceptionally high.
This weekend, we’re even closer than last weekend. We actually have ending diagonals formed in NYSE, SP500, SPY, and the Russell 3000.
As I’ve said continuously, I expect almost all asset classes to turn at about the same time. If that happens, we’re likely going to get what will be referred to as a “flash crash.” Everything is going to drop in tandem and that can only mean it will be a spectacular show.
Again, we’ve never seen anything like this set-up before (at the top of a market), but as an expanded flat in most US indices, it should follow the prescribed pattern … with a dramatic wave down to under 2100 for ES/SPX.
Know the Past. See the Future
____________________________
AAPL
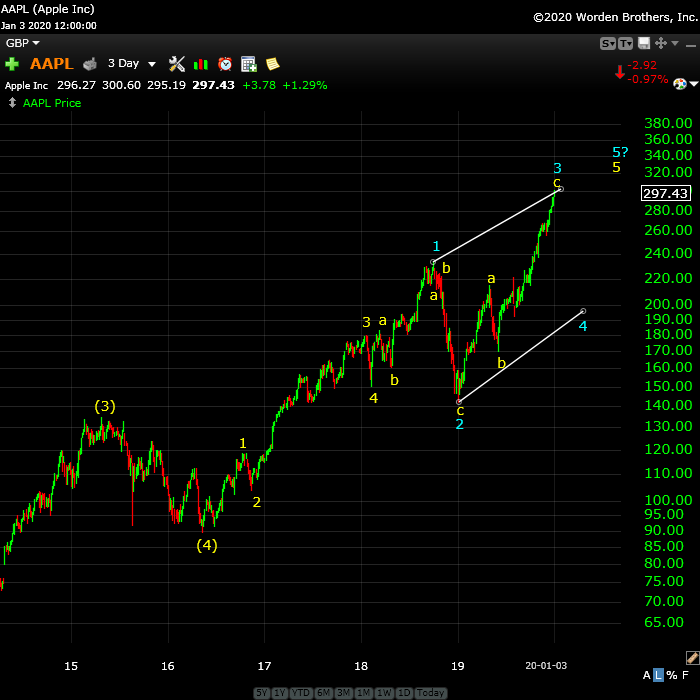
Above is the 3 day chart of the AAPL (Apple). It’s clearly at the top of the third wave of an ending diagonal. There are a lot of these patterns showing up in the market right now, at various degrees of trend.
This particular one tells me that we’re going to see an imminent turn down in a fourth wave that targets the lower trendline. It will come down in three waves. That will leave one more wave up to a final high (the fifth wave), which I would expect to top in early 2021.
____________________________
Elliott Wave Basics
Here is a page dedicated to a relatively basic description of the Elliott Wave Principle. You’ll also find a link to the book by Bob Prechter and A. J. Frost.
______________________________
The best of them JL 2
The best of them …Last couple of years, I subscribed to several ‘market traders’. You are by far the best of them and the personal contact is awesome. Daily and daily updates are very well written! Besides your expertise in EW, I also like your cycles analysis. Best investment I ever made! —JL |
Get an upper hand … JC 2
Get an upper hand in trading …Seeing all the different currency pairs and the wave structures and hearing you explain why this has to do that on a nightly bases gives one a upper hand when trading. Elliott Wave applies to all stock and indices and can be applied to any candlestick chart. If someone ask what you want for Christmas – Tell them a membership to Peter’s “Traders Gold!”—JC |
Have not had a losing week RW 2
Have not had a losing week …I have been with Peter almost a year. The only thing that matters is have I made money with his service. I think I have finally turned the corner using Peter’s EW. I have not had a losing week in the last 5 months. Thanks Peter, for your amazing amount of hard work. —RW |
Couldn’t be happier … KK 2
Couldn’t be happier …The analysis and insight you provide is simply amazing! I’ve been trading the futures and equity markets for well over thirty years and usually average around 5% monthly. Since joining your Traders Gold Service two months ago, that number has better than doubled. I couldn’t be happier.—KK |
the real deal SM 2
The real deal …‘Educational, insightful and thorough market analysis for all levels of traders. It’s Elliott Wave at its best….Peter Temple is the real deal’ —SM |
Rise above the rest … SM 2
Rise above the rest …I have only ever met a few people who, in their chosen fields (astrology, medicine, music, martial arts, technical analysis), rise above all the rest and you are one of them…you have ‘the gift’…and that’s why I’m a Trader’s Gold member. —SM |
Tops in your field DZ 2
Tops in your field …You are tops in your field. Tried to follow Elliot Wave international for years. They were always behind the market. After discovering you, I perceive that you are an expert in reading the waves, which puts you way ahead of the rest of your peers. And you can read the Waves like you are reading tomorrow’s financial section. I pray you stay healthy. —DZ |
A true expert in Elliott Wave FL 2
A true expert in Elliott Wave …You are a true expert in EW analysis. What you provide is not available anywhere and is priceless. Subscription on your services is the best thing I have ever done. Many thanks for your effort to make me a better investor. I now have more trust in my investment decisions. I hope you will continue the excellent work! —FL |
US Market Snapshot (based on end-of-week wave structure)
This chart is posted to provide a prediction of future market direction. DO NOT trade based upon the information presented here (certainly NOT from a daily chart).
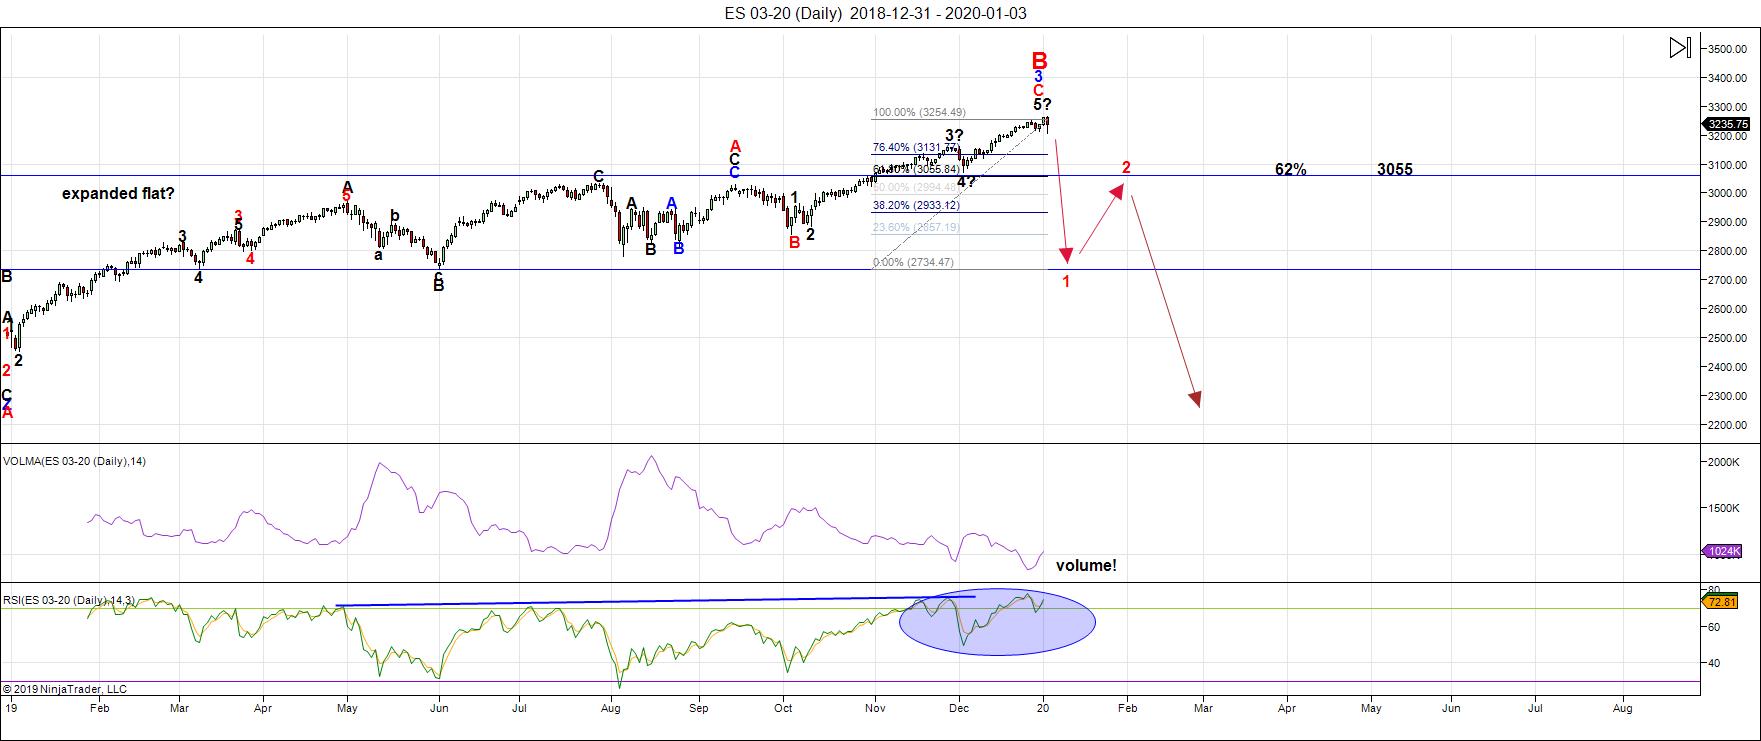
Above is the daily chart of ES (click to enlarge, as with any of my charts).
A little more patience is needed, but not very much. I'm seeing ending diagonals in most of the major US indices. Ending diagonals are final wave patterns and these ones are on a 10 minute chart; we're in the final fifth wave.
Later this week, the indices again did what they so often do: They dropped down while other asset classes shortened their paths to their ultimate targets. While gold and silver were lagging the rest, now virtually everything I cover is within a day or two of targets. You never know what additional shenanigans the market has up its sleeve (we've seen a lot of them over the past couple of months), but I can see how we can last the week.
On top of all this, of course, we have major liquidity issues around the US Dollar (as per the article at the top of the blog post).
This weekend, we're sitting with everything very close to a final top in wave count and measurements. On top of that, we have ending diagonals formed in most of the US indices. The turn is nigh (DAX may have already topped, but with a large gap down from the top, it's impossible to say for sure).
The overall pattern across all US indices now is a flat. That strongly suggests we're going to see a 5 wave pattern to the downside under the 2100 level, as I've been predicting.
_______________________
There is an option of a set of zigzags down to the same level, but it's much less probable because there are so many flats set up across multiple stocks and indices. If a zigzag is the pattern that traces out, the retraces up will not be as strong as they would be with the C wave of a flat. We'll get a lot of information about the probable path from the first wave down.
___________________________
Summary: The current B wave up is most probably the B wave of an expanded flat. The A wave ended on Jan. 26, 2018. The B wave up will end in a set of corrective subwaves. A trend change is imminent.
We're at the top this weekend of a final fifth of fifth subwave. This week is set up for a turn due to measurements, and wave structure. There are large liquidity issues for the US Dollar which should increase as we move into the New Year.
Look for the ultimate bottom to be somewhere under 2100 in ES.
Once we've completed the fourth wave down, we'll have a long climb to a final slight new high in a fifth wave of this 500 year cycle top.
___________________________
Trader's Gold Subscribers get a comprehensive view of the market, including hourly (and even smaller timeframes, when appropriate) on a daily basis. They also receive updates through the comments area. I provide only the daily timeframe for the free blog, as a "snapshot" of where the market currently trades and the next move on a weekly basis.
I do a nightly video on the US indices, USD Index (and related currency pairs), gold, silver, and oil).
______________________________________
Sign up for: The Chart Show
Next Date: Wednesday, January 6 at 5:00 pm EST (US market time)

The Chart Show is a one hour webinar in which Peter Temple provides the Elliott Wave analysis in real time for the US market, gold, silver, oil, major USD currency pairs, and more. You won't find a more accurate or comprehensive market prediction anywhere for this price.
Get caught up on the market from an Elliott Wave perspective. There’ll be a Q&A session during and at the end of the webinar and the possibility (depending on time) of taking requests.
For more information and to sign up, click here.
| "I think you are the only Elliot Wave technician on the planet who knows what he's doing.” |
| m.d. (professional trader) |
All registrants will receive the video playback of the webinar, so even if you miss it, you’ll be sent the full video replay within about an hour of its conclusion.


