
 Yogi Berra
Lawrence Peter “Yogi” Berra (May 12, 1925 – September 22, 2015) was an American baseball player, manager and member of Major League Baseball’s Hall of Fame, noted for his bad-ball hitting, his ability to perform in the clutch, and his peculiar, humorous-sounding statements. Most people have heard at least some of these statements, often without knowing the source.
My choice for the title of this blog post is a common expression that comes from a different source (the opera): “It ain’t over till the fat lady sings.”
It reminded me of Yogi’s work, but it was a more appropriate expression when we had Janet Yellen at the head of the Federal Reserve … lol. Now, Yogi’s expression of
“It ain’t over till it’s over” fits the current situation better.
Two weeks ago, it appeared that we were tracing out an ending diagonal in the cash indices right at the top of the market. A week later, it appeared that we weren’t, supported by e-mini futures that obviously weren’t tracing out ending diagonals. This weekend, it’s become clear that cash and futures have different patterns (somewhat rare) — impulsive wave in futures, but ending diagonals in the cash indices (in a slightly different position than for my original ED call).
The wave structures at the top, with the low volume we have, are quite difficult to figure out (Yogi probably had a saying for that …).
After my analysis this weekend, it’s now clear that we had a corrective wave down on Friday across the US indices (the issues with Friday’s wave structure are subtle, but supported up by similar corrective waves down in AAPL and FB, among others. They all require new highs). By the way, FB has rallied to a new high, which sets it up as a flat (just like the US indices).
Therefore, the market has not topped. We’re close, but not there yet. We have one more wave up — the fifth and final wave of an ending diagonal in the SP500. At the same time, expect an impulsive 5th wave up in futures (ES/NQ).
Other asset classes also have to reach their final targets at the same time.
Back to Yogi: He came up with the phrase, “It Ain’t Over ‘Til It’s Over” during the 1973 National League pennant race, and it’s been in our lexicon ever since. It certainly fits what we’re going through with this never-ending market.
Here are some other “yogiisms“:
- Always go to other people’s funerals; otherwise they won’t go to yours
- When You Come to a Fork in the Road, Take It!
- I knew the record would stand until it was broken.
- He’s learning me all of his experience.
- I looked like this when I was young, and I still do.
- If the world were perfect, it wouldn’t be.
- If you can’t imitate him, don’t copy him.
- If you don’t know where you’re going, you might not get there.
Thank you for making this day necessary (that’s another one)!
__________________________________
Here’s the latest market sentiment level from the CNN fear and greed index:
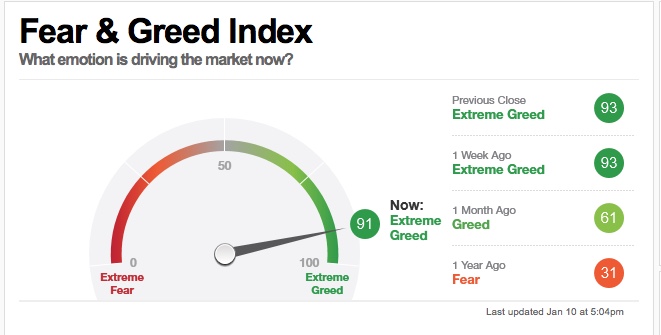
Sentiment two weeks ago actually hit 97, which is the highest level I’ve ever seen on this index. That signifies that everyone’s pretty much “in” the market and feeling very good about they money they’ve made — an excellent foreshadowing of a top. It’s back down to 91 this weekend, but I think we’re going to see it spike up before this monster rally is over!
This weekend, we’re even closer than last weekend. We have ending diagonals formed in NYSE, SP500, the DOW, SPY, and the Russell 3000.
I expect all the asset classes I cover to turn at about the same time. After that happens, we’re likely going to get what will be referred to as a “flash crash.” Everything is going to drop in tandem and that can only mean it will be a spectacular show (as opposed to the tentative waves down we saw on Friday).
Getting all these assets to top at the same time is like herding cats. We’ve never seen anything like this set-up before — with a huge, expanded flat in most US indices, it should follow the prescribed pattern … with a dramatic C wave down to under 2100 for ES/SPX.
Know the Past. See the Future
____________________________
Elliott Wave Basics
Here is a page dedicated to a relatively basic description of the Elliott Wave Principle. You’ll also find a link to the book by Bob Prechter and A. J. Frost.
______________________________
Rise above the rest … SM 2
Rise above the rest …I have only ever met a few people who, in their chosen fields (astrology, medicine, music, martial arts, technical analysis), rise above all the rest and you are one of them…you have ‘the gift’…and that’s why I’m a Trader’s Gold member. —SM |
Tops in your field DZ 2
Tops in your field …You are tops in your field. Tried to follow Elliot Wave international for years. They were always behind the market. After discovering you, I perceive that you are an expert in reading the waves, which puts you way ahead of the rest of your peers. And you can read the Waves like you are reading tomorrow’s financial section. I pray you stay healthy. —DZ |
Couldn’t be happier … KK 2
Couldn’t be happier …The analysis and insight you provide is simply amazing! I’ve been trading the futures and equity markets for well over thirty years and usually average around 5% monthly. Since joining your Traders Gold Service two months ago, that number has better than doubled. I couldn’t be happier.—KK |
Get an upper hand … JC 2
Get an upper hand in trading …Seeing all the different currency pairs and the wave structures and hearing you explain why this has to do that on a nightly bases gives one a upper hand when trading. Elliott Wave applies to all stock and indices and can be applied to any candlestick chart. If someone ask what you want for Christmas – Tell them a membership to Peter’s “Traders Gold!”—JC |
Have not had a losing week RW 2
Have not had a losing week …I have been with Peter almost a year. The only thing that matters is have I made money with his service. I think I have finally turned the corner using Peter’s EW. I have not had a losing week in the last 5 months. Thanks Peter, for your amazing amount of hard work. —RW |
the real deal SM 2
The real deal …‘Educational, insightful and thorough market analysis for all levels of traders. It’s Elliott Wave at its best….Peter Temple is the real deal’ —SM |
A true expert in Elliott Wave FL 2
A true expert in Elliott Wave …You are a true expert in EW analysis. What you provide is not available anywhere and is priceless. Subscription on your services is the best thing I have ever done. Many thanks for your effort to make me a better investor. I now have more trust in my investment decisions. I hope you will continue the excellent work! —FL |
The best of them JL 2
The best of them …Last couple of years, I subscribed to several ‘market traders’. You are by far the best of them and the personal contact is awesome. Daily and daily updates are very well written! Besides your expertise in EW, I also like your cycles analysis. Best investment I ever made! —JL |
US Market Snapshot (based on end-of-week wave structure)
This chart is posted to provide a prediction of future market direction. DO NOT trade based upon the information presented here (certainly NOT from a daily chart).
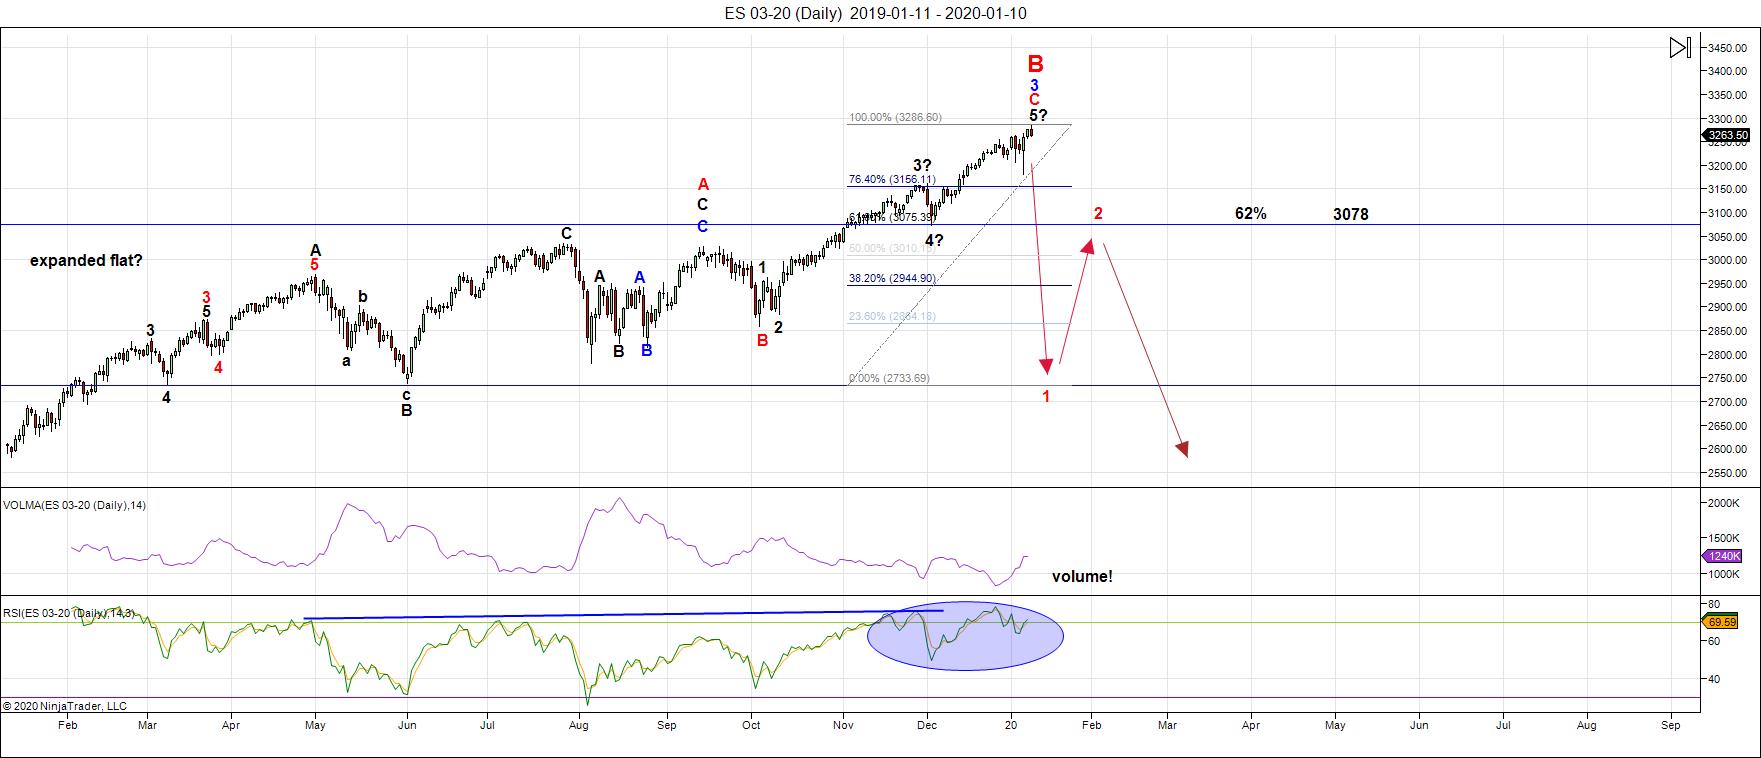
Above is the daily chart of ES (click to enlarge, as with any of my charts).
A little more patience is needed, but not very much. I'm seeing ending diagonals in most of the major US indices. Ending diagonals are final wave patterns. The final high will result in a trend change. There is only final subwave left to go, which I would expect to top before this next week is over.
However, futures have different patterns; they seem to be completing impulsive final fifth waves. It's made analysis of the US equities market a little bit tricky. However, this weekend, there's a fair amount of clarity to the market overall.
All asset classes I cover daily (gold, oil, USD currency pairs, and US equity indices) look like they're all going to top at the same time. They all have one more subwave left to trace out.
On an hourly scale, e-mini futures (eg. - NQ, ES) are tracing out a final, five wave impulsive wave to a new high. We have a final small fifth wave up to a final high to go.
The turn is nigh (DAX may have already topped, but with a large gap down from the top, it's impossible to say for sure). This will be a trend change across all major asset classes and many international exchanges.
The larger, overall pattern across all US indices is a flat. That strongly suggests we're going to see a 5 wave pattern to the downside under the 2100 level in ES, as I've been predicting.
_______________________
There is an option of a set of zigzags down to the same level, but it's much less probable because there are so many flats set up across multiple stocks and indices. If a zigzag is the pattern that traces out, the retraces up will not be as strong as they would be with the C wave of a flat. We'll get a lot of information about the probable path from the first wave down.
___________________________
Summary: The current B wave up is most probably the B wave of an expanded flat. The A wave ended on Jan. 26, 2018. The B wave up will end in a set of corrective subwaves. A trend change is imminent.
This weekend, we're on the cusp of turning into of a final fifth subwave leading to a major trend change. We're going to drop from the top into a large fourth wave. Look for the ultimate bottom to be somewhere under 2100 in ES.
Once we've completed the fourth wave down, we'll have a long climb to a final slight new high in a fifth wave of this 500 year cycle top.
___________________________
Trader's Gold Subscribers get a comprehensive view of the market, including hourly (and even smaller timeframes, when appropriate) on a daily basis. They also receive updates through the comments area. I provide only the daily timeframe for the free blog, as a "snapshot" of where the market currently trades and the next move on a weekly basis.
I do a nightly video on the US indices, USD Index (and related currency pairs), gold, silver, and oil).
______________________________________
Sign up for: The Chart Show
Next Date: Wednesday, January 22 at 5:00 pm EST (US market time)

The Chart Show is a one hour webinar in which Peter Temple provides the Elliott Wave analysis in real time for the US market, gold, silver, oil, major USD currency pairs, and more. You won't find a more accurate or comprehensive market prediction anywhere for this price.
Get caught up on the market from an Elliott Wave perspective. There’ll be a Q&A session during and at the end of the webinar and the possibility (depending on time) of taking requests.
For more information and to sign up, click here.
| "I think you are the only Elliot Wave technician on the planet who knows what he's doing.” |
| m.d. (professional trader) |
All registrants will receive the video playback of the webinar, so even if you miss it, you’ll be sent the full video replay within about an hour of its conclusion.


