
We’re headed for a long period of spiralling delation …
Inflation, according to Ludwig von Mises, is an increase in the money supply that is not offset by an increase in the need for money. It causes the value of money to decrease, which causes price increases for goods and services.
A good example of this is the current housing bubble in Canada created by next to free credit. Mortgage interest rates have never been lower and the prices of houses have never been higher.
Lets look at how we cause inflation.
Banks create money out of thin air. In actual fact, they create debt. They do this through loans. In other words, money comes into the system when banks create a loan. They simply enter the loan amount as debt in their books and you, the customer get borrowed money on the other side of the ledger. A digital entry appears in your bank account.
You pay interest on that money and both interest and the debt, when paid, go back to the bank. In any event, it’s newly “minted” (today, it’s mostly digital) money that the banks create out of thin air and then charge you for its use.
When interest rates are really low, people borrow more and bid up the price of homes. People see it as an inexpensive way to buy the home of their dreams.
Lets look “under the hood.” This increase in money in the market causes the value of money to decrease. We realize that lower value through higher prices for assets. The good thing is that as long as the inflation keeps up, you’re paying back that loan in future money, which is gradually decreasing in value. Inflation makes is easier to pay back debt (and that’s why governments like to inflate and amass large amounts of debt).
Below is a chart of the American dollar and how inflation has reduced its value by 96% over the past century.
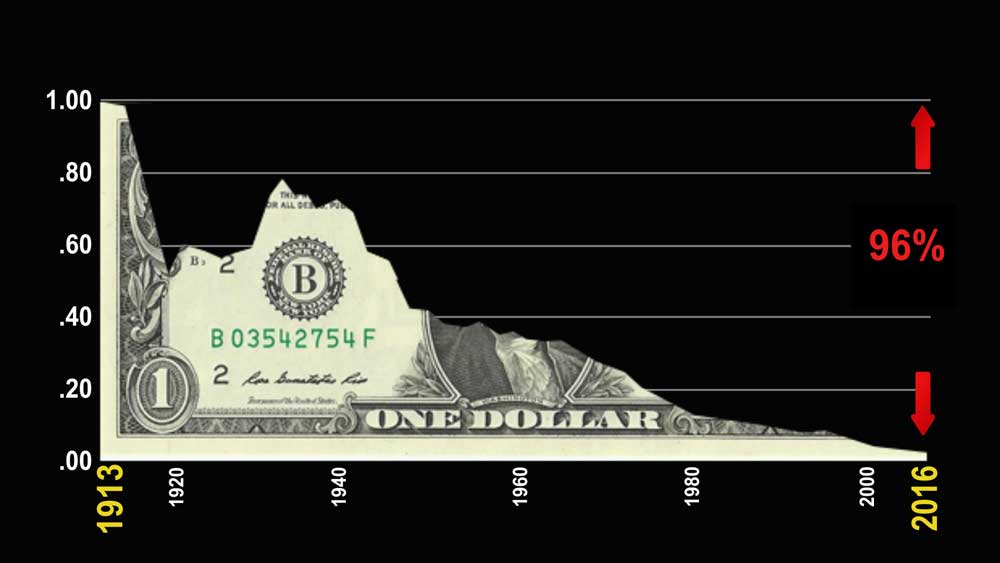
In the chart above, you can see how inflation can been fairly consistent except for the period from about 1920 to 1936 and again around 1940.
Deflation is the opposite of inflation. In deflation, particularly in credit-based economy, which is what we have, there’s a loss of confidence in the bubble that’s been created, and a slowdown in lending (which has been an ongoing problem since 2007). This leads to less money in circulation and people start spending less and hoarding money (Europeans are somewhat ahead of the North American continent right now in this regard). The reduction in consumer spending leads to job losses, eventually company failures, even lower prices, and we end up in a deflationary spiral.
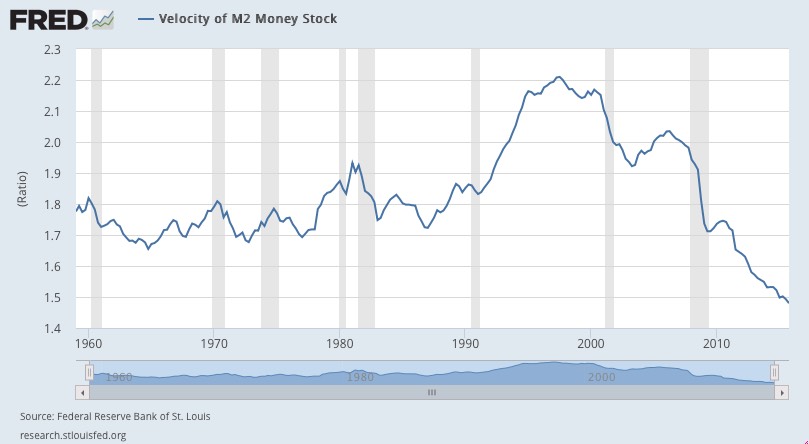
Above is a chart of the velocity of money. It comes from the Federal Reserve. This is a measure of the levels of currency available in society at a given time. You can see how the velocity of money has declined since about 1998. Incidentally, that was the warmest year on record, which I explain in by post: “Don’t Like the Climate? Wait a Cycle.” A reduction in the velocity of money marks the onset of deflation.
Lower prices for goods and services is great for consumers who have cash. But if you have lots of debt, that’s a problem. Because the real value of debt increases—less money in the system increases the value of money. So, you’re paying back those loans with money that is more costly to obtain (and is actually worth more) than when you took out the loan.
Assets like houses and cars reduce in value. The deflationary cycle in a depression picks up steam until we have a deflationary spiral that historically has reduced prices by up to 80%.
Almost all recessions and depressions in the US throughout history have been accompanied by various levels of deflation. Here are some key examples:
United States Examples of Depressions Fueled by Inflation (Ending in Deflation)
Downturn of 1819
- Inflation caused gold and silver to rise in value and along with that was an overall lack of confidence in the economy
- The price of cotton halved (the economic driver in those days) – example of deflation of an asset
- Rapidly growing credit eventually led to banks collapsing due to an overload of debt and a general economic collapse
Panic of 1837 (began in 1835)
- This was the era of substantial frontier land speculation due to easy credit
- Andrew Jackson suddenly tied bank notes to gold and silver (deflationary)
- The resulting run of bank gold and silver created a credit contraction
Downturn of 1857
- We didn’t learn the lesson in 1837—massive land speculation after 1852 reared its ugly head again
- This fueled rapid growth and speculation in railroads (easy credit)
- It resulted in major bank failures and credit contraction (deflation)
Downturn of 1873
- Chicago land values increased 500% from 1862
- Railroad expansion across the West created heavy levels of debt
- Led to a sudden stock market collapse and credit freeze, failed banks (deflation)
Downturn of 1893
- Again, substantial land speculation from an ongoing westward land boom
- It ended in a run on banks due to a sudden contraction in credit (deflation)
Great Depression of 1933
- The stock market crash began in 1929
- The depression really began with the collapse of real estate prices (1930)
- There had been wild real estate speculation during the 1920s (similar to today)
- In the 1920s, income of the wealthiest rose 75%, while the rest rose only 9%
- Deflation ran rampant from 1920 – 1936 dropping prices of real estate and the stock market by more than 85%
Recession of 1974
- The highlight of this contraction was the collapse of the US National Bank of San Diego
- Land speculation again had been the norm during the early 70s and this led to extreme levels of debt
- We experience mild deflation before Nixon unpegged the US dollar from gold (fiat money), which led to an enhanced level of inflation
Great Recession of 2007
- Sub-prime mortgages, derivatives, and banking failures.
- Extreme real estate speculation in the US. This led to even more extreme levels of debt. Between then and now, not much has changed. Our level of debt has increased, the gap between poor and wealthy is even greater, and the interest rates are so low that money is almost free, which has led to a real estate and stock market bubble.
- Since then, central banks have attempted to inflate the economy but have been unsuccessful
History tells us the road is fairly clear regarding the immediate future: Free money leads to a bubble, which leads to deflation and a depression. When a deflationary environment takes hold, gold is reduced in value. Gold will regain its value and start to increase when we return to an inflationary environment sometime down the road.
In the meantime:
Cash is king. Currency goes up in value, while prices for just about everything that’s not a necessity, go down in value. Food is a notable exception. At the same time we have a major economic collapse, we also have a major worldwide drought. This raises the scarcity of food. Expect banks to stop lending and for the current credit card scheme to end. It’s a good idea to have cash on hand in a safe place just in case banks start to fail, as they have so often in the past.
Get out of debt, because interest rates are going up. They may not go up immediately, but governments are in debt. The only way they have of solving that problem is to tax the population. Banks, if they run into problems, will raise interest rates. They’ll also start to limit credit and call in loans.
If it makes sense, sell your home and buy it back in a few years at a fraction of the current selling price. In the 1930s, homes devalued by over 80% very quickly. Many homes previously owned by the fabulously wealthy or well-to-do (who has lost everything is the stock market crash) were on the market for fire sale prices. We expect to see this scenario once again. During deflation, all assets drop dramatically in price. You can already see this in the price of oil.
Hold off on major purchases … because things are going to get a lot cheaper. As people stop buying, products go down in value. Double this with the fact that currency is going up in value and you have lower priced services and products.
Traditional investment is dead. Markets have already topped. Lower demand right across the board will lower the price of most products and services. As a result, more and more companies will land on hard times. Most bonds are also vulnerable. We’ve already heard of major cities going bankrupt. If you read your history, you’ll know that no investment is safe during a major collapse. That’s why cash is king.
Community is exceptionally important. Mend any broken relationships with family and friends. You’re going to need them. Have services that you can offer to others, to make yourself a more valuable commodity.
In reality, deflation is cathartic, and a necessary condition to heal the economy.
These are only some of the strategies you can use to defend your wealth and sure your viability during an major downturn. I hope it provides a sense of what’s to come.
So don’t get fooled by the idea that inflation is a good thing. It’s ruined the world economy. We’re awash in debt. Thank you politicians and bankers!
Deflation is good .. if you’re prepared. The train is just leaving the station …. It’s time to do some research and get ready to buck the trend.
Governments, Debt, and Banksters
The current situation with our economy is not unlike many of the previous collapses in history. But what makes this particularly scary is that we’ve created a debt bubble larger than any in history. See the recent article on Zerohedge entitled ” … Global Debt Hits a Record $152 Trillion …”
What exacerbates the problem is that sovereign debt, by and large, is owed to private banksters in Europe (or in the case of the US, to twelve private banks in the US packaged into something inappropriately named “The Federal Reserve.” It’s not federal (it’s privately owned) and it keeps no money in reserve).
These central banks create money out of thin air and then charge governments for its use. Creating money is something the government could do on its own and there would be no interest, and of course, no debt. This is something I explained in my post last week: The Wonderful Wizard of Oz.
The Market this Weekend
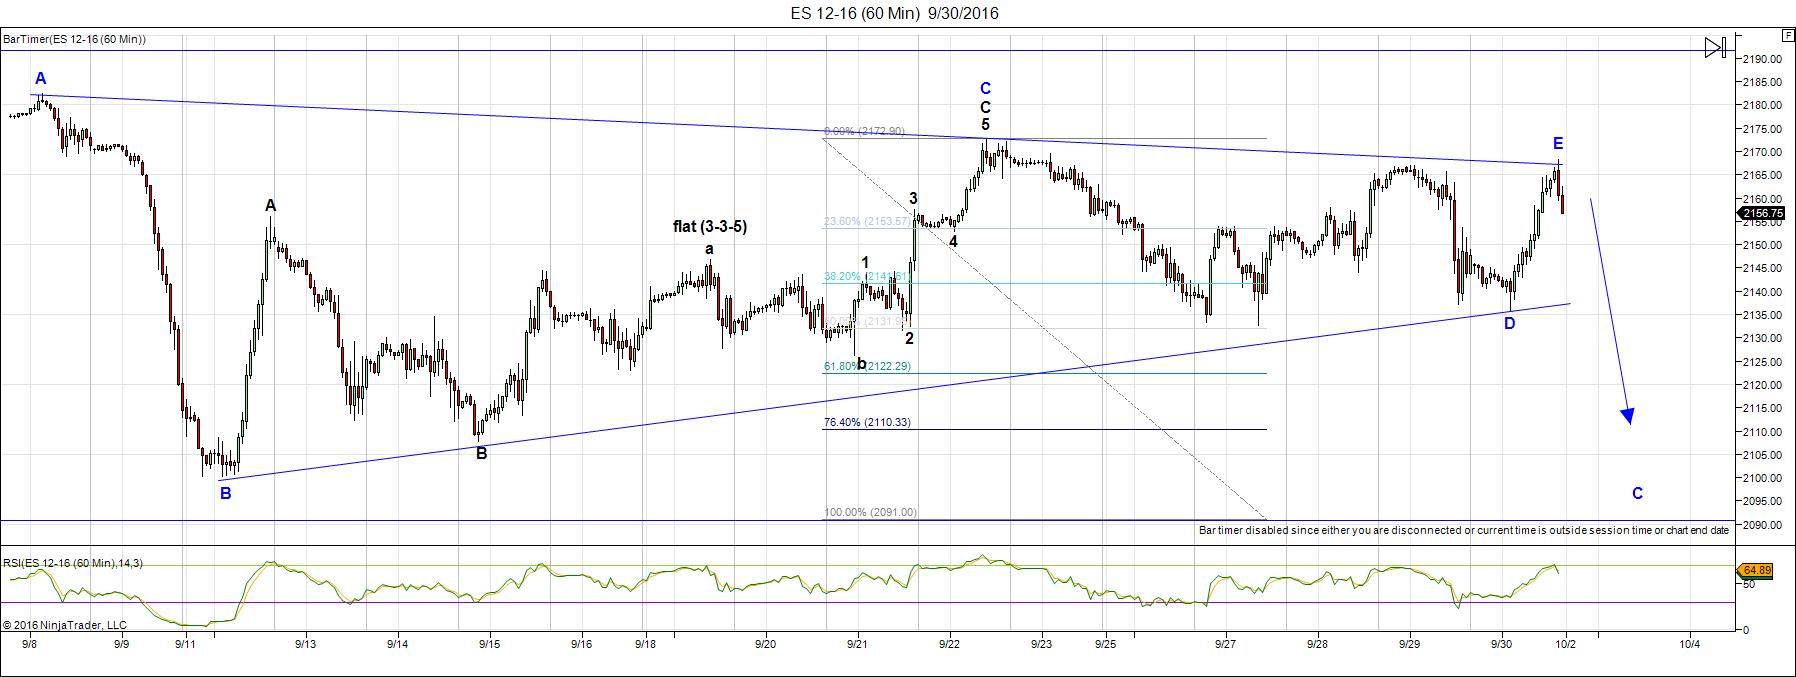
Again this week there isn’t all that much new in the markets. I’ve been predicting the continuation of the fourth wave of the ending diagonal for several weeks now. I’m still looking for a new low.
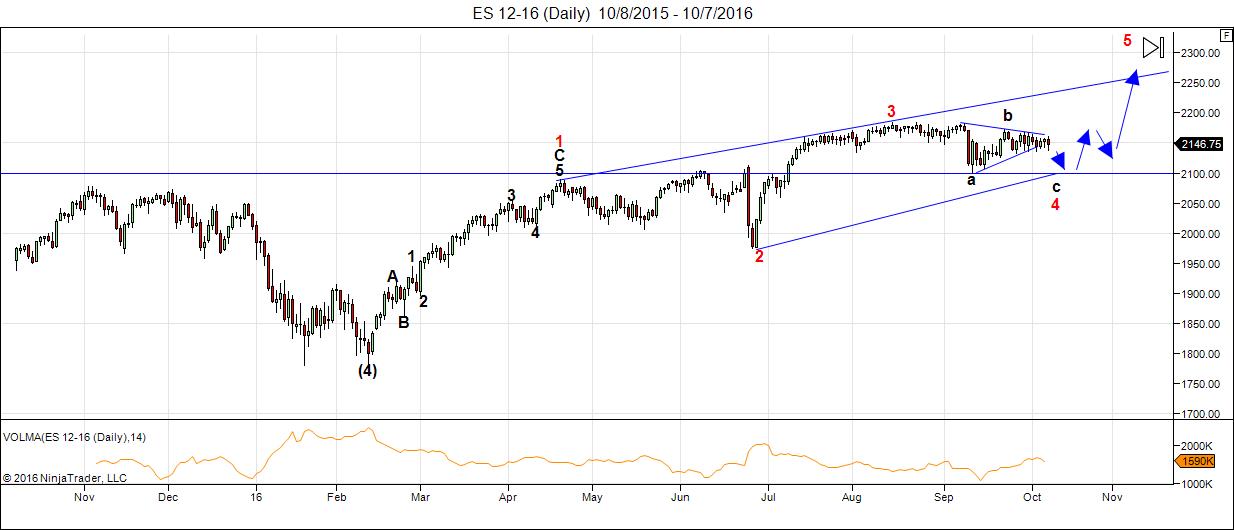
Above is the daily chart of ES (emini SPX futures). We’ve been in this fourth wave of the ending diagonal for 8 weeks. The second wave took 2 months plus a week, so the fourth wave should be nearing an end.
Usually the second and fourth waves in motive waves will be of similar magnitude (the fourth wave a bit longer) but in an ending diagonal, the waves get smaller as they move towards the termination, which is a fifth wave up to a new high, with a “throw-over” above the upper trendline. Expect the fourth wave to be slightly shorter in time.
Ending diagonals are triangles but they’re also part of motive waves. In fact, they’re the only triangle fitting under the banner of motive waves (as opposed to corrective waves). Ending diagonals are always the ending wave of the pattern.
I expect a gradual drop to about the 2100 area before a turn up in the final wave of the pattern.
Summary: This is the final fourth wave dip before the final fifth wave and the top of the largest bubble in history. I expect a little more downside before we turn up again to head for a new all time high.
___________________________
FREE This Week!: The Chart Show
Thursday, October 13.
 The Chart Show is a one hour webinar in which Peter Temple provides the Elliott Wave analysis for the US market, gold, silver, oil, and major USD currency pairs.
Get caught up on the market from an Elliott Wave perspective. You’ll also get Andy Pancholi turn dates for the balance of the current month. There’ll be a Q&A session during and at the end of the webinar and the possibility (depending on time) of taking requests.
All registrants will receive the video playback of the webinar, so even if you miss it, you’ll be sent the full video replay within about an hour of its conclusion. For more information and to sign up, click here.


adv dec is improving and tick went above 0
if we bottomed this should be it .
if we break down further ? im done with looking for a low
slightly long setting a buy stop for entry
sell stop set at today’s low
this market is extremely weak despite the improving fundamentals
sorry peter just keeping focused
if your correct on your wave count is fair to assume today fits the parameters
for a low ? i m beginning to see lower targets
obviously the risks im taking are my own
Joe
took myself out and re bought the new low
and this is my last attempt today
no need to kill myself
Joe
stop now goes 1 point below todays low
and if stopped out im done
So if this is a EW(4) C leg we know there are 3 targets.
1. .682 of the A leg
2. 100 of the A leg
3. 1.618 of the A leg
If A Leg is 2194 to 2119 = 75 pts
So top of B leg 2180
1.SPX 2180 -51= 2129
2. SPX 2180 – 75 = 2105
3. SPX 2180 – 121 = 2059
Are the possible target..
If 2059 is broken hard then wave 3 will be confirmed and the correction is under way and 1750 will be the target..
done for the day
ill see the wave count after the close .
getting mixed signals on this rally .
we don’t have 5 up yet it looks constructive .
Joe
we may have 5 waves up 🙂
im still done for the day .
i feel like i went into this morning abit cocky
and im glad to have survived so i consider it a blessing
and will stop trading
math correction
sept 22 close 18392.46
sept 26 close 18094.83
thats 297.63 pts
oct 10 close 18329.04
minus 297.63 pts = 18031.41
any close near here is all i expect
yet close to close would have been yesterday in terms of time .
print prices ( daily bars ) counts today .
the 17950 price level correlates also with print prices ( actual intraday )
so overall i view today as constructive.
tomorrow will be important and that is why i closed my trade
id rather give myself time to evaluate the market with an open
un biased opinion which means no positions .
which a longer term bearish mindset into January
and a shorter term bullish bias into Oct 20-24th
at some point i must begin accepting this market is going lower .
buying lows is painful in a downtrend and im happy im surviving it .
today is the closest thing ive seen to a 5 wave move up .
yet that alone does not prove the market is going higher to me .
tomorrow will need to see the market run further to the upside and back
above 18150
a simple test of the 19193 level would be just a re test of the previous 4th
wave of 1 lesser degree . this makes the
18191-18211 price range the important resistance .
that is rough yet it is we yesterdays swing high was that i considered a wave 4 .
no proof to me we have made any sustainable bottom .
that said i have a bullish bias into oct 20-24th .
the wave count will prove itself soon enough .
back to work i have sheet rock to get in place .
Joe
One of the things I have done to help me get the direction right when day trading is set a 5min chart with 3 EMA’s – 8-13-21 never go long if the 8 is under the 21or reverse for short. On a reversal the candle stick will break above/below the EMA’s dragging the shorter term above/below the longer term. After that when the pull back into the EMA happens that is a good entry point on the next candle stick if it resumes the direction of the breakout/breakdown. Also open a 1min chart with a 21 and 34 EMA and watch for the Ema’s to cross for verification. Not trading advise just what has worked for me…
I have a few other tricks with Stochastic s just not sure how many people use that oscillator.. 14,3,3 can be misleading sometimes..
I use Stochastics all the time….would love to know the ingredients of your secret sauce…..
Harvey
Harvey,
Set a slow Stochastic to 34-5-13
it works really well for intraday trades on the 1 and 5 min chart..
Thanks Jody…I’ll try it…
Harvey
K index of geomagnetics has risen last few hours Thursday. This ambient energy may result in some big move tomorrow Friday. I am guessing up 1% tomorrow.
Good call, although I was out last night and completely missed it! Brilliant on your part.
Thanks, Peter! K index has subsided today and my projection of 1% up move was squelched = (.
It could go up tomorrow. Usually though when it punches through prior support it pops back up to regathering strength to blast through it on the next try.. if it fails then you get a double bottom and then I would anticipate a big bounce but we have to retest the low today. When you fill the gap as we did today 15% chance you go higher after the gap is filled. Vix is saying there is a big leg down coming before a bounce up for a lower high.. either way just glad we are getting action and it will be interesting to see how it plays out.
666 is the number of the beast. 6x6x6=216. This is the number of bones in your body. We were not created by god but by the beast. That is why we are bad 😉
The 216 day cycle is connected to 144 and thus to the speed of light.
It is also part of the earth-venus cycle. 10/17 very strong vibration.
Wow! Was not expecting that!
Our carbon based bodies with 6 protons, 6 electrons and atomic number 6 is a prison for our spirit and soul. One day this prison will be transformed into a glorified diamond based body that will radiate the light and love of our heavenly father.
Tom,
I was only joking. My only point was the significance of 216 or 6x6x6. Nice to see you confirm this. No insult intended.
Hi Tom, I am glad you are back. I have a few questions on this matter. Can you sent me your email adress please to giupepe28@gmail.com ?
Thanks Tom!!!
Interesting Andre. 432 / 2 = 216.
432 is also linked to Uranus. 1 Uranus orbit is 30680days / 432 = 71.
BTW, I love your work.
“How art thou fallen from heaven, O Lucifer, son of the morning!
Venus is the morning star. See above.
Clinton: From the Wall Street Journal, no less: http://www.wsj.com/articles/the-press-buries-hillary-clintons-sins-1476401308
Next week monday we start with a bang lower, I think the next 3 weeks will be a circus with big moves down.
I have got 3 important bottom dates Oktober 23 and 28 and the last low November 8.
I m gonna buy the dip in November.
Hi John,
This seems like a likely pattern. Maybe the Intl. market (X US equities) will benefit.
Hi Valley,
It will be interesting to watch how Europe will react when SP futures are way down on Monday.
But maybe the establishment can rig them again ,Trump will do everything to win the elections.
Things are really heating up right now and if new scandels will hit the fan the markets will react.
The latest video from Trump :
https://www.youtube.com/watch?v=mxjLuvR0338
Caveat to sellers is next week is pre October 31 very bullish seasonals, earnings reports week, and moon is entering north declination zone which often has “freak” up moves. Nothing else I can see that is positive (post FM, falling tides, post Perigee and of course the pre election uncertainty).
Fully a gree with you Valley. The surprise , will be to the upside. Looking for a min 2189 sp to clear out the bears before we finally have a good dump into Dec – jan. Good luck every one.
New post live: https://worldcyclesinstitute.com/traversing-the-cusp/
This website is for educational purposes relating to Elliott Wave, natural cycles, and the Quantum Revolution (Great Awakening). I welcome questions or comments about any of these subjects. Due to a heavy schedule, I may not have the time to answer questions that relate to my area of expertise.
I reserve the right to remove any comment that is deemed negative, is unhelpful, or off-topic. Such comments may be removed.
Want to comment? You need to be logged in to comment. You can register here.