
Setting Up for a Lucrative Trade
Last week, I talked about the “right look” of motive waves. These are waves comprised of five subwaves. At the end of five waves, they have to retrace either 62% (corrective second wave) or 38% (corrective fourth wave) and then start another motive wave of 5 in the same direction as the first one. Motive waves have very strict rules about length and structure.
Even more important to a trader is the ability to identify corrective waves (because they’re more common). Corrective waves have few rules and therefore it’s more important to rely on wavelengths, although the reliability is not always there, so it takes much more care to predict turns accurately.
The best way to determine an end point is the extend from the A wave. Usually the C wave will have a fibonacci relationship to the A wave (equal to or 1.618 X the A wave). Corrective waves come in threes and when they retrace, depending upon the situation, they retrace completely. A case in point is gold.

On the left is the daily chart of gold that I displayed on April 16, and noted that a turn was imminent (click to enlarge). The reason for the call was that the waves up from ~1124 were in 3’s. It could not have been more evident to me, although there were many analysts and pundits called for gold to keep on going and going and going.
In fact, there were two sets of three waves. The lower case yellow abc up from 1124 and the uppercase yellow “three.” Measuring the length of the a wave and extending the fibonacci extension to 1.618 foreshadowed a turn in the near future.
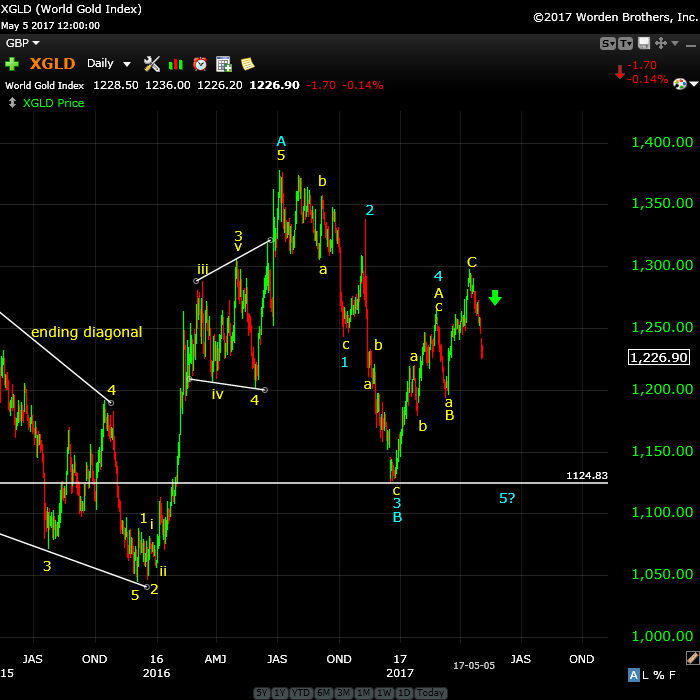
On the left is today’s daily chart (May 7) of gold showing the top of the bullish ABC wave on April 17. Gold turned and then moved down tentatively at first (it displayed what looked like three waves down). So, for the first week or so, it was difficult to tell whether we would retrace to a double top, or continue down. A waves are very difficult to predict the length of until you have enough information. That was the case here.
However, it eventually dropped (silver was a good indicator that it would, since silver has dropped like a stone relative to gold) and the prognosis is for a continued drop, likely to about 1200 before a bounce. Gold should retrace the entire three wave bullish move up from 1124. It will do this in either three waves or five.
Silver is moving parallel to gold, but silver is much weaker and I’m projecting an eventual drop to the 15.60 area.
The real key to Elliott waves is being able to recognize patterns, but more importantly, the ability to decipher a three wave move as opposed to five waves and understanding the rules and guidelines around them. It provides much more confidence in predicting market moves and I have yet to find it break a rule.
Good trading.
The best of them JL 2
The best of them …Last couple of years, I subscribed to several ‘market traders’. You are by far the best of them and the personal contact is awesome. Daily and daily updates are very well written! Besides your expertise in EW, I also like your cycles analysis. Best investment I ever made! —JL |
Get an upper hand … JC 2
Get an upper hand in trading …Seeing all the different currency pairs and the wave structures and hearing you explain why this has to do that on a nightly bases gives one a upper hand when trading. Elliott Wave applies to all stock and indices and can be applied to any candlestick chart. If someone ask what you want for Christmas – Tell them a membership to Peter’s “Traders Gold!”—JC |
Couldn’t be happier … KK 2
Couldn’t be happier …The analysis and insight you provide is simply amazing! I’ve been trading the futures and equity markets for well over thirty years and usually average around 5% monthly. Since joining your Traders Gold Service two months ago, that number has better than doubled. I couldn’t be happier.—KK |
Have not had a losing week RW 2
Have not had a losing week …I have been with Peter almost a year. The only thing that matters is have I made money with his service. I think I have finally turned the corner using Peter’s EW. I have not had a losing week in the last 5 months. Thanks Peter, for your amazing amount of hard work. —RW |
Tops in your field DZ 2
Tops in your field …You are tops in your field. Tried to follow Elliot Wave international for years. They were always behind the market. After discovering you, I perceive that you are an expert in reading the waves, which puts you way ahead of the rest of your peers. And you can read the Waves like you are reading tomorrow’s financial section. I pray you stay healthy. —DZ |
the real deal SM 2
The real deal …‘Educational, insightful and thorough market analysis for all levels of traders. It’s Elliott Wave at its best….Peter Temple is the real deal’ —SM |
A true expert in Elliott Wave FL 2
A true expert in Elliott Wave …You are a true expert in EW analysis. What you provide is not available anywhere and is priceless. Subscription on your services is the best thing I have ever done. Many thanks for your effort to make me a better investor. I now have more trust in my investment decisions. I hope you will continue the excellent work! —FL |
Rise above the rest … SM 2
Rise above the rest …I have only ever met a few people who, in their chosen fields (astrology, medicine, music, martial arts, technical analysis), rise above all the rest and you are one of them…you have ‘the gift’…and that’s why I’m a Trader’s Gold member. —SM |
The Market This Week
A most difficult market to decipher. This is not a normal structure for an ending 5th wave; it's a corrective structure, which we've never seen before in an ending set of waves. There are really no first, second, third, fourth, or fifth waves of this large third wave—they're all zigzags (a lot tougher to decipher), but there can only be three at most.
I've relabelled the charts to show a third zigzag of a combination wave in progress for ES (this meant I had to change the count of the first zigzag to include what I initially thought was the second zigzag—my educated guess). So we have a third wave of three zigzags and I put us in the final one now.
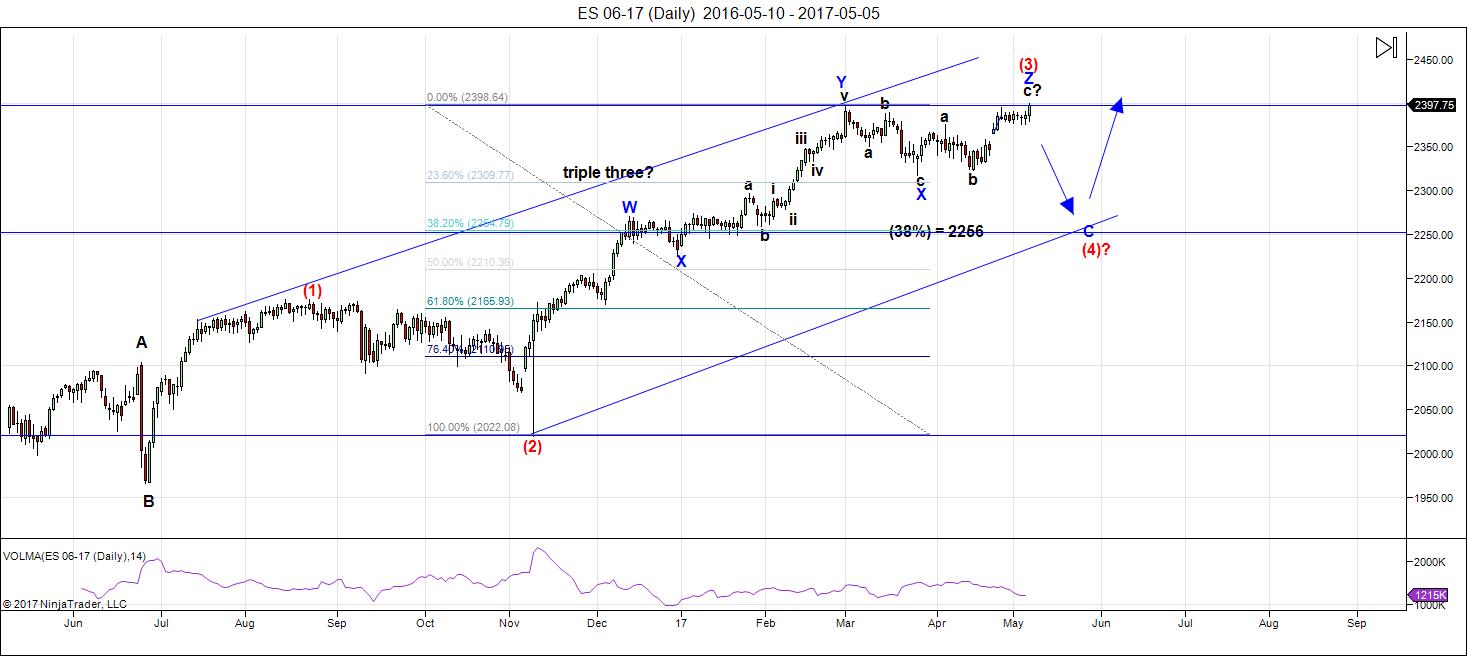
Above is the daily chart of ES (click to enlarge, as with any of my charts). On Friday, ES went to a slight new high. It was not confirmed by the SP500, nor by any of the other USD indices (NYSE, DOW, IWM, IWV, DOW Transports). So cash indices are still in a "fourth wave" (as of Friday). ES, however has gone to a new high in a zigzag and this can only be a continuation of the third wave. I think we still have a little ways to go before a turn down. I'm projecting a probable top of ES at 2410-15.
Since ES went to a new high on Friday at the end of the day, I suspect the cash indices will do the same (not necessarily all of them). However, the bullishness will likely be short-lived. Although I'm projecting a slight rise, overall the market looks extremely bearish.
Now, I could be surprised by an immediate downturn, but that's a lower probability outcome in my opinion, due to the new high by ES. It would be odd to have futures and cash in the same index with different counts. However, other indices sporting non-confirming counts is very bearish and suggests a top is near.
The projection for a top (numbers above) comes from measuring the a wave of the abc move up for 2322: If I measure the a wave, the C wave is 1.618 times the a wave at about 2415, A=C at about 2410. In a similar vein, the top for NQ should be about 5663 (we'll see how close we get).
Let's look at why the medium term looks so bearish:
- We still have not had a large enough fourth wave correction in price.
- In the chart above, you can see that volume has dropped off quite considerably. There are divergences in the RSI readings, as well.
- This final wave up in ES and SPX is in 3 waves (another zigzag). This is a corrective wave.
- NQ is finishing the fifth wave of the third wave. It requires a good-sized fourth wave once it reaches the top. ES and SPX will certainly correct when NQ correct. I project a top for NQ of about 5663.
After completing the larger fourth wave, we'll have one more wave to go, which could be an ending diagonal as a fifth wave. The long awaited bear market is getting closer.
______________________________________
Sign up for: The Chart Show
Thursday, May 11 at 2:00 pm EST (US market time)

The Chart Show is a one hour webinar in which Peter Temple provides the Elliott Wave analysis in real time for the US market, gold, silver, oil, major USD currency pairs, and more. You won't find a more accurate or comprehensive market prediction anywhere for this price.
Get caught up on the market from an Elliott Wave perspective. You’ll also get Andy Pancholi cycle turn dates for the balance of the current month. There’ll be a Q&A session during and at the end of the webinar and the possibility (depending on time) of taking requests.
All registrants will receive the video playback of the webinar, so even if you miss it, you’ll be sent the full video replay within about an hour of its conclusion. For more information and to sign up, click here.


I remember being a bit skeptical about your call for a complete Gold retrace several weeks ago on account of the three wave rise. It was enough to keep me from going “all-in” despite the almost universally bullish wave counts virtually every other analyst I read was touting. I am again hearing so many insist that ANY new high in SPX will necessarily confirm the start of the fifth wave up. I am sticking with your analysis Peter. Yes siree! 🙂
p.s When will we know if the current decline is three or a five?
If it is going to be a five, the implication is that we probably have not had a third wave down yet…!
Thanks for the new post!
I also think gold will have a 5 wave pattern retracement. However, my target low price is slightly higher at 1134.
Verne,
I obviously don’t understand the question, cause the answer is “when you see it.”
It is kind of an obtuse question now that you mention it. ☺
I don’t know how often I have read that an initial abc is indistinguishable from a 1,2,3. l guess I was wondering if there were other metrics of the decline like breadth, momentum, volume etc that might signal corrective vs impulsive.
“Know” was most certainly the ideal to pose the query I was after…lol!
“When we see it” is indeed the correct answer!
I am also assuming an impulse being five waves would travel farther than a three wave correction, assuming similar wave proportions for both the corrective and impulsive structure….I know…the answer is still the same! 🙂
Thanks Peter! Sorry I do not express my appreciation too often. But I really do by default, so please assume as such at all times 🙂
🙂 thks.
So for gold will it finish main wave 2. I dont know anything as some keep on daying wave 3 will start from dec
I mean to go up
Well Peter, this is it 🙂 now with Macron win and the strong close on Friday we have the final clash EW vs what everybody expects. Go EW! 😀
More Rothschild for a little while longer. I guess that fits … sigh.
Macron celebrating in front of the Louvre’s Pyramid (all seeing eye anyone?) reinforces my idea: they’re not even hiding it anymore. We’ve chosen slavery and fully earned all that’s about to come 🙁
I used to feel sorry for the Frogs, watchimg their nation and culture be destroyed before their very eyes. No longer.
We just witnessed the end of France because the voters there were too daft to prevent their own demise-suicidal nation!
w
whats amazing is this clown macron is an ex rothchild banker.
the cashless society in india is also started by rothchild.
REL JIO partnering with rothchild bankers
CALLED JIO money and paytm which is alibaba funded …again rothchilds
my god these guys are everywhere like a hydra
Peter
Here is a few observations .
I have battled with andre ( pleasantly i will admit since i love his passion and respect his work )
I have Battled with you a few times and also i feel it has been a passionate debate
between the 2 of us .
Yet today ???? we are on the same page . i have questioned the 2415 projection
on the es yet i see it very clearly . i also agree that something is a miss with this market which has kept me from really having a solid point of view .
now today you post your thoughts on gold . I have been watching both the XAU and the HUI and from time to time i do fundamental analysis on the gold stocks in both those indexes and i have been following a very broad longer term pattern
on both these indexes and i have also been following a very long term pattern
in regards to the silver gold ratio. Ill just say i agree with your view and your attention to detail is what brings me to this site .
No questions from me today .
I have also read from another guy and his name slips my mind at the moment
yet he has stated and i think it is worth the consideration that silver will out perform gold in bull markets . silver leads .
My wheat farmer friend told me corn leads wheat ( wheat follows corn )
My issue with gold and silver has always been simple. i have not seen
the completion of the silver gold ratio ( silver/gold or in my case SI #F/GC #F )
the ratio has not been completed . In the year 1991 the silver gold ratio hit 9
and i consider that the low ( in the ratio )
in 1996 it hit 12
in 2003 it hit 12
in late 2008 it hit 11
And that is the level based on the pattern im following that i needed
to see broken ( yet the XAU and HUI ) completed there patterns in late 2015
early 2016 .
the silver/gold ratio i guess i could say signals a bullish divergence yet
for the pattern to complete i need to see the ratio break below 11
i am expecting both the HUI and the XAU to hold their lows
and gold and silver on a ratio basis need to just poke below 11 .
id prefer a reading of 10 ( the 1991 low of 9 would be amazing to see )
For this to actually play out gold would need to hold relatively strong vs silver.
Looking at a very long term monthly chart .
this ratio hit 60 in march 1980 ( i know the print highs were january 1980 )
this ratio only hit 32 at its swing high in april 2011 .
that 32 level was in the middle of the .382 retrace at 28 and the 50 % retrace at 34. silver never hit a new all time high ( some may argue that )
bottom line silver while bottoming first in 1991 has continued to be weaker than gold.
For me the ratio needs to break below its oct 2008 low and coming out of it
silver will need to out perform gold . when i see that ratio finish its
target ill adopt a bullish stance on the gold and silver stocks and ill use
some form of fundamental analysis to pick which ones i purchase .
It is in my view that both the XAU and the HUI will go back above their respective all time highs once this pattern completes on the downside .
It a very long term point of view looking out years .
Xau will go above 233 and its now at 80 and change ( odd fib number high )
HUI will go above 639 and its now at 185-186 .
Looks like some sell the fact going on in the emini’s this afternoon .
Very good post peter
Thanks for input .
Joe
Futures gapped open to 2403.50 and reversed on the one minute chart. Quite a long upper wick. We could be looking at buy the rumor sell the news…..
Interesting interview
http://www.financialsensenewshour.com/broadcast/fsn2017-0506-2.mp3
Last month the US economy lost 44.000 jobs. They hope new start ups created 250.000 jobs – but they don’t know. And even it that is true it means the current economy is already in recession. If I were Trump; I’d be worried.
André
If you were Trump, you wouldn’t even know what recession means 😀
Most people do not realize that BLS birth/death number of 255K non-farm jobs created is an entirely made-up statistic. It escapes me how they are allowed to report fiction as fact, and it is even more amazing that people actually believe the bogus number. You are exactly right. In fact I recently mentioned the possibility to some one when I said we could in fact be “starting” are recession and I was corrected with the point being made that there has to be two consecutive quarters of negative GDP. These numbers are always backwards looking so clearly we enter a recession BEFORE it is reported, and of course this is why I specifically used the word “starting”. The FED may be crazy but they are not stupid. They will take back the rate hike and announce QE 5 after the next market correction in an absolute panic. In fact this is what I think will juice the market in the final wave up, as the knee-jerk lemmings pile in.
The more I think about the French elections, the more I am inclined to think that I may have judged the French voters too hastily. The EU after all, is run by a gang of international criminals and would stop at nothing to preserve the power and privileged positions. We saw them outright steal the Dutch elections, and who is to say they did do the same thing in France? I just cannot bring myself to believe the French are really that stupid and gullible. I could be wrong. Some may argue that the margin of victory was to large to suggest fraud. Maybe they learned something from the US elections and took no chances. It is reported that the Diebold voting machines in the US were programmed to give Trump 0.3 votes and Hillary 1.6, a trivial feat to accomplish with electronic machines. I am curious to know what percentage of the voting in France was by paper ballot.
Verne, I only see one problem: the anti-establishment leader is always a complete nutjob, and yes, I don’t think it’s random. To vote against Macron you had to vote for a neo-nazi party; to vote against Hillary you had to vote for Trump. Trump. I don’t know if you realize. Trump. Listen to him talk, he’s not fully developed in every sense of the way.
They’re basically making it impossible to vote against the establishment. In rare cases, when they fail (i.e. Trump), they quickly bring the fake-opposition puppet back to their senses. Trump already did the exact opposite of what he promised…do you think he “changed his mind”?
Before a candidate is a candidate they already have on him more skeletons than a normal human being can collect in 36 lives…
Trump has clearly been co-opted. He was probably stunned at the kind of info the dark state has on him. My mind about his integrity radically changed (not that I expect anyone to be perfect) when it came light what a piece of detritus his son-in-law is. Trump is not stupid. I understand that blood is thicker than water, But for him to put this cretin in the White House in any official displays and incredible level of recklessness and malfesance…period!
So far as the French are concerned the question of party affiliation is totally irrelevant to any thinking Frenchman, or it should have been. What was at steak was their national freedom and self-determination.
I have to say I do not accept the thesis that Le Pen is a clone of her father or necessarily represent the ideology of his era. The stakes were far higher.
Concern about party affiliation was to me like arguing about arranging deck chairs on the Titanic.
Of course I did not mean say “steak” as “in rib eye” but stake, as in “vampire killer”. Peter should put an edit feature in the comments software. I cannot believe the ridiculous mis-spelling errors I sometimes make. It is almost as if my fingers have a mind of their own! lol!
New high 2401.36 in SPX!
The end of this B wave should be nigh…
New high in NDX Composite, 6106.12. Looks like a five of wave three just about done.
Waiting on DJI…
Alex I am curious. How much do you know about the contents concerning Macron that have been exposed in those recently released e-mails?
Of course much of this material came out too late to have been learned by the voting French. I am curious to see how they are going react when they learn the kind of man they placed in the highest office in the land. I suspect that it will make little difference. Even without the explosive information in these documents, they had enough information to have avoided making a culturally and economically suicidal choice imho.
Basically he’s gay and bought crystal meth it’s all that came out lol…and some sorts of “soft islamization” as a way to prevent the hard one happening right now. Noone is really talking about it, nobody seems to care, wikileaks should learn the fine art of getting to the point before dumping terabytes of data with little to no relevant info in it…
I thought the off-shore accounts were far more interesting and of probative value. The French have repeatedly demonstrated that moral turpitude in their political leaders is of little interest to them, and that includes drug use and licentious behaviour. It almost seem as if some European leaders wear such things as a badge of honor. Remember Dominique Strauss-Kahn?
Yes Verne that’s the effect of being over-exposed to the same things everyday. If they leaked “he’s going to church every sunday, for real” he probably would have lost. We’re in the early days of the fall of the old empires, I’m afraid we’ve seen nothing so far, but people already feel / care for nothing…
Andre’s call for a high today appears to have been right o schedule. I am assuming a low tomorrow will be in initial impulse wave down lasting two days, followed be a second wave on Thursday.
Peter – Thank you so much for your posting. I like your idea about SPX moving down first. But regarding your gold, I really think it should move up to 5/15 High from now.
Does anyone believe the import-export bank, the exchange stabilization fund or the basket of SDR’s play a role in the market “stability”? Do the global elite utilize these mechanisms for control? If so then how can this market, no matter what indices you follow or what nation your are in, behave in a predictable pattern?
Jeff T
Rumor has it that one of the reasons Trump is going to Saudi Arabia is to try and atone for the Treasury’t theft of 3T of Saudi Arabia’s oil money, which they were supposed to be “managing” in the exchange stabilization fund. Recent public disclosure shows only 140 Billion of line item owed to the Saudis. I have not hear a word about this. At first it may seem that 3T is a lot to loose over 40 years, but considering all the schemes Treasury and the FED have been engaged in the past 8 years anything is possible. And don’t forget that bloated FED balance sheet. I guess the Saudis are so mad over being taken to the cleaners that they are seriously considering blowing up what is left of the Petro-Dollar by accepting payment for oil in Renminbi, so Trump has to go hat in hand to Riyadh. We are fast becoming the world’s laughing stock. If you never knew why so many US politicians are nothing but Saudi whores now you know why…
If it’s of any consolation I don’t think anyone is laughing at America…it’s more like terror at this point :/ …
Pete – what do you think of Old Mates theories.
https://www.youtube.com/watch?v=4OlbbTCzkT0
Red Dog
What is an old mates theory. btw, the guy in that video has really whacky counts. They break every rule in the book.
Thought so. Interest what you find.
It is starting to look to me like one heck of an expanded flat. The multi-decade low in VIX suggesting the impulse down for wave C should be a real doozy..
VIX historical lows
December 27, 1993 – 8.89…more than six years before the market peak
December 15, 2006 – 9.39…ten months before the market peak
May xx, 2017 – ?
Market peaks come and go. What would be really interesting is the depth of the correction following those historic lows.
Where’s luri, where’s liz, where’s Jody?! 🙂
Should be celebrating russian ww2 victory day
Busy with BIDU and kite from short then long then bye.
Just a reminder that a George Lindsay B-B-T count from 7-8-1932 low to 12-9-1974 low, arguably the 2 most important lows of past 100 years resolves forward to 5-11-2017. Expecting a major top within a week or so of that date would not be unreasonable. Dubious on efficacy of these long term counts? 2000 High in Dow was 4 trading days away from perfect 49 low to Oct ’74 low counted forward in calendar days and 5 days away from March 2000 high based on trading days… 🙂
http://www.safehaven.com/print/44341/may-8-11-high-or-low
Thanks Peter! Very interesting!
🙂
Tomorrow is full moon. Moon will rise after sunset and be smaller than most (apogee approaching), and further south than most (south declination approaching). Get out after dinner and see the sky. (Jupiter will rise before the moon and especially bright due to it being that earth still close to Jupiter in its orbit).
Post full moon, pre apogee, pre south declination triple bearish lunar so I bought a put today.
I have to watch the futures, no time for the sky (what a sad life lol…
Very important to soak up a few photons daily. things are bad enough with all the chem trails garbage….
Thanks Valley,
hope there will be no clouds tomorrow
I am trying to determine if there are better than even odds on some of the hi/low calls made on the forum recently. The call for a high yesterday was correct. Unless things change by the close, forecast of a low today will not be…
No spy puts for me. I need to see /ES 2403.75 during regular trading hours.
Don’t blame ya. This market simply refuses to decline. I am not conceding that the banksters can indefinitely forestall a reversion to the mean. I am long volatility.
Hard to imagine much lower levels than we are seeing.
I must be going blind. I only just noticed the change in labeling on Peter’s ES chart. Now everything makes perfect sense with the new high and all time volatility lows at the conclusion of a high degree third wave…DUH!! 🙂
Broken market metrics continue to be the theme du juor. I glanced at futures early this morning and saw nothing bu red; not down significantly but down. I looked at real time pre-market VIX and it was also red. What does it say about a market environment in which Declining prices results in Increasing complacency?
I guess it is akin to negative interest rates!
Verne
I view the vix as an expression of the price range .
Opition prices depreciate and with a % range in the spx pretty much flat
It makes sense that the vix falls with price
For the vix to rise we need to see the price range expand
That does make sense. If price is range bound obviously sharp traders are going to sell the highs of the range and buy the lows. Thanks Joe!
Lunar returns on both the 66 high as the 2000 high give 5/15. So chances are they will push it over the weekend. In that case Monday will be a very significant high with first low 5/18.
NVDA new all time high
my turn day is today May 11th .
the 10 day on mercury retrograde is may 13th .
The 5 day trin closed yesterday at 4.29
i prefer 4.00 yet i have seen 4.25 work plenty of times ( ill consider it an over bought reading )
10 day trin closed at 1.05 ( Not over bought as of yet )
a sell signal will be given once the 10 day trin closes below 1.00 and then
closes back above .
At a minimum it would require 2 trading days .
The 20 day oscillator is in my opinion still oversold ( No Typo )
Timing is bearish , Indicators a bit mixed
I favor a downward movement into may 18th but i cannot make a solid
bearish case
The 5 day and 10 advance decline lines gave a bullish signal yesterday.
Ill say cautiously bearish is about all i can commit to .
A better Trade can probably found elsewhere
Leaving the stock indexes alone today
SMH Looks extended
AEIS made a new all time high above its March 2000 High
Tech looks to be in a blow off phase yet hard to call it over
5/13 very strong vibration. I expect a black swan of some kind. North Korea? Donald Trump? Something will happen. And then we are down into jan 2018. This weekend will be remembered,
Interesting. I have felt like a complete fool the last weeks saying if what we have seen the last few months does not qualify as a blow-off top then I don’t know what is. The problem is all the good EW analysts have been insistently saying that we have one more wave up. I tend to get nervous when everyone is calling for the same thing. Then again we had those freaky historic lows in VIX, yet so many were insisting that the crowd was bearish. The banksters have done everything in their power to keep this market from correcting and so I came to the conclusion that what we we would eventually get is simply a crash. The extremes in this market are historic, the complacency is historic. The confidence I hear from virtually everyone that this or that has to happen BEFORE we get a final top….makes me wonder…!
Well, Verne,
As I keep saying, I’ve never seen EW fail and I’ve studied lots of charts from way, way back … there were charts even before I was born, which seems fairly amazing … since I thought everything started with me … haha.
I don’t think I’d want to be a contrarian when a lot of “good” EW analysts are calling for a fifth wave (there never has not been a fifth wave).
You’re right in that what we have here is a “blow-off” or sorts. It’s just not done yet.
A “crash” from an Elliott wave perspective doesn’t exist. It will seem like a crash, but it will come down in a set of waves that will be quite predictable and have fibonacci relationships that will be measurable, just like these waves.
From my version of “Ripley’s Believe it or Not”
Great points Peter. I have to say I have learned not to trade based on just my feelings, and I certainly pay close attention to what the TA is indicating. It could be that before that final move higher, we are going to get a taste of what is just ahead in the current move down. There is nonetheless, in my mind a real sense of dread when it comes to these bloated markets. There is no way I am going to ever be all in on the long side overnight this market. I think we are going to wake up one morning to find that all hell has broken loose… lol!
Remember, the top has to register during market hours, and after 5 waves down at small degree, there’s always a second wave up. So I’m not expecting that much of a surprise.
Yep. That’s exactly how I think it will play out. We will get a fourth wave down, everyone will think the sky (or spy) is falling, the analysts will tell you to sell everything at the bottom, then wham — 5th wave up.
Same scenario. We get to the top and the analysts call for it double, triple, etc… That’s when it falls hard.
FYI — today’s drop — TLT was not participating and JPY pairs did not make a drastic move. When I see them all going in tandem, I’ll believe it’s correcting, not just dipping.
They will probably try to fill the gap down from yesterday’s close at 2399.63 before we get going in earnest to the downside. The BTFD mentality is firmly ingrained in both the bots and the bulls so no surprise they are jumping on this first leg down. I suspect they will shortly be disabused of their unbridled optimism….
That move down this morning sure looks like a nice clean impulsive five down, with a second corrective move up now underway…
Hi André,
You wrote that 5/15 Monday will be a very significant high. Then maybe the strong vibration on 5/13 turns out to be a positive surprise instead of a black swan?
Monday will be a high supported by the vibration on Saturday. It is not just the vibration; is also that major cycles turn down. So I have a lot of reasons to expect a high next week and a significant one.
Thanks André (:
Tom’s one-month energy chart (4/26 – 5/22) was spot on catching the swoon this morning along with André’s 5/11 high and Valley’s triple bearish lunar comments. Plus, I didn’t take this short opportunity so the down move was unjinxed 😉
P,
Did I miss this chart ,I only have till may ?
Can you post it?
Thanks.
Found it… today was also a bradley day … and 19/5 too.
Here: https://s27.postimg.org/qtyq62kjn/april_26_to_May_22_energy_stream.gif
Thanks for responding ..
There seems to be some sort of sale 16, 17 & 18 and boom why are we suddenly up on the 19th? Because it is ___ lol. It would be hilarious if the zoom up happens at 3:59 edt friday.
Verne
A different market but….
I spent the last few days in Seattle. I drove through the area
i m very familiar with and grew up in and have had various houses
over the years . My brother sells real estate in the Seattle area
and we had several discussions about the real estate market .
From what i looked at and from what i know having bought and sold
houses in that area it looks saturated and is ripe for a Top.
Yet Try as i did to explain it to my brother from every angle or metric
i could see. He would say its going to keep rising . I don’t see it and
i wont be surprised when it turns down. For the past year houses
have been selling above the asking price and People are chasing the market
Trying to beat out everyone else. I have seen this twice before in my life time .
1988 and 2005. 1988 was in Seattle and it lead buyers market which ran into the early 1990’s . 2005 it was Down here on the Oregon coast and it lasted into 2011.
Some of the stocks i m following are looking the same. People are buying into the internet of things type thinking yet the more i think of it who really wants
a tech showing up at the house saying hey your fridge called me and needs work
or your heat pump needs something . i don’t need my refrigerator to tell me i need a gallon of milk either and i certainly need google to track it all nor anyone else for that matter.
One thing is for sure. When the trend changes its like a light switch just flipped
and that can come from just 1 person saying hey im selling and the rest thinking
the same . Elliot wave theory is a great tool as is Technical analysis .
I consider yesterdays high in the SPX a key resistance that i don’t want to be broken on a short term basis only .
That was a Fibonacci date , not a super strong date mind you but …..
Overall though i see a lot of strength is a few of the individual stocks i own.
Next week should be interesting
The market is even more insane in some parts of Vancouver, where you cannot find a single family residence for under one million dollars. There is nothing new under the sun, including all those insisting that “This time it’s different!”
What will be different is that the pain is going to be deeper and longer lasting….
Joe,
I actually missed this post on Canadian banks:
http://www.zerohedge.com/news/2017-05-10/moodys-slashes-ratings-6-canadian-banks-fears-asset-quality-deterioration-soaring-ho
I mentioned here some time ago that I went with a reverse mortgage on my home, which has problems, and that I’m prepared to walk away from at some point after it’s worthless. I note that the bank that holds my mortgage is the Home Equity Bank, which is either bankrupt as of this past week, or close to it.
I’ve now moved my money to a public bank, backed by our province (Alberta Tax Payers). It’s like the only public bank in the US: Bank of North Dakota.
I know some of our “big six” (mentioned in the article) are going to go bust. The warning lights have been turned on.
Every American should have an account at NDB. That reference by Peter is very valuable intel folks, real inside information not ten thousand people could could tell you about…
As you know (for the benefit of others) ..
Public banks are a safer haven, as they’re backed by taxpayers (the government) rather than private investors. They still practice fractional reserve banking (in Canada, it’s actually no reserve banking, as there are no reserve requirements other than the bank balance sheet, so it’s the wild, wild, west up here). And people think our banks are safe! It’s fake news.
Andre’,
So just a subtle shift from the May 11th high to a Monday, May 15th high! Nothing more?
A classic 4 day inversion window. Major highs usually after the weekend.
A big warm salute to all the contrarians on my site!
http://www.zerohedge.com/news/2017-05-11/5-universal-laws-human-investment-stupidity
ROTLMAO. I was reading that about 5 minutes before you posted it. Thinking about linking to it on Facebook, since Law #1 applies to every idiot with one-sided views discussing and commenting on politics.
Mike,
Yeah, I haven’t read it all yet, but will. I have to get an update video out. But I saw it and thought, PERFECT! One of my favourite quotes comes from Phillip Anderson (The Secret Life of Real Estate): “At the extremes, the herd is always wrong. One should not under estimate its capacity for stupidity.”
Today
10 trin closed at 1.001 close enough to 1.00 to be considered an overbought reading. ill still prefer a close below 1.00 and then a close back above to give a sell signal .
5 day trin closed at 4.46 slight bearish signal from yesterdays 4.29 reading .
5 day and 10 day advance decline line turned down despite today being bullish from the open .
the 11 day trin is beginning to give an overbought reading and is rolling over yet no signal as of yet .
10 day $tick plus $add is negative yet neutral
No real solid bearish case
bottom line : cautiously bearish
With today being a cycle high date and with Saturday
being the 10 day lag date from mercury retrograde cycle .
i will assume without any solid basis that options expiry
still proved a low ( may 19th )
the cycle low runs from may 18th into may 25th
and then points upwards into June 30th
In the broader picture i expect the NYA to out perform the Dow
going forward .
My best guess is we see tech sell off more so then the rest of the market
which implies relative strength to the rest of the market vs tech
The sox index was the only index to make new highs today .
I m beginning to wonder if it breaks its old all time highs last seen
in march 2000
the sox index made a low in aug 2005 at 543.03 , 1086.06 would be a 100 %
move from that low , sox closed today at 1042.43 .
from the late 2008 lows at 167.5499 the sox index has now rallied
a multiple of 6.25 times that low to the recent new high .
had the Dow achieved that feat it would be well above 36000 .
Strange market for sure
Joe, if you own the Emerging Markets Index (EEM), it also made a new high today. I’ll keep in mind your cycle low from 5/18 to 5/25.
I posted this odd observation last 4/5/2017.
Dec. 7, 2015, GMCR gapped up pre-mk due to JAB announcing its intention to acquire the company for $92. Approximately 30 trading days later market hits a low on 1/20/16.
April 4, 2017 PNRA gapped up after hours when JAB announced its bid for PNRA. 30 trading days is around 5/17/17. Maybe JAB’s acquistion announcement is a warning of future deep market retrace?
So I am curious to see if markets get a good fade around the 17th -18th. I have another hypothesis and it points to May 24 but Peter always says, “Trade what you see, not what you think,” so I need to see the charts near that date.
Joe, I meant a 52 wk high though not ATH.
sox low was aug 2015 ( not 2005 )
Peter
Thanks for the article
something just came to me .
If the bank that holds your mortgage defaults on you
can you reposes your house back ???
i am joking but serious at the same time.
I did some research on reverse mortgages here in the states
i am not sure if they work the same here as they do for you .
i think you also mentioned that you were not responsible if the value
dropped . I don’t think that is the case here yet i have limited
knowledge on the details .
From what i did read there was a few things i didn’t like .
I think ( cant say for sure ) here is mostly considered a loan which
must be paid back in full once you die .
so my kids could actually end up with a bill in the event the house
sold for less than the remaining debt outstanding .
i think in your case ( if i remember correctly ) you don’t face that .
The Seattle area is just crazy and i m amazed at how history repeats .
i’ve seen it twice and watched the outcome and no doubt
it will happen again .
the downtown area in Seattle is saturated commercial real estate wise .
companies like Facebook as example have built down there.
Most of the decent paying jobs are in tech which pay around 75,000 on average
yearly ( maybe a little more but that’s what i m told )
The old rule of thumb was you could borrow 3 times your income .
even a couple earning 150,000 combined ( which seems high )
would only qualify for 450,000 , obviously lower interest rates have changed
that metric yet its obvious people are stretched debt wise when you consider
car loans , student loans , mortgage etc….
Its all good until the lay offs !
Nothing happens until I sell or die. The clause that I questioned was that I will never be liable for more than the market value of my home. I got out 50% of its value at the top of the market, so I don’t much care. I don’t know what happens when this bank goes bankrupt. They sell the mortgage to another company, so we’ll see what happens. I didn’t think they’d go bankrupt this soon. It will quite a while before I hear much, I think.
I have to confess I have never been very adept at grasping cycles and other more esoteric methods used to time market price action. The one theme that has been quite clear to me for quite some time now is how futile directional trades in this market have been. One can very reliably expect seeming impulsive waves down to be bought and in fact that has been going on several years now quite predictably. I have always seen it as relentless central bank intervention both directly and indirectly. We know for example that BOJ is a major buyer of Japan’s stock market. So it seems as if the market wants fall, but the banksters step in with a bid. I think they used to call it the “Bernanke put”. The practical implication of all this of course is that one has to scoop profits quickly out of the marker or risk being violently whipsawed. Just look at the maddening price action the last several weeks. Just look at the price action even this morning. I seems to my simple eyes that as long as central banks with unlimited fiat money are permitted to intervene in the markets at will, they will continue to do so until something happens that so terrifies the market participants at large, that they all attempt to leave the market suddenly and with all the leveraged positions currently held, so overwhelm the ability of even central banks to keep things afloat. This is why I just do not see this thing ending quietly and in any kind of orderly fashion. Call it flash crash, call it Black Swan, or any other similar moniker, the bottom line is I see this insanity ending with an exogenous shock that no one would have been able to predict. Just my two cents.
For the cycle lovers:
June 5-6 expecting a major high (wave 3 top). Than down into july / augustus for wave 4 bottom. Than the real blow off into end 2017 / begin 2018…
Price levels AEX:
55x
490
59x???
Price levels ES:
Leave that up to Peet! ?
Cheers,
W
Just a request from someone who’s been doing cycles for almost 50 years to anyone that posts cycle conclusions. It would be very helpful to all of us if you give us the basis of your cycle resolutions. June 5-6 major high based on what cycle or pattern? Speaking of cycles, here’s a pattern I just uncovered this past weekend and it’s fascinating. 1)April 7, 1958 (not the bottom of a bear move, but the exact starting point of an upside explosion that lasted until 1966… 5393 calendar days to 2) January 11, 1973…5395 calendar days to 3) October 20, 1987…5391 calendar days to July 24, 2002 (on the S&P 500, October 2 went less than 1% lower intra-day, but, with the exception of a few weeks at the 2008-9 bear bottom), no other day ever went below the July 24, 2002 low to the current day!!) That, of course takes us into 2017 for the next resolution of the 5391-5395 calendar day pattern. Any volunteers to calculate the next expected resolution from July 24, 2002??
Thursday, April 27, 2017 – Monday, May 1, 2017
Bingo! Yes Rotrot, exactly! There’s plenty that says this market has further to go, but there are some truly compelling reasons to think it is ALL over, not the least of which being there is no one (almost) who thinks it’s all over!! What I hear mostly now is we await a final 4-5 or we are facing a fabulous blow-off to the upside (name your number…100,000 is now being bandied about in the Dow). Prechter, whose preferred count is also a 4-5 remaining, called and said for the first time on the S&P, one can count a 5 of 5 of 5 of 5 etc ….use your own Elliott notation, although he agrees with Pete that the preferred count is to await a final 4-5, especially on the Dow. If any of you remember the wonderful Ed Hart on the old FNN, the precursor to CNBC, he used to say, “We will know in the fullness of time!”
PeterG,
I’m trying to understand you. Why would you presume it’s all over and ATHs were reached on those days? Oct. 20, 1987 and 7/24/2002 were lows. You’re saying the ‘5391-5395 cal days’ cycle this time points to a high right? QQQ, XLK and EEM hit 52 week highs today. That would be 5406 calendar days. Are we running on borrowed time? I am still on Peter T’s camp that indices are seeking a wave 3 high.
It’s difficult for me to be too bearish because many invest in equities automatically via 529s, 401ks, IRAs and Healthcare FSAs. Some companies have stock plans too and employees contribute every paycheck with no transaction fees. I don’t think many of them look at charts and say, “Oh, the RSI is too high, I’m going to stop my contributions on the 15th or 30th.” I feel quite a number are passive investors. I know a few in their early 20s with good income who max out their 401k contributions. I was a little bit surprised so I tell them to have at least a 6-month emergency cash account first before they max out their 401ks. All the best!
That comment from Prechter is interesting. One of the things about EW that one cannot deny is that price can, and often does, negate a projected wave count. One can always go back and adjust the count after the negation and maintain that the EW rules were followed, even though price did not do what was predicted by the subsequently proven incorrect count. As you pointed out, the almost universal expectation ( Enda Glynn the only exception I have seen) is that new highs are ahead. This market to me has the stench of death. Hard core analysts deride folk who talk about fundamentals and smugly point out how wrong the bears have been all these years about where the market was going. This is certainly true. There is also an economic melt-down taking place before our very eyes (just look at retail) yet the market continues to act as if there is nothing but sunshine and flowers ahead, flirting with all time highs and nose-bleed PE ratios.
In addition to the fact that virtually no one sees a top, there is also the freaky volatility readings, unlike anything seen in decades. Of course things could get even more freaky and extreme than the most recent parabolic market rise. Nonetheless, I think to entirely dismiss even the possibility of that being “all she wrote” so far as irrational exuberance, would be to ignore what is plainly before our eyes. I also recently saw another confident pronouncement about how many months the market still has to run after VIX makes a sub 10 reading. Everybody seems to be forgetting, we have not been this way before….
If the bullish case for equities is depending on employee contributions, it is going to be facing some stiff headwinds going forward. Baby boomers are retiring at the rate of 10K per day and will not only no longer be making contributions into the market, many will start drawing down retirement accounts. Equities have been kept aloft in no small part due to companies buying back their own shares and issuing debt to do so. Earnings growth has steadily been declining for seven quarters, making the current PE of equities quite a mystery. I suspect the rude awakening will come via some sort of debt crisis. I guess Puerto Rico’s default, completely ignored by the press as it has been to date, speaks to the state of complacent in-attention of the financial media. As soon as it comes out that some supposedly safe money market fund is going loose billions on its now worthless PR bonds…maybe that will start to get people’s attention.
Verne,
This article was published September 2009. http://www.marketwatch.com/story/will-the-markets-tank-as-boomers-retire-2009-09-10
This is a SPY chart from 2009 to now.
http://www.macdtrucking.com/images/sp-500-weekly-charts/SPY-4_g12i7.png 🙂
Thanks for saying that Peter. I was trying to think of a way to ask for some basis for all the pronouncements I was reading without appearing to be dis-respectful. I am sure many of the regulars here understand the inside lingo but for newbies like me, we have absolutely no clue what the basis for the projections are and would really appreciate a bit more occasional explanation of the thinking behind the statements.
PeterG,
Thank you for the 5391-5395 cal days cycle. I guess my math is wrong because the SPY lows 3/27 and 4/13 are 5360 and 5377 calendar days respectively. For DIA low 4/19, 5383 days.
If you’re thinking of Highs then lower hi DIA 4/26 is 5390 days.
My 5/24 target is based on a possible hypothetical relationship between uvxy stock splits and SPY.
Thursday, June 8, 2017…high or low?
UK General Election
ECB Governing Council Meeting
Peter G
i assume your talking about the late George Lindsay 15 year low to high
count .
Using your dates i got may 1 2017 . How do you perceive that ?
I’ll post a few dates for you using a monthly chart just to keep it simple .
Aug 1982 low plus 211 months to the march 2000 highs ( spx )
adding 211 months i get oct 2017
Oct 1987 low oct 2002 low was 15 yrs , adding 15 yrs i get Oct 2017 .
Using the monthly NYA
aug 2000 closing high to the march 2009 print low was 103
months , adding 103 months i get Oct 2017.
103 / 12 = 8.58 yrs ( close enough to Armstrong 8.6 yrs )
Now for something different .
again im keeping this simple .
Lindsay stated that from a major top you look for a low
12 yrs 3 months to 12 yrs 8 months after that high .
using both the spx and the nya
march 2000 plus 12 yrs 8 months was Nov 2012 ( the actual day
was just after the election )
using the aug 2000 high ( nya )
aug 2000 plus 12 years 3 months you get Nov 2012
If you look back in history you will see several times that
the market had a 60 month advance so to be perfect 60 months
from nov 2012 you get nov 2017 ( i still favor Oct 2017 though )
That is a few and the simple rational behind them .
Now for something just odd.
spx monthly
high oct 2007 plus 21 months was the higher low in july 2009
add 21 months the high april 2011 add another 21 months
was jan 2013 which was a break out back upwards.
a low though was nov 2012, so adding 21 months to nov 2012
you get aug 2014 a high of sorts with a low in jan 2016
add 21 months to jan 2016 you get Oct 2017.
Oct 1987 plus 60 months you get oct 1992 a dip that doesnt look
like much today yet a low of importance back then .
add another 60 months you get oct 1997 which was another dip
and a low of importance back then . add another 60 months you get
Oct 2002 which was another low of importance and then add 60 months
you get Oct 2007 which was an important top , add another 60 months
you get Oct 2012 ( other factors though had me looking at nov do to the 12 yr 3 month to 12 yr 8 month time count from the march and aug 2000 highs )
add another 60 months you get Oct 2017 .
For me it must be a High and if it is not a high and turns out to be a low ???
then id say the bull market has a ways to go .
im focused on only 2 major time frames for important highs .
Oct 2017 being the first and June July 2018 as the second .
i would prefer the June July 2018 being a lower high yet i cant say that
will be as fact it is just how i see it today .
obviously i haven’t explained the June July 2018 date yet at this point
i don’t see the need .
the year 2018 is considered a benner business cycle high .
Peter G,
Is it October 31 to November 3 2017?
No, Ed, rotrot had the correct answer above…
https://www.youtube.com/watch?v=OhRCipxHvMo
Dog, thanks for sharing
Love his analysis, so clean 🙂
Next week market should reach lows on Wednesday/Thursday and then rally for at least 7 days. (based on Lunar Tuner-phase, distance, declination, seasonals).
Thanks Valley. Have a great weekend!
Welcome, P!
The 10 day trin closed today Friday may 12th at .997
this is now an official overbought reading based on this indicator
Don’t think this is anything other than it is . its an overbought
reading by 1 indicator yet i find it a useful tool among the ones i use.\
all i need to see is a continued sell off which will bring this indicator
back up to close back above 1.00 and a sell signal will be given.
what this means is despite the recent decline i don’t have a sell signal.
hence the cautiously bearish bias i have had .
an oversold reading is 1.40 on this indicator and believe it or not its not
an easy feat to see 1.40 broken or hit . bottom line it takes time .
as example . on april 13th this indicator closed above 1.40 and a buy signal
was given on april 17th which was the very next trading day .
we now have the overbought reading below 1.00 and close back above 1.00
will give the next sell signal .
Prior to this
the last overbought reading was on march 10th with a reading of .94 and the
sell signal was given on march 15th which was a coincidental swing high
in many indexes . ( this is not a perfect system yet i like its simplicity )
it took from march 15th to april 17th to go from a sell signal to a buy signal .
it would take a very steep decline for this indicator to give any oversold reading
by may 18th . Not saying that is what will happen im just saying this indicator
has its merrits at its key swings of 1.00 and 1.40 and the time between those swings can be much longer then most expect or have the patients for .
Now the 5 day trin , you simply add up the 5 closes
4.00 is overbought and this is a very short term indicator .
4,00 is the overbought reading , a few days ago i noted 4,25 has worked several times . i posted the 4.29 level a couple days ago and said it was close enough
to consider it an overbought reading . reading from 6 to 7 are what i look for
in a bullish environment yet in bearish markets reading from 7 to 9 are seen.
so today the 5 day trin closed at 5.04 . Nothing to get excited about mind you
yet the trend is moving in the right direction .
an overbought reading on the 10 day trin and a 5.04 reading is nothing to consider short term oversold .
this 2 sided approach to just the trin keeps me cautiously bearish .
advance decline line the 5 day and 10 day gave a mixed message today .
the 10 day gave a bullish signal for Monday and the 5 day gave a bearish continuation signal . hence the advance decline line is neutral .
the 20 day oscillator is still in giving an oversold reading, not an extreme
but its oversold .
Bottom line : Cautiously Bearish .
In the broad scope of things , my window from may 18th – 25th should be a cycle low and a strong upward movement should run into June 30th .
the indicators are now where as a whole giving me anything solid to be aggressively bearish . the sloppy choppy nature of the market is indicative
of a consolidation and or corrective move from which prices can launch higher from.
That said TSM appears to be at an interesting juncture . Looking at the monthly
wave count im not sure yet how to count this . on a quick glance i see
from the august 2015 low a 1 2 i ii iii iv v3 , yet the month of may is not over
from its oct 2002 low at 3.92 and 10 times multiple would target 39.20
from its nov 2008 low at 5.80 a 7 times multiple would imply 40.60
from its aug 2015 low at 17.32 the 100 % up was at 34.64 and it gapped over that price , the may 8 gap low was 34.63 .
The monthly chart shows the trend steepening to the upside which implies this stock is being chased .
from its jan 2000 high to its oct 2002 low this stock went from
27.00 to 3.92 . if this stock was to retrace 1.5 times that drop then the
38.54 level would be resistance of some sort .
I think for me it is time to consider thinning this one out by at least 50%
The last low on april 19th at 31.49 to the recent high at 35.80 on may 11th
was 13.68 % in 16 trading days .
lol just thought of this , today was 17 trading days from the april 19th low
1/2 of a Fibonacci 34 .
Ill cut 1/3 to 50 % of that stock out on Monday and stick to my plan of lightening up . Its hard to sell for me and it is much easier to accumulate lol but this
bull market in my opinion will end with in the next year , whether it be
June 30th or Oct or June 2018 until i see value i wont buy and until the next cycle
low comes i wont buy . only way to think is to lightly sell over time and when the big thud comes not be hurt by it .
through out the year .
I agree with Valley. Already said Monday will see a high. 5/15 and 5/18 strongest days this week. So Thursday will see a low. Then they will pull up for Opex, and after Opex they will let go again. Have some tidal inversions that will give the abc down into 5/18.
5/22 will be a high (major date; needs to be tested). Then down again.
So many reasons for a high; too many to mention. Could be 5/15 will be the high for the year (and years to come). In any case it will be a high.
Cheers,
André
About 6/23.
10 metonic years from the 2007 high gives 6/23/17 (if you calculate in degrees).
The 2009 low on S&P was 666,67. Adding 4 times this number (price = time) to 6/3/2009, we get 6/23/17.
The composite planetary velocity gives a peak 6/23/17.
This date is very vibrational. 6/30 is a standard low in my system. But I think it will be inverted. In that case 6/23 will be a low, 6/30 a high and 7/6 a low again. 7/6 very strong as it is 8 years and 4 months form the 2009 low. Remember that 7/7 was a low in 2015.
Thanks, Andre’. Your work is always interesting!
A new weekend post is live at: https://worldcyclesinstitute.com/elliott-wave-taking-apart-the-chart/
This website is for educational purposes relating to Elliott Wave, natural cycles, and the Quantum Revolution (Great Awakening). I welcome questions or comments about any of these subjects. Due to a heavy schedule, I may not have the time to answer questions that relate to my area of expertise.
I reserve the right to remove any comment that is deemed negative, is unhelpful, or off-topic. Such comments may be removed.
Want to comment? You need to be logged in to comment. You can register here.