
Update Friday, Feb 19
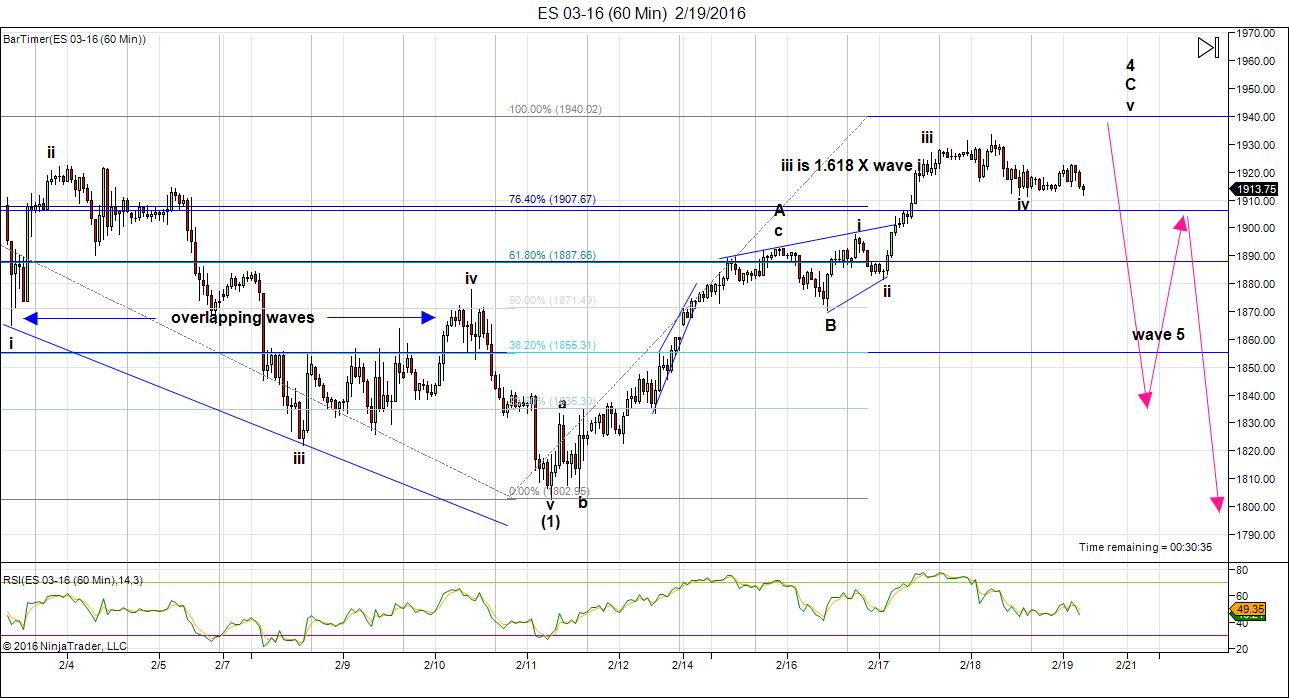
Last night confirmed for me the fact that we’re in a fourth wave (as opposed to a second wave. The list of reasons is overwhelming now. I will do a video this weekend a provide charts. Get ready for a drop of 300 points on Monday. The biggest, more recent one is that fact that the bullishness of the current rally turned off like a light switch Wednesday night. We still need to get to the 1940 ES level and it looks like we’ll struggle to get there even over the weekend.
This chart of the 60 minute ES shows the projected path to new lows. The arrows represent the first, second, and start or the third of five waves down.
The two alternatives on this page have been in play for a week now. The challenge has been to figure out which one is the correct one. Mission accomplished.
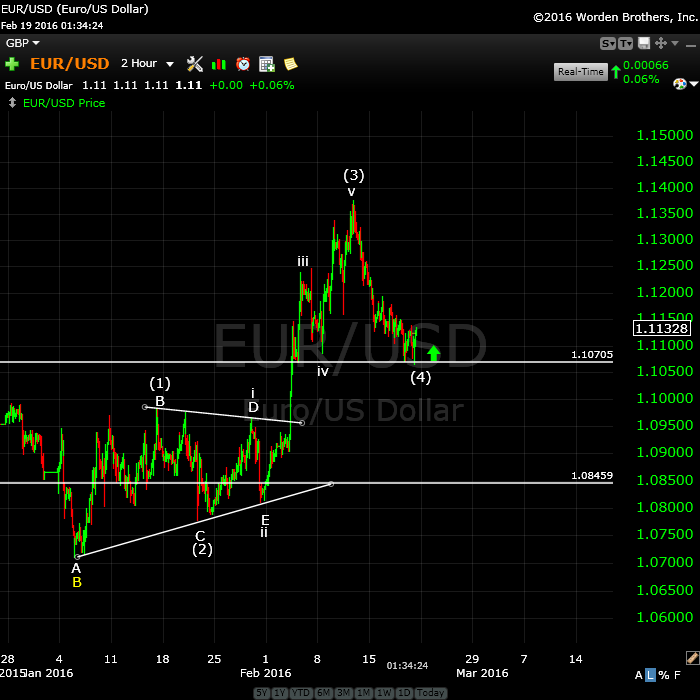
Here’s the latest 2 hour chart of the eurusd. Strangely enough, it’s ended up with the same count as the equities, but in the opposite direction. I’ve recently changed the count as we’ve only retraced a fourth wave. It still has to bottom properly (as equities have to top properly). I would expect eurusd to now head up in a fifth wave of the first (of the third).
_______________________
Update Wednesday, Feb 17 After the Bell
Below is as 60 minute chart.
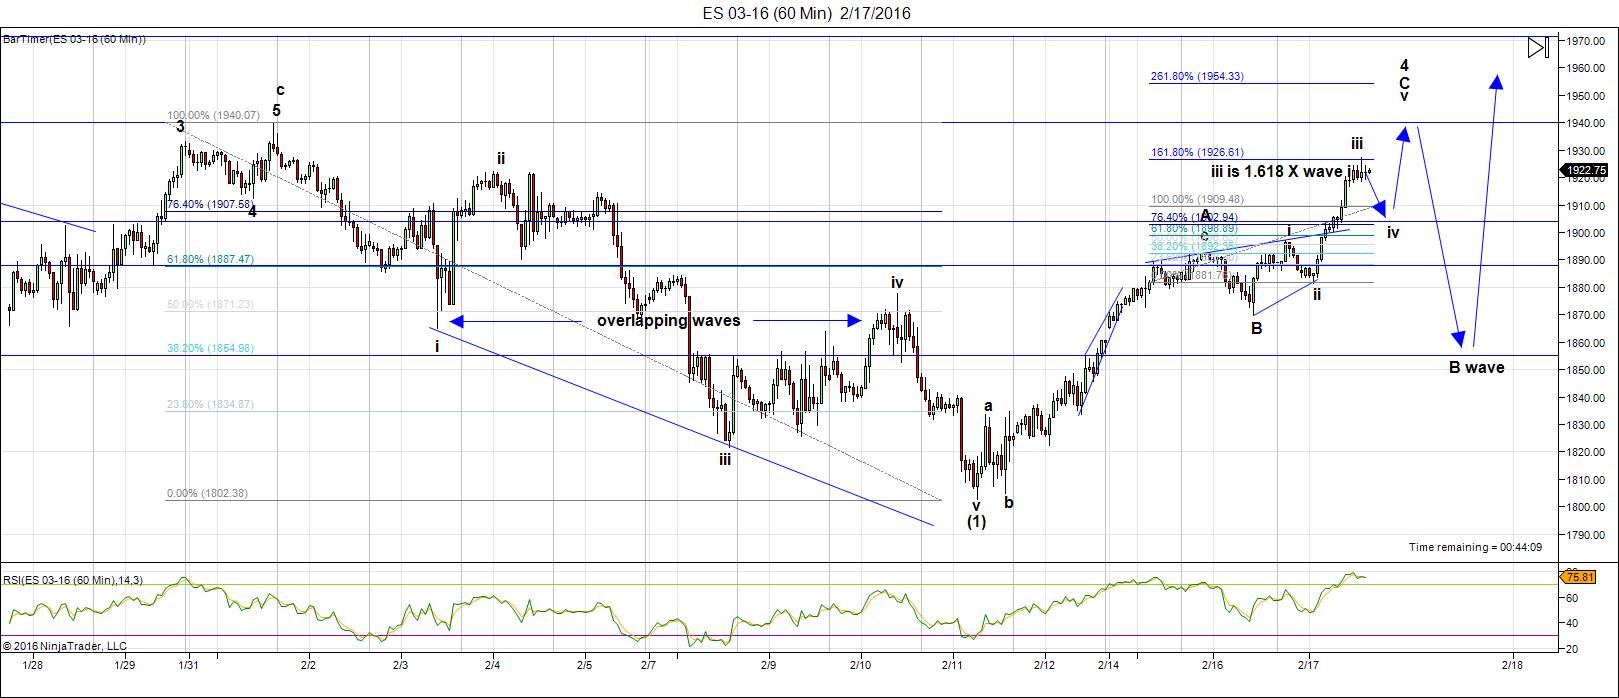
This is my final revision to the ES chart today. I’ve now had a chance to look over the indices after the move on Tuesday and overnight into Wednesday (the 17th). I’ve also had a good look at eur/usd, which usually gives a good indication of where equities are going. It’s hardly moved over the past 224 hours or so. I will post the euro chart shortly (along with SPX).
Here’s my preferred scenario based on cycle dates and what I see happening in the equities and eur/usd. This afternoon (after the bell), I’m leaning towards the second wave scenario.
Tonight (Feb 17) we’ve begun to head down into wave 4 of A (it’s actually wave 4 of the c wave of A). Tomorrow (Thursday, Feb 18), I see us heading back up to finish wave 5 of the A wave (wave A is not complete). A first wave up (in this case, an A wave) usually stops at the previous 4th wave of lesser degree, which would be 1940 ES.
I would expect us to turn there and then head down to about 1860 (62% retrace level) for wave B. That may happen Friday and last into Sunday. Early next week, we would head up to trace out wave C of wave 2. If wave C is the same length as wave C, that would lead take us up to about 1988 in ES, which is about the 62% retrace level of wave 1 down. (this means we would consider wave 1 down to be complete (even though the indices are “out-of-sync).
We would turn down in Wave three sometime in the Feb 23-25 time span.
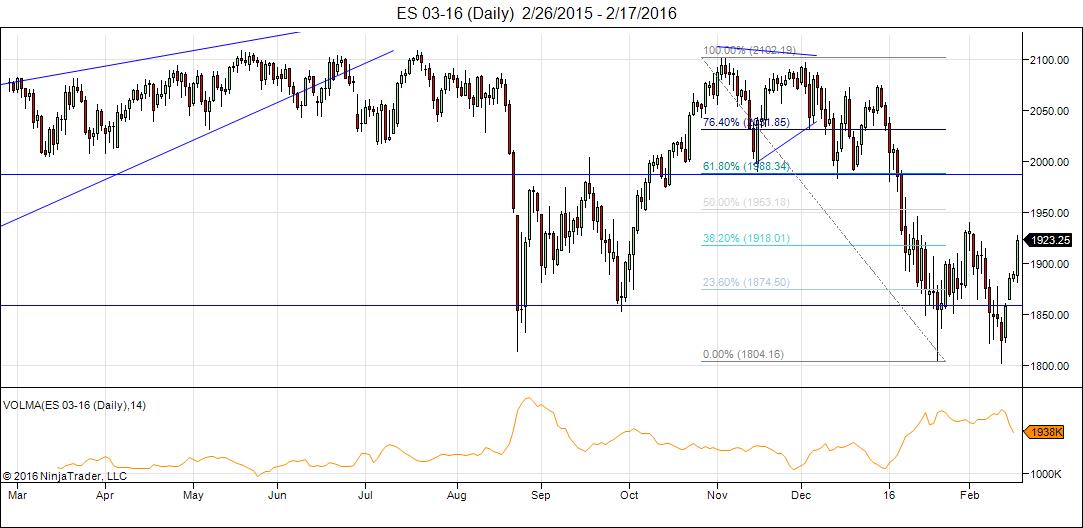
Here’s the daily chart of ES (SPX futures). It shows the 62% retrace level at 1988. You can see how volume spike on negative waves. It’s fairly weak on rallies. That’s not good for bulls!
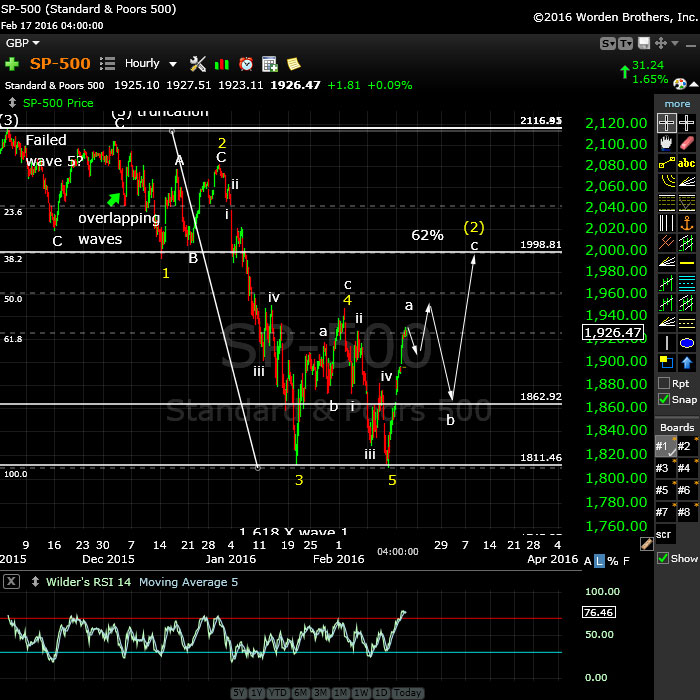
Above is the one hour chart of the SP500 showing the same path as I’ve suggested for ES. You can get the appropriate levels from the chart.

Above is the hour chart of the eur/usd. It has been moving in lock-step contra to the US equities. However, it’s hardly moved in the past 24 hours or so. It’s poised to head up to the 62% retrace level of a correction and then eventually down into a c wave (wave (2) yellow). I expect the c wave of the euro to happen in conjunction with the c wave of the equities. Both are in second waves. That’s how closely the markets are correlated!
_________________________
Interview w/Dale Pinkert (FX Street) Wednesday, Feb 17
I’m doing a live interview with Dale Pinkert of FX Street at 15:15 GMT (10:15 EST) tomorrow.
Update Tuesday, Feb 16
This is the very strange configuration in the US indices and so I want to bring forth an alternative to a first wave extension down. I’m doing this because of the changes in today’s market. The biggest change is that the euro is no longer in an ending diagonal, which suggests that the ending diagonal in equities is also complete.
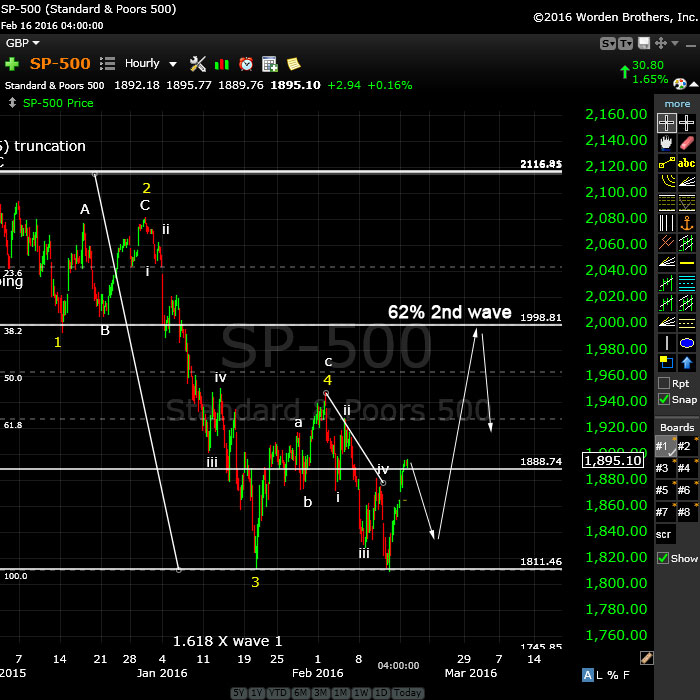
Here’s the one hour chart of the SP500. The thing that is making the projection so difficult at the moment is that the DOW did not come down to a new low last week, while the SP500 did. That puts these two indices out-of sync. PLUS, the eur/usd is no longer in an ending diagonal and now looks to be correcting, which would suggest that the US indices should be doing the same thing (going into a second wave).
That being the case, a second wave in the US indices would look like this (above). If we come down tonight in futures, but only to about a 62% level, then it’s likely we’ll turn up in a C wave of the second wave. This would eventually lead to a much larger third wave down.
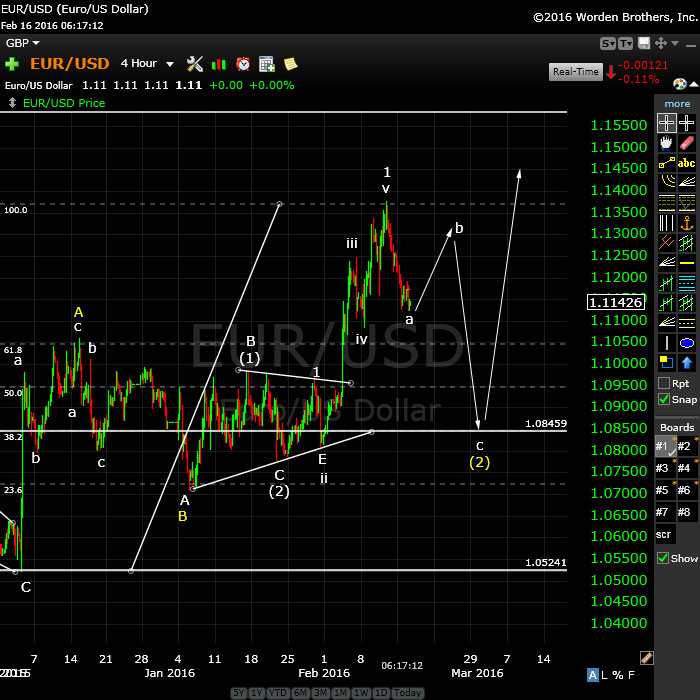
Here’s the other half of the puzzle: the four hour chart of the eur/usd. Today, the euro came down too far to be in an ending diagonal. It now looks to be correcting the first wave of a much longer wave 3. This correction would be wave two. That means it should head up tonight in a b wave and head down after that in a c wave. This highly suggests that the equities should to the same thing in the opposite direction.
This would set the eur/usd up to continue a much larger third wave up after completing the second wave.
___________________________
Update: Monday, Feb 15 (Market Closed)
The emini futures markets were very active over the weekend. Below is a chart of ES (SPX futures).
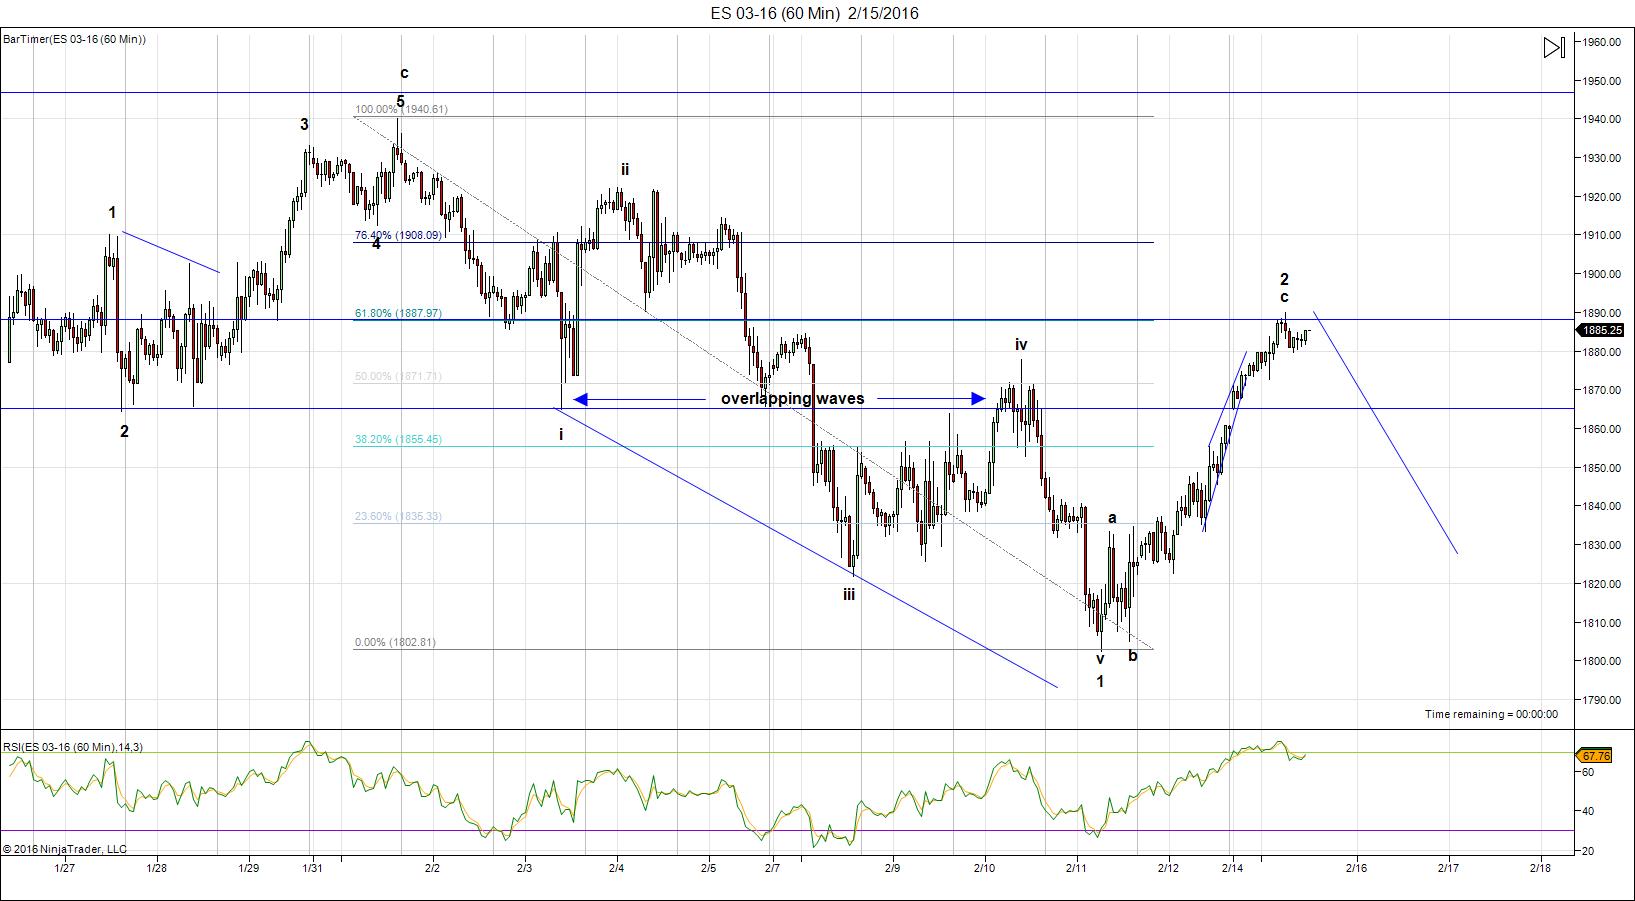
Above is a the one hour chart of ES. On Sunday, we had a very large wedge up in 3 waves (abc). If you look closely, you can see a gap at about 1860, which is where we left off from Friday. The wedge went right up to the 62% retracement level and immediately stalled out. We’re poised to roll over and head down in a bigger way than we were on Friday. I’m not sure if we’ll start down right away Monday evening when the futures markets open or whether we’ll hang around this area until the open on Tuesday morning.
What we have here is a first wave down of an ending diagonal and the second wave virtually complete. Now we’re set to head down in wave three. Because we have overlapping waves (wave 4 in the area of wave 1 – a hard Elliott wave rule that indentifies a corrective wave or triangle—in this case an ending diagonal), the next wave down is wave 3. We’re setting up for an extended diagonal down. I don’t have a target identified yet, but this should be a large set of waves to a new low.
Once this set of waves is complete, wave 1 down in its entirety will be complete and we’ll bounce in a higher degree wave 2. Based upon our collective cycles analysis, I would expect this ending diagonal to last the remainder of this week.
Addendum on Targets and Timing: Here are some further thoughts on length and timing.
I expect that we won’t start down in wave 3 of 5 until after market open. That’s because the cash indices will have to “record” the higher wave 2 opening that the futures have traced out. We will have waves 3, 4, and 5 still to go of the ending diagonal, so I expect this set of waves to last the balance of the week.
If wave 3 of the ending diagonal is 1.6 X wave 1, this will take us to 1680 SPX. We should still see waves 4 and 5 after that. A typical full wave 1 down (from the Dec. 3 top) extended would drop to about 1620.
___________________________________
Original Post Saturday, Feb 13
Ending diagonals are actually quite rare, certainly at a high degree of trend, which is what we’re dealing with here. However, I’ve been complaining that they’re showing up everywhere! This week has been yet another example. Not only did we see an ending diagonal at the end of the third wave down (of the recent first wave), but we’ve also had to put up with one at the end of the fifth wave (over the past few days).
You always want to learn from the market. This one is clearly very different from a normal market. I think it’s because markets around the world are deleveraging debt together, and moving together, as a result. I’ve been mentioning a lot (since last September) that currency pairs and US equities were starting to move in tandem … almost in lock-step. They are even more so now. But it’s creating some anomalies that we need to be aware of.
The US dollar is moving with the US equities, and the eurusd currency pair is moving against the US equities (in reverse, if you will). I keep a eurodollar chart up to help with turns in the major US indices.
So, from now on, I’m going to look for ending diagonals in C waves, 3rd waves, and 5th waves as more the norm than the rare event they normally are.
You’ll see me allude to them in the video and you can check out the link to the explanation of what they look like and how they work.
A note on first waves: First waves are always very difficult to forecast because all you have to go on is a previous top in five waves. However, we didn’t get one of those. The truncation we did get made everything extremely difficult. Although I was able to call a top at January 31, I had no idea whether it was a first wave or something else. However, once a first wave is complete, the new trend is confirmed (in this case, down) and subsequent waves become much easier to forecast, in fact, highly predictable.
Here’s a video overview of the market as at Sunday, February 7:
Marker Report for Feb 13  |
 |
Make sure you zoom the video to full size with frame expander (arrows) in the bottom right hand corner and also set the quality to as high as your web connection allows. This is an HD quality video so the best viewing is at that level. |
_______________________________
Here are some charts from the video:
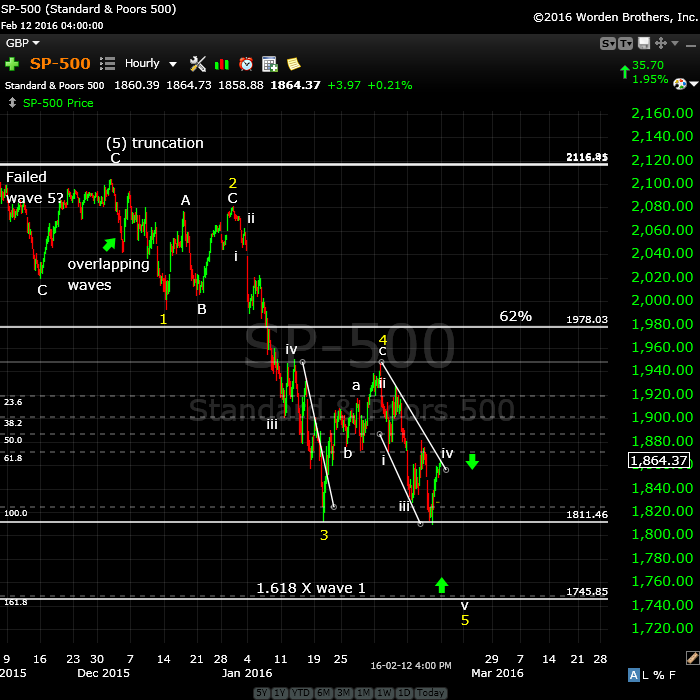
Above is the hourly chart of the SP500 showing our progress from the truncated top wave down to where we are today. As explained in the video, we’re now in an ending diagonal with the final wave down ready to unfold. I’m showing a downside target of 1745, but we could extend from here. After all, this is an ending diagonal and they tend to overshoot (do a throwover) the target.
I have a turn date of Tuesday, Feb 16, but we may sit at the bottom for a couple of days before actually heading up in earnest towards the end of the week. From the bottom, I expect three waves up to about 1978 (a second wave). This will be the setup for a third wave down.
It took us 2.5 months to get down here from the Dec 2 truncation, so expect at least two months to get back up to the 62% level. That would take us into April. More on that later.
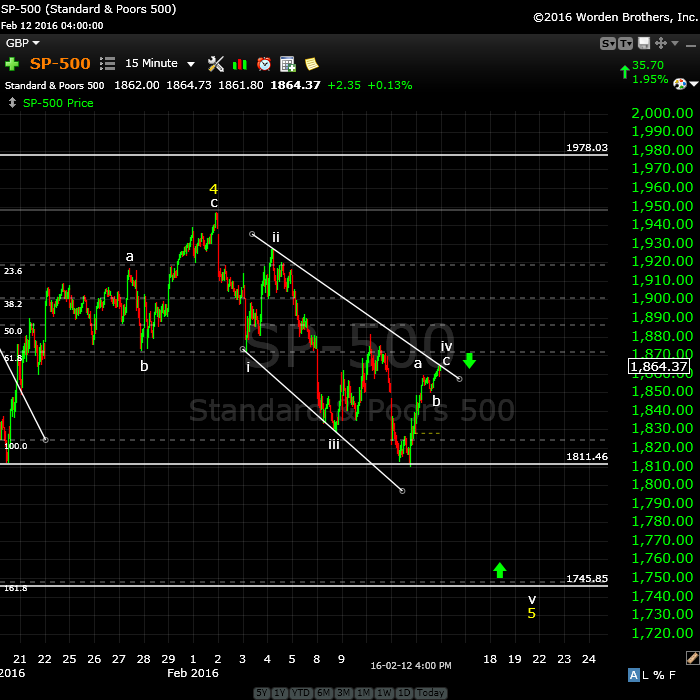
Above is the 15 minute chart of the SP500 showing the 4th wave diagonal we’re currently in. This is a slightly different configuration for an ending diagonal as the third wave is usually the more complicated wave. In this case, it’s the fourth wave with the very clear abc pattern. We are currently set up for a fifth of the fifth of the diagonal down to a new low. This should come down in three waves. It may extend past the target (which is measured at 1.618 X the first wave, even though it’s truncated, with adds difficulty to the calculation, of course).
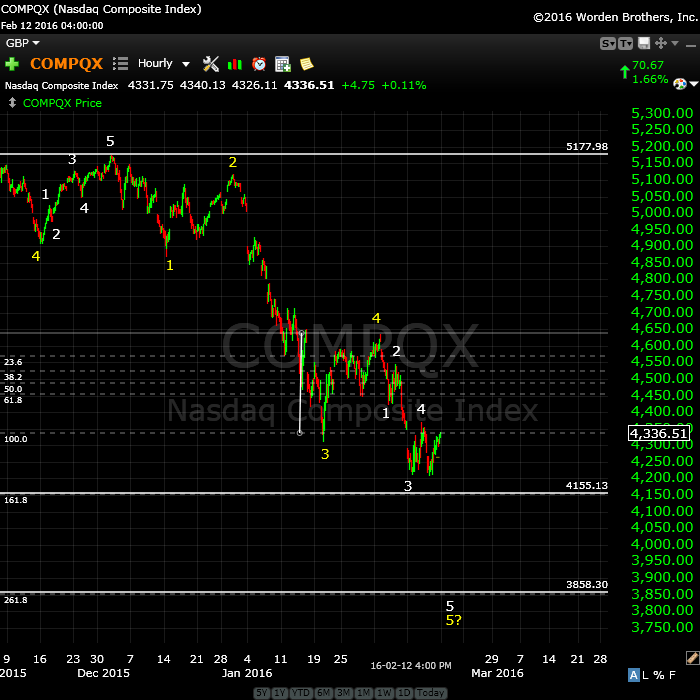
Above is the hourly chart of the Nasdaq. This is, for the most part, a more normal motive wave. However, the first wave of the sequence is a corrective wave. I attribute it to the fact that the SP500 and DOW both truncated, because this first wave looks very much like their first waves. The indices all move together (more or less) so I expect the overall movement had a large influence on the Nasdaq wave pattern.
The fifth wave down in coming down in a traditional motive wave configuration, as marked. A measurement of 1.618 the length of the first wave puts the target at 4155, but I expect this wave to extend down to 3858. Keep in mind that this is a guesstimate based on what else is happening in the market. The actual range could be anywhere in between. However, it will come down in 5 waves. We’ve had the first and second already, so we’re looking for a long third wave and then a shorter fourth and fifth.
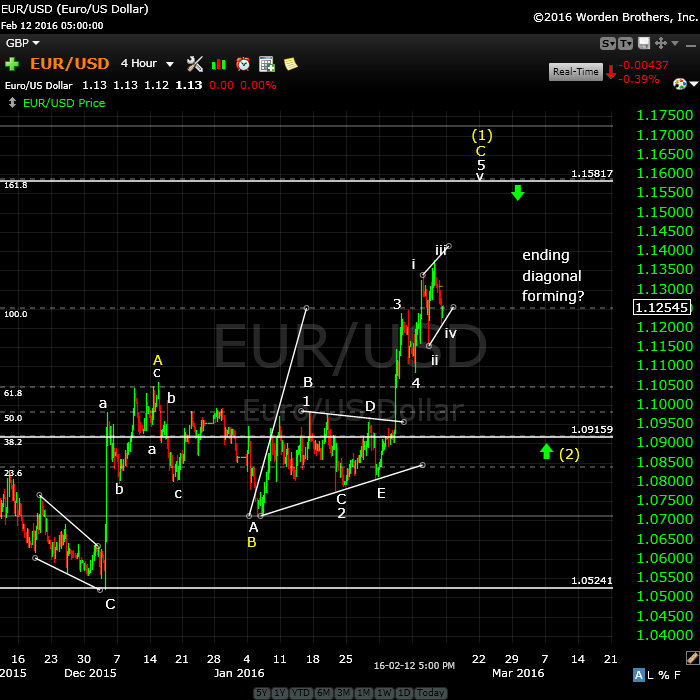
Finally, let’s look at the four hour chart of the eur/usd currency pair. This pair is moving contra to the US equities. When equities head up, this pair heads down and vice versa.
I see yet another ending diagonal shaping up here (overlapping waves in 3) with a final target of up to 1.158, which is a C wave (yellow) measurement of 1.618 X the A wave (yellow). After we top out, we should have a long second wave down (as US equities head up in a second wave) to the 62% level, which is marked with a (2) yellow on the above chart.
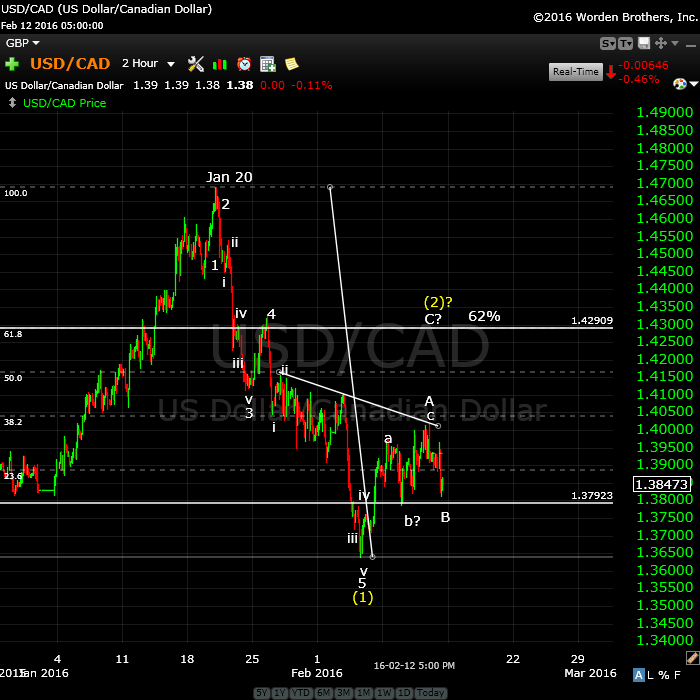
Above is the 2 hour chart of USDCAD that I’ve been following. It’s completed a first wave down as forecast and we’re continuing to work on a very complicated second wave retrace. I’ve expecting this wave to move to the 62% level as the eurousd tops. From there we should turn back down into a third wave.
The movement of these secondary US currency pairs is interesting because they’re moving contra to the eurusd, which is very odd, but I’m just keeping my mind on the technicals … haha. I don’t have to think it all through to know where Mr. Elliott is taking me!
They’re moving in the same overall direction, but the individual waves are moving contra (ie – wave 2 is completing here as wave 1 is completing in the euro). They’re one wave or so out-of-sync.
Things are getting interesting. Good trading!


Thanks Peter.
Excellent analysis!
Thanks, Big A!
The videos are great. I’ve learned a lot. Any thoughts on gold this coming week? Do we start a correction or is there more upside to go? Thanks again.
Mike,
Not quite yet, I don’t think. A third wave is almost done, but we should correct only in a larger degree fourth, then a fifth up, before a large B wave. We should get to 1310 before correcting to any great degree.
Thanks!
Hi Peter,
thanks for the video.
Do you definitely abandon the double bottom in SPX ?
Oh, yeah, did that on Friday. They all have to double bottom to make it real. One index means nothing.
or rather Thursday I guess it was.
In addition to my analysis yesterday I need to say I see another very strong date early March. With 3/8 the solar eclipse and 3/6 the anniversary of the 2009 low, it could be the decline extends into 3/5-7. In that case the strong 2/26 date will be tested after a low 2/22.
Cheers,
André
Other than yet another ending diagonal to the upside in futures tonight, I have no idea what’s going on. I can’t see how this pattern can add to the supposed ending diagonal down in ES. In fact, it does just the opposite.
Once I can figure out a pattern, I’ll let you know.
It looks like we’re at the upper end of the ES channel and I expect us to turn over here and eventually get to a new low. I just can’t tell you the overall pattern. It’s simply a down-sloping channel at this point.
Dear Peter and Andre,
I have full faith in you and Andre, the ES action is basically a pump and dump action in which I think the dump side will soon be revealed.
Just imagine that Rusia openly say we are in new Cold War and Turkey started bombing the PKK and Russia side continued the bombing.
China side just announced drop of 18.8% YoY and 11% YoY on both exports and imports, big miss vs 1-3 % estimation.Japan just reported bad miss on 4Q gdp, badly negative,Abenomics is in the doldrums.
And we have futures pumped up before this Japan and China data out.
I think the algorithms needed to pump hard before the dump continues just that the pumping could not rhyme well the economic data coming out… whoops….
Regards
Vince
You’re likely right. The bigger the setup, the bigger the move in the opposite direction. I’m just looking for a pattern so I can enter (and suggest an entry). I keep eur/usd up and that’s telling me we’re going to change directions shortly. I think ES has one more subwave up to finish.
Nope … just measured. ES might be done right about here … 1880
YM, NQ, ES all have small double tops.
I think what we have here is a much larger ending diagonal in futures. NQ and ES have both retraced to a point that this wave up in 3 would be wave 2 of a 5 wave sequence down. This means there should be a third wave down next. I expect a longer downtrend than I’d originally thought. I don’t have a target.
Hi Peter. Are you thinking that v of 1 of 5 of big 1 ended at ES 1804-1805ish and we are now in 2 of 5 of big 1? Or is big 1 over and we are in a big 2 that retraces back to the low 2000s? Please excuse my not having the right terminology to type with.
As far as I’m concerned, this wave hasn’t bottomed properly yet. So we’re in the fifth wave and yes, this would be wave 2 of it, I think. Should be a big drop to come. This is a wedge, 3 waves up, so it has to retrace down.
I’m looking for a small degree second wave bounce here, retracing about 62% to get short.
Thanks very much, Peter. I think I understand now.
I posted a chart of ES at the top of the post based upon the movement over the weekend.
You’re the best Peet! 🙂
Thanks again. Just because we don’t post everyday, don’t think we are not watching and learning from your willingness to share your thoughts and expertise.
You are the best.
Robert,
Haha … a word from “the stalkers.” Don’t worry, I can tell by the page view numbers that you’re out there. But I do appreciate these kind comments from time to time, nonetheless.
Peter-
Do you think we will tag the .618 retracement on cash SPX ~1894 this morning before we roll over?
Ted,
I’d expect so, yes. I would like to also see a retrace in futures to a top or at least a second wave.
Keep in mind that ending diagonal waves are in 3’s so there’s a lot more leeway. Don’t know exactly how it will play out in terms of meeting that upper target.
Measurements in ES take us to the previous high at 1893 or so. We’re in the fifth wave. I now expect SPX to hit 62%.
ES 1887 would be the signal that a top might be in – below that level.
Ted,
I would be careful with the wave down I’m expecting. It may only be a B wave. Something’s making me nervous – it’s a very strange setup, as the DOW and SP500 appear completely out-of-sync, which is rare. And the big caution for me is that the eur/usd is no longer in an ending diagonal. I think it might now be in a correction.
We could be in a larger, second wave in the US indices. So we may only come down 62% tonight, as well.
New charts posted. I’ve changed the count, in that I think we’ll come down in a b wave tonight in ES.
Thanks Peter!
So are you suggesting last thursday was the bottom of wave 5 for the first wave down?
Well, that depends on the index. For SP500, yes. The DOW and NYSE Jan 20. Nasdaq Feb 11. There are differences, and that’s what makes it a bit more difficult to decipher.
I had to run out to a meeting, but I see SPX touched the 62% level right at the end of the day. We should head down from here.
Peter,
hope you to be right 🙂
Yeah, me too! But something is bothering me and I’m not sure what it is.
I would caution everyone to let the market show us it’s going down from here. It’s a very strange configuration we have and so I’m going to be on guard.
Here’s what I’m seeing. The NYSE and SPX have come to exactly the 62% retrace level. The DOW has gone up a little higher. The Nasdaq has only retraced about 52% (that makes me a bit nervous). The waves up look to be in 3 waves (so they should retrace).
The euro is no longer in an ending diagonal (that’s a concern). It looks to have completed one wave down, which could actually be the first wave of a large retracement wave. The next wave would have to be up from here, which suggests a wave down in the equities.
However, I have a question as to whether equities could actually be in a larger, second wave. I’m going to study them a bit more tonight. I may post a video.
Let ES show us it’s going down. It could go down here in a B wave and do another wave up in a C wave to 62% of the entire wave down.
Dimitri,
I’ve flipped the count based on what the euro did today. I think everybody’s now in a second wave. What concerns me about that is that the DOW and SP500 are out-of-sync, but overall this seems to make more sense to me.
ES has done a new high tonight
ES and the euro did small ending diagonals. I was commenting tonight that every wave seems to end in an ending diagonal … they’re not even supposed to be in A waves … but they are in this market. It’s a very weird market.
I’ve posted an alternative chart of the SP500 tonight. I’m going to post a chart of the eurusd, which supports a second wave now.
I’ve also posted a chart of the euro. I would consider this the main count now. I think we’re in a second wave and it should play out as I’ve shown.
I’m doing an interview with Dale Pinkert of FX Street tomorrow morning at about 10:15 EST. I posted the link at the top of the post in case you’re interested.
Shitty market, jups…
Good luck Peet on the interview, make them all very SCARED, mwuahahaha! 😉
Cheers,
W
ES is now up doing yet a larger ending diagonal, or a double top. So it retraced everything from the past 7 hours or so. What a brutal market …
Go get some sleep my friend! 😉
Cheers,
W
And when I do, the market completely changes … like now. I haven’t had a lot of time to look at it, but it looks like the Nasdaq will open at the 62% retrace level. PLUS, the futures did a complete ending diagonal with an overthrow. This does not say “A wave” to me.
We’re going down today, but we could be back to my original forecast.
eurusd also did an ending diagonal (without the overthrow).
I will post a short update this morning.
Well, I’m staying away from this monster until it starts to make sense. Where this wave ends will give us a good idea what’s happening. I’m just getting back to the market after doing this morning’s interview and I see it still hasn’t finished its rally. I’m back on the fence, with a similar assessment to what I posted this morning. It’s strange to see a rally in a corrective wave like this (SP is up in 3 waves) for so long … But this wave is not long-term bullish.
It’s blasted past the ending diagonal to something else, but it still appears to be an A wave.
However, I note that the eur/usd has hardly moved. It will take me a bit to do as assessment of where we are this morning.
Nice interview, Peter,
SPX continues go up
Dimitri,
This is still a corrective wave and I think we’re going to top at the previous 4th, which will give us the first wave extension down that I’ve been looking for. This is less likely an A wave. In fact, I think we’re going to correct here in a fourth wave tonight and then do a fifth of fifth up to about 1941 or so in ES.
This wave seems unstoppable
I know. I was just telling Wouter that same thing. However, it has to correct here. It’s just being a pain. NQ is even worse!
I posted a chart of what I think the scenario is for the next week. We’ll see what André thinks of timing. This pullback should only be wave 4. We have a little more to go before the top of wave A.
We’re not even correcting! Next stop 1940, I think. We might do the B wave tomorrow, if I’m right …
We did one small wave up last night but I don’t have an accurate count. We may go right into a B wave but I’d want to see a lower high (or second wave). Euro/usd should reverse up at the same time.
Tomorrow is three witches day.
So, they should roll over the positions today or tomorrow.
You wouldn’t know it’s the same market today. I count the need for one more small wave up, but I’m not positive about that.
This looks like the fourth wave I was expecting last night. So I think one more 5th wave high before the real rollover.
Dimitri,
This action today for me puts the possibility of this being a wave 4 back at a higher probability. Futures are very obviously in 3 waves. That’s what cash seems to be building at the moment – a small b wave, large enough to make the entire wave up a 3 (right now, cash is a “1,” as they all went straight up).
But it doesn’t really have to if this is the A wave of a larger abc 2nd wave. The futures waves also already have two sets of five waves within them. They’re looking like a fairly complete combination.
There are others reasons I think this and they have to do with the shape of the first wave down. For example, the SPX was the only cash index to complete a fifth wave. However, that wave is not long enough. It is not 1.6 X the first wave and this is action that suggests it is only the first page of a longer wave. And the other cash indices are “out-of-sync.”
Todays’ action also brings up the notion that we seem to be completely out of steam and so we may have to have an extended fifth wave down, as going up will be difficult. We’ll see how the next 24 hours play out.
We’ll see if all three cash indices tag the previous fourth wave high and how the wave looks when they do. It obviously also has to do somewhat with timing.
When I look at the daily SPX it looks like it is finishing the 4th of the 3rd of the 3rd of the 1st.
It’s at the first glance whithout look at the inside structure
The up Gaps on the Cash SPX over the last 3 trading days is pretty incredible. I am trying to find another example of when something like this occurred.
Ted,
If you put all the unknowns with this wave together, it really has a big “STAY OUT” sign on it. We have a possible truncation and then none of the indices bottomed together and the SP in an ending diagonal … I’ve never, I don’t think, seen so many inconsistencies. It’s impossible to consider the wave down either complete or motive, so we may just have to let it play out.
I wonder whether this wave will correct all of the apparent wave 4, which would set it up for a very large drop. Something corrective is happening but not sure what it is at this point.
I will add that USDCAD looks to be putting in a double bottom on the chart, which would set it up for a big correction (both it and the euro are poised to turn). The turn on CAD may signal a turn in equities—something to watch.
Double tops in futures and a turn. We’ll see where it goes …
Hi Folks : )
I’ve been off planet for a while.
Some of you may remember I was looking for a launch of silver.
Now appears to be the time!! I won’t be surprised to see $20’s by the end of March..
Sorry.. no charts to back it up.. Last time I was in this mode was fall of 2010 when silver was ~$15.00
Best Regards ~~~
Gary (DC)
You should be right, Gary. It should follow gold. Gold should correct at about 1300 (B wave), then move up to 1600, before turning down towards 750. I have a long-term chart in the forum.
So this should be a corrective move up in silver.
I just updated the post and an ES chart as at right now.
I’ve just revised and added to today’s charts.
This is a counter trend move. 2/21 major vibration. Took a little longer than expected but next week will be down into early March at least. Yesterday a w4 today a w5. This is not a strong move; this cat is dead.
Cheers,
André
If you think we’re heading down right away, that supports my fourth wave scenario rather than a 2nd wave, which is my preference now. I think we’re going into a 5th wave. So, good enough. Thanks.
Tonight’s action pretty well confirms it, anyway. We have large ending diagonals now in eur/usd and usd/cad.
Hi Andre. When you mention w5, do you mean going up for small 5 of C of 4 of 1, or down into 5 of 1? Thank you.
I meant a small w5 of c up into the weekend. 2/21 is a distaster date.
Thanks, Andre! Much appreciated
Short text post at the top. I will do a full video and charts on the weekend.
I’ve added a chart. Forecasts for the euro and CAD haven’t changed. Nothing has been moving much at all over the past couple of days.
Peter,
do you still expect SPX to go to 1940 ?
If oil has turned already It should drag the market down
Well, we have to get to SPX 1929.73. We know that for sure. If we don’t get to 1946.57 SPX, then we’re left with an overlapping first wave down (of 5, which would otherwise be an ending diagonal), which doesn’t work. In fact, no other count works that I can see, unless we’re going to do a B wave and then a C wave to a larger second.
That’s why those two counts have been on the board for a week now. They’re the only two out there. The second wave scenario doesn’t require us to hit a new 4th wave high, but the fourth wave scenario does.
Based on what’s happened in the past 24 hours, and what currencies are doing (as I’ve explained), this wave up does not appear to be an A wave. So, it doesn’t leave much alternative.
If we break down before a new wave 4 high, we must be doing an abc second wave. That would surprise me based on the shape and length of the first wave down. It doesn’t make any sense to me from an EW perspective (due to the length of that ending ending diagonal, and the shape of waves in the other indices, and what currencies are now doing).
And … sigh … I’ve seen this pattern far too many times before. The fourth wave pattern has been the more obvious choice from the beginning, but trying to be objective, I’ve had two possible scenarios on the table. Both were possible. It comes down to probabilities. Recent action has made a second wave much lower probability.
Oil is partway through an ending diagonal and has a lot more downside to go. It finished the third wave, now working on a fourth. (I know I posted that chart somewhere recently, but I’ll put it in the forum this weekend).
“Trade what you see, not what you think.” Back to my mantra. 🙂
Peter –
Just to mess with us the fifth wave on this C of the 4 wave is going to truncate. 🙂
Ted,
I trust know the likelihood of that scenario … haha.
If it “truncates,” it’s an A wave. No question.
I’ll just add that USDCAD, EURUSD, and AUDUSD all have to bottom or top (depending on the pair) properly and that’s consistent with making a new high in the indices. I haven’t checked on GBP lately …
Just to make sure we’re on the same page, a 5th wave down has to be in motive waves (in 5). The wave down in all the indices and futures is in 3, so it would require a top.
Thanks, Peter
We wait to see what this market has to tell us … 🙂 A long wait.
I just posted a chart of eurusd (I changed the count somewhat as we’ve now retraced a fourth wave). It’s in the same position as equities (just the reverse).
New post live: https://worldcyclesinstitute.com/the-second-shoe-drops/
This website is for educational purposes relating to Elliott Wave, natural cycles, and the Quantum Revolution (Great Awakening). I welcome questions or comments about any of these subjects. Due to a heavy schedule, I may not have the time to answer questions that relate to my area of expertise.
I reserve the right to remove any comment that is deemed negative, is unhelpful, or off-topic. Such comments may be removed.
Want to comment? You need to be logged in to comment. You can register here.