
The waves are starting to get active again. Volatility is picking up. You might be asking yourself, “Is it time to get back in the water yet?”
This week should prove that it is in the US indices. It’s already proven so in oil. As I forecast, oil has started dropping to the $36.00 level.
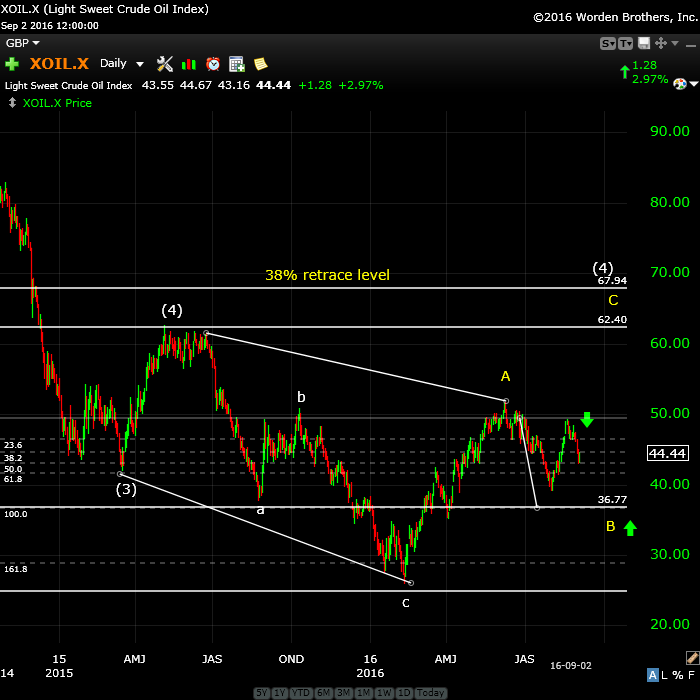
Above is the daily chart of US Oil showing the Elliott wave count so far. We’ve completed a large wave (3) down and then bounced into wave (4). The next wave down, which would have been (5), came down in 3 waves (abc), so it has to retrace the full length of the three wave drop and will likely do that to either the $62.40 level (the previous fourth) or the 38% retrace level from the very top, which is at about $68.00.
First, however, it has to finish this zigzag wave that we’re in the middle of now. I projected the turn down from approximately $50.00 last week and we look to have completed the first part of this drop. But we still have a ways to go to get to the target of $36-37.00. Once we reach that level, we should head back up again to the wave (4) level and one of the two targets I mentioned.
The US Indices
Expect volatility in the US indices this week.
I’ve been projecting a turn down from this third wave in this ending diagonal we have, and to that end, I’m posting a video I created for my Trader’s Gold members on August 26, which took a look at all the indices in terms of the current wave formation.
The ending diagonal formation is the only formation possible at these levels based up the wave configuration that’s unfolded from February 11, 2016. Here is a video that explains my current thinking in terms of the wave we should see ahead of us now.
 |
 |
Make sure you zoom the video to full size with frame expander (arrows) in the bottom right hand corner and also set the quality to as high as your web connection allows. This is an HD quality video so the best viewing is at that level. |
_______________________________
Deflation is Ramping Up
I watched the news tonight (can’t remember which US channel) and saw a story on the price of food. It’s dropping quite nicely. Of course, they made several excuses for this, but the main one is deflation—the phenomenon nobody is talking about. It’s just another sign of the depression we’re in the early stages of.
I just finished a video tonight on deflation and will be posting it live on the site within the next two days. Here’s the YouTube version. It’s short.
In the 1930’s food prices dropped dramatically and stayed low for years. It ruined the farming industry as it drove a lot of farmers into bankruptcy. The problem is demand, along with trade barriers, which are starting to crop up all over the place, just as they did in the Great Depression. We’ve also had the seventh largest shipping company in the world go into bankruptcy this past week.
Currencies are also going to come to bear as all the major currencies drop compared to the dollar. This will make imports less expensive that local food, in many cases. The US dollar is poised to head up quite high, while all the others that are pegged to the US dollar are going to head much lower.
It’s time to start taking deflation seriously. If you haven’t thought about some of the ramifications of spiralling deflation, here’s a short list of things to think about:
Food may be less expensivev, but as supply lines get interrupted, and business go into bankruptcy, many items will become scarce. There will be runs on supermarkets. I’m stocking up with a 6 month supply of freeze dried food from Mountain House, who through my research are the best tasting in the emergency freeze-dried food area. Many of their meals are absolutely delicious! Just add hot water. Here’s my local supplier, but you can search online for a supplier near you. Or simply start to stock up on items you know you’ll need.
If you can’t walk to fresh water where you live, then you should stock up on a supply, or develop a source for drinkable water should there be challenges with supplies. There is also the probability of pandemics that may limit you ability (or desire) to travel long distances. If you’re living in a large city, it’s particularly important to start thinking about worst case situations.
There are sites that focus on emergency preparations for difficult times. You can google “preppers” and you’ll find lots of them. There’s a book that’s been getting great reviews on Amazon that might be a great addition to your library: The Prepper’s Blueprint.
Sell what you don’t need now. If you have items that you’ve been thinking of getting rid of because you simply don’t use them anymore, hold a garage sale this fall, before the crash begins. Once we get into the middle of the crash, it will be difficult to sell many of these items, unless they’re in the category of what people need to survive.
Make sure you’re part of a tight-knit community. You’re going to need your friends to help get you through the next 5-10 years. There will likely be shortages of medicines, food, and a whole lot of other necessities. There’ll be a shortage of jobs, as well, and the barter system will likely come back into widespread use. If you have talents in building, creating, or otherwise supporting a community in times of need, you’ll do very well.
Credit will dry up. Banks will go bankrupt. Make sure you have some cash on hand and keep a watchful eye on the banking system. We have a public bank in my province: Alberta Treasury Branches. There’s one public bank in the US, in North Dakota. These were the banks that thrived during “The Great Recession of 2008.” They will likely do so again, as they’re backed by the population, and not private “banksters.” A wonderful book that tells the whole story about private and public banks is, The Public Book Solution, by Ellen Brown. I highly recommend it.
Rent rather than buy. This extends from housing right through to just about everything. However, at the bottom of the market (in 5 years, or so), the cost of everything will be at rock bottom and it will be time to purchase the home of your dreams for pennies on the current dollar.
Power may also be an issue. A portable generator is a great idea and can be had for under $1,000.00. I’ll be posting my favorites in the forum shortly. Since I’ve now finished all the videos I had recorded weeks ago, my attention is now turning to finishing my book and populating the forum with some lasting information that will become more and more important in planning for the coming years.
Finally, you want to start thinking about putting away some silver or gold coins. Both these commodities will become less expensive over the coming month or two. They should dip briefly and then head up as the US market crashes. However, over the next few years, as deflation takes hold, they will become even less expensive than they are now. If you have any concerns about the government making it more difficult to acquire these commodities, it might be a good idea to begin to put a little bit away over the next couple of months and accumulate more at a later date. When we get to the hyperinflation stage, which is speculative, for sure, you’ll want to make sure you have some with a lot more “strength” than cash.
Stick around. I’ll let you know when I think the opportunities are the best to acquire either gold of silver coins.


Hard to understand how oil drops then pops while market does the opposite over the next month.
Thank you , Peter….Nick
Peter,
The following relates to the NYSE Elliott wave count detailed in your August 26, 2016 video…in an effort to better understand your reasoning I carefully examined the NYSE since the January 20, 2016 low (8937.99)…as a result, the following alternative Elliott wave count is offered for consideration/discussion:
February 1 high (9,651.20) – wave 1
February 11 low (8,944.05) – wave 2
June 8 high (10,648.05 ) – wave 3
June 16 low (10,166.98) – wave a
June 23 high (10,641.17) – wave b
June 27 low (9,918.72) – wave c/wave 4
August 15 high (10,892.15) – wave 5
Regards, rotrot
It’s an illegal count, of course, just to be clear.
“Illegal”…should I turn myself in??
You should spend at least a year in solitary in Mr. Elliott’s internment camp … lol.
Sorry for rather curt reply, but your count breaks the most basic EW rules and I wasn’t sure your point in suggesting it. I don’t know how much you know about EW. So not sure how to respond. For starters, you can’t mix motive (numbers) and corrective (letters) the way you have. As a result, you’ve presented a count for a corrective wave by default, which is indeed what it is, but as such, it needs two waves of 5 on each side of the B wave (your abc wave).
I’m not sure if this helps, or not. The bottom line is your count can’t be corrective AND motive, which is what you’ve suggested.
only included the letters to show the abc form of my suggested wave 4…disregard the letters…?
The size of wave 4 makes it corrective. And the subwaves are not motive. So there several reasons it’s corrective.
thanks…this exercise has been informative…appreciate your time and assistance…on another note, is the email notification of comments available for ‘Making Waves’?
Oh, isn’t that interesting … I guess not. Well, let me look into that tonight. Maybe I have to set it for every post … news to me. I just love technology. Can’t wait to get up in the morning … 🙂
Thanks for the head’s up.
rotrot,
I think I have to go some surgery on it, so it’s going to have to wait until tomorrow when I’m a little “fresher.”
Determining the wave count and certainly whether it’s motive or not has as much to do with “the look” of the wave as it does the number of waves. If the second and fourth are not balanced (somewhat the same size in relation to each other) and the subwaves are not in place, then it’s not motive. There are actually quite a few rules it needs to abide by to be motive. If it doesn’t then it’s definitely corrective.
The Man-Made Money Cycle video (new) is only on YouTube at the moment. It’s here, if you’re interested. Only about 6 mins. https://youtu.be/hzFG-KIoFDM
Peet!
I watched the video and as always, SUBLIME stuff! 🙂 I just sent the video to my wife, parents, father in law and my brother. I hope that they will somehow realize I am not talking shit because you (as an expert) are saying the same stuff with of course a better explanation since you know the ins and outs of everything. 😉
Cheers,
W
Thanks – a couple of days work there … 🙂
Rare triple negative PALS this week (Phase post NM, Apogee Wed., Declination heading past equator to S). Looking to the short side =)
Valley, could please translate that for me?
Regards-Ed
Mid phase is when middle days between NM and FM. Declination is a term that refers to the moon moving back and forth across equator every 14 days. Apogee is moons greatest distance which happens on Wed..
Phase effects can be found with Danny at Lunatic Trader. Declination effects summary by Olga Morales site. Apogee effects is something I have studied (selling day before apogee at close on Dow, and buying back third trading day after yields about 8% per year over 18 years of data).
Wow! Thanks for the explanation and your time!
Valley, I googled apogees for 2016 and the site listed all the apogees for 2016! It had September 6th, today. For clarification…using that date you would have taken a short position at today’s close. You mention Wednesday as the apogee…Just trying to understand. Btw I went to the Lunatic Trader site…I am afraid it is above my head! Ha
Ed
Yes, A was on the 6th. My mistake.
APD gives low 9/12 but 9/8 strong vibration. Doesn’t change anything. So tomorrow down. Real volatility comes 9/19. This is really the end date.
André
Andre, I don’t know if you know of or follow Martin Armstrong but in his following post :
https://www.armstrongeconomics.com/armstrongeconomics101/understanding-cycles/the-infamous-labor-day-event-in-markets/
He mentions the 12 Sept and 19th Sept dates as turning points picked out by his ‘computer – Socrates’!! Ha it’s all coming together.
Ah! Now that is what I mean with vibrations 😉
ECB meeting on Thursday, September 8…
https://www.ecb.europa.eu/press/calendars/mgcgc/html/index.en.html
Andre, I am not familiar with what APD stands for or means…and do not know your meaning of vibrations! Does the that term mean volatility? From reading your comments for weeks…Would it be correct to say that you are looking for a “important” top on September 19th but that yesterday’s rally peak is more or less the turn date? Not looking for investment advice…just trying to understand!
APD stands for André’s power dates. What vibrations are is too deep for now.
Yes, 9/19 will be the final high. 9/5 was an APD high (see the list I posted some weeks ago). 9/5 was laborday so S&P gave a high 9/6. But 9/8 is also a strong day so the market is more or less flat. Tomorrow we will turn down into 9/12 (APD low) and then we will see one last exhaustion cycle into the major 9/19. After that we are down into spring 2017. No trading advice, just my thinking.
We are on the same page A however, I think that the October time frame which Peter mentions, might be the better timing in search for the top of wave 5 of the Ending Diagonal. 😉
Cheers,
W
We’ve now seen a record in terms of the tightness of this trading range.
http://www.zerohedge.com/news/2016-09-07/stocks-trading-range-now-beyond-compare
Andre’ and others interested in vibrations.
9 = endings
9th day of 9th month of 2016 =9
It’s all just good fun, let’s see what happens (and no, I’m not talking about it being Friday and the end of the week).
‘999’ – Olga Morales, September 7, 2016
https://astrologyforganntraders.wordpress.com/2016/09/08/999/
Rotrot and/or Steve…
What is the significance of 999? What is the implication? Is the implication a change or shift from bullish energy to bearish energy? I have very little exposure to the planetary influences on the markets!
Ed,
In numerology, 9 is the number of endings, of course to be followed by a new beginning, 1. This is different than astrology, but definitely related, as all things are vibrational. When there is a series or group of 9’s it implies nearing completion, and another level (higher or lower ) is set to begin. There is a very long and ancient tradition, from the Jewish Qabbala (Kabala) to the Tarot to numerology. There are numbers 1-9, that is all, no 10 or 0. For numbers with more than 1 digit, you add the individual numbers and reduce, so 2016=9. Numbers simply represent vibrational frequency, are the language of GOD, and this can then be taken further to the work that Andre’ is doing. Books and books are written on the subject, and I would encourage you to look into it. Its fun.
Thanks Steve! You are correct about it being interesting!
The Market Timing Report (free video release) has Sept 9th as a turn date. Interesting
john,
Where did you find that online? I’m unaware of it.
Week Ending 9th December 2016 (believe this is the most recent free video)
http://markettimingreport.com/december-upcoming-cycles/?inf_contact_key=4288b0f0e19fe35c249d693cfe4a7f103c1ceb60c0614563f2e92f6352a12d68
That one promotes December 9, not September 9, so I’m confused. But maybe that was just a mistake by John (?)
Don’t know if you noticed my comment on the subscribe to comments plugin. It’s back … for the moment, hopefully much longer.
gotcha…thanks!
“Week Ending 9th September 2016…S&P500 together with a whole series of global markets are likely to change trend”
http://markettimingreport.com/september-upcoming-cycles/?inf_contact_key=0494652a3396e62fb878cad6165b708205e07fea811ab7b332854659ec366741
rotrot July 9, 2016, 6:40 pm
Andy Pancholi free videos…
https://worldcyclesinstitute.com/see-you-in-september/#comment-9014
The Sept 9 date is not consistent with his Sept document and it’s the same video, just different dates, so I’m not sure what’s going on.
marketing…
I managed to find an old version of the “Subscribe to Comments” plugin I was using to let you follow new comments.
Hopefully this will get us back on track until the developer fixes the newer version.
I got it in an email about two weeks ago, if I can find it I will post it
Could not find the video, but it was the same as the December 9th turn date he released but was Sept. 9th. Maybe I mis-remembered (should be a politician)
Panic of 1837 – Pancholi & Armstrong
http://cyclesanalysis.evsuite.com/the-most-critical-time-cycles-ahead-optimized/?inf_contact_key=f01f785379d81141728a0a269bc1ff7f7f454db4d3eaea2bef0e9f93f8051fa3
https://www.armstrongeconomics.com/world-news/sovereign-debt-crisis/can-illinois-go-bankrupt-or-just-default/
There is a lot of confusion out there about vibrations and – thus – cycles. I see a lot of analysts that found their own briljant cycles. Well; they are all wrong. This weekend I’ll explain the only reliable cycle structure and how that explains what the market is doing. And how this is tied to vibrations. And that vibrations is not about the Beach Boys but about quantum physics. And I may end the post with a forecast to a 2023-24 low in this bearmarket. Stay tuned.
NOT ABOUT THE BEACH BOYS??? MAN YOU ARE BREAKING MY HEART! ><
Haha A, amazing stuff and looking forward as always! I know you are right about the quantum physics, I believe in this stuff as well! Elliot Wave and Gann (probably forgetting some heroes) are just very smart people that found a great method so a human could make money in the markets. 😉
Cheers,
W
http://www.zerohedge.com/news/2016-09-08/wells-fargo-fires-5300-engaging-massive-fraud-creating-over-2-million-fake-accounts
If this isn’t a w5 I don’t understand EW.
For the numerology fans : we’ll have 3 9-9-9 days this month: 9/9, 9/18 and 9/27.
My cycle dates gave a high 9/19 and a low 9/27. Numbers are vibrations. Very Pythagoras.
This post is going to have to be in 2 parts as I’ve got 2 images to include and it would otherwise mean having to get Peter to do additional work in authorising it:
————–
The following was the chart I posted back on August 15th:
https://postimg.org/image/pgurijw6x/
As it’s clear from the chart and the discussions Peter and I have had regarding this count that I differ from his point of view.
The point on the chart marked as ‘v=c=B’ (top right) did seem at the time a valid small degree 5 wave count and I was since expecting the rapid decline. Clearly that didn’t happen and instead the market’s gone side ways.
———
See below for follow on comment.
Part 2 of post :
————-
So here is my updated count from the 27 June low
https://postimg.org/image/9209hehf3/
As far as I can tell all that’s happened is we’ve built a triangle. Now turning to Andre’s dates of 5th Sept & 12th Sept. The 5th was a high and if 12th Sept is going to be a low then I believe we should get the final leg of wave ‘d’ on my chart today and then head down to the ‘e’ wave by/on the 12th. Thereafter we head back up to ‘v=c=B’ for the 19th Sept before all hell breaks loose.
The ‘break down point’ for this prognosis if the down wave that started yesterday continues below ‘c’.
All of the charts are for the DJIA.
GL to all.
There is a ‘fly in the ointment’ in that wave iv (the triangle) is MASSIVELY large in time compared to wave ii. Anomaly’s like that can exist BUT I don’t like them.
Ha!! So much for my prognosis.
I really should learn to keep my ‘trap shut’ every time I have the urge to mention ‘triangles’!!
You can always use the forum. That’s what it’s there for. 🙂
Aaah!! For some reason I got it in my head that once the paid service had started the forum was only for registered users.
I’ll need to do some ‘research’ on how to use that venue.
Thx
If no one is looking, Andre’s dates are working out very good, 9/12is next…nick
I am looking…and it is amazing! A big “thank you” to Andre!!
Fun bearish prediction for the rest of the day. We close today, near May 2015’s high of 2135 on SPX and then hit the lower trendline of the ending diagonal on Monday (~2094) to coincide with Andre’s low. Before heading back up. 2.618 fib ratio of of the 8/15 high to the 9/1/2016 low based on Wednesday high also gets us to 2094.
looking good today
https://postimg.org/image/9d9re1fzd/
Thanks Tom,
Nice Chart do you have a longer view (Oktober)?
This looks like a large break to me. Unfortunately I have said the same thing 3 or 4 times over the last 2 or 3 years at 1st appearing correct only to be blown out of the water very quickly. Maybe buying the dip this time will finally be catching the falling knife.
Mercury moves between Sun and Earth this weekend: “Mercury Inferior Conjunction”. Days preceding and following this often have negative market performance and volatility. Next week PALS is very positive, pre Full moon, post Apogee by 5 days, and post Southern most declination. However, September seasonals are worst of year, and I am reluctant to buy so close to the M.I.C.. So will take the gains from shorting today, and remain in cash into next week to see if further selling makes a long position possible.
Valley, just a ‘CONGRATS’ on your call that this week the PALS were very negative on 3 fronts.
I’d say you NAILED that one!!
Thanks, Purvez! My two neurons finally got in sync =)
About vibrations.
Pythagoras found the harmonical structure in music; when you half the length of the string : same note but one octave higher. Music is number and number is vibration.
Mendeleev found the harmonical structure in elements and atom weight. With this, he was able to predict the existence of some elements that were unknown in his day, simply because the harmonical order said there was a vibration and vibrations always materialize. Indeed, many years later all these elements – like Gallium- were found. Duh!
Mendeleev called it a periodic table, but that is the same as harmonical.
The harmonics in elements and music are basically the same; they simply are in everything. This harmonical order is part of the design of our universe.
From music we get the 17 year cycle. And with the harmonical order I can predict – like Mendeleev – the existence of a 34 year cycle and of a 68 year cycle. I see many analysts with all kinds of exotic cycles. But I can tell you that when the cycle is not harmonical, it doesn’t exist. Little example? In 1815 we had the largest vulcano eruption in history: Tambora. Add 68 years and we get 1883. That year Krakatau exploded. Two major eruptions, seperated by a 68 year cycle. A trine in this cycle is 22,6 year. Add this to 1815 and we get 1837; a major financial crisis. So financial panic is tied to vulcanic eruptions. No wonder; it;s all the same vibration. 1932 low + 34 is 1966 high + 34 is 2000 high.
Why is finding cycles so hard? Price is a liar! Torque is much better, This concept comes from Garret. Torque reveals the real cycle. 5/20/15 may have been a price high, but torque was highest 12/30/15. This was the cycle high. The ATH 8/15 was higher in price but lower in torque. So the market confirms what we know; the longer trend is already down. Looking at price you can’t see this and everybody is looking at price; they don’t have a clue.
My dasha system based on the nyse birthdate was bullish into 8/26, 8/29 showed the highest torque since april. So the dasha is vibrational and the dasha is bearish into march 2017,
But first we need to test 9/19. The august 2015 low was significant and 120 degrees in HC Jupiter from the 2011 low. 150 degrees gives 9/18. Then HC Mars is 240 degrees from the may high. This is a 90 degree J/M angle.
What price will do I can’t say. Could be a retrace or a double top. But it will all be within a long term downtrend. I now have the road map for the bearmarket. The low will be between the end of 2023 and mid 2024, More details in another post.
The first major low will be spring 2017. I have given 3/25 before and still think this is a strong date. But looking at everything I should give a range, from mid February till early april. Once we get closer we can fine-tune this.
Post is already too long and still so much to share. My powerdates give a low 9/12 but 9/14-15 is also strong and will cause the ABC up move.
Have a nice weekend.
André
Andre….YOU ARE AMAZING!! OK with that out of the way….
You’ve now introduced the concept of ‘torque’. What is that please? Just in broad terms if it’s proprietary, please. Would you be able to give us ‘torque’ levels here even if you are not able to share it’s calculation?
Your information gets more and more interesting.
Many thanks.
Here’s something else I’d like to throw into the mix about what Andre said about 17 year cycles.
Martin Armstrong (google him if necessary) has been talking about the 8.6 year cycle. Well twice that is the 17.2 year cycle which is what I’m ‘guessing’ andre is referring to.
Now if you take the 8.6 year cycle and break it down into an Elliot Wave configuration (5/8ths 3/8ths) you get 5.375 and 3.225.
Since (I hope) human’s also vibrate (at least the live ones) I have been analysing human being’s cycles on a 5/3/5/3/5 (5 waves) or a 5/3/5 (3 waves) basis to determine whether people have positive or negative cycles in their lives.
So far I have analysed mine (of course) my wife’s and son and both my parents and in laws and a number of others and I can say that they all fall into one of the 5/3/5 type patterns. i.e. your first wave is either (5.375+3.225+5.375+3.225+5.375) i.e. 22.375 years long or (5.375+3.325+5.375) i.e. 13.975 from birth. Thereafter it depends on where in the cycle things are.
My findings are uncannily scary. I haven’t discussed this with anyone within the family although I now have a fairly good idea of which are going to be mine, my wife’s and my son’s good / bad years ahead.
I don’t know if anyone is aware of or is on the same lines and if they are then I would welcome further links / discussions on this topic.
Thanks
Purvez
Uh Oops that 22.375 figure in the above comment should be 22.575. Apologies….but I hope you all got that before I did!!
Purvez,
I have done similar, although you took it a step or two further. My life has run in 8.6 year cycles, and they tend to alternate, good and bad. I have just start a good cycle, thank god, the last was brutal. But it is good to know, when all is closing in around you, that there is hope and a purpose for all the pain.
Steve
Purvez,
I have done similar, with 8.6 years. They alternate, good then bad then good. I’m starting a good one last in August 2015. Know the alteration helps in attitude, the last 8.6 for me was brutally bad, but knowing the end was near, and seeing the overall purpose of cycles (to squeeze out the stupid stuff) really helps with the attitude staying positive.
Steve
Steve, interesting that you are managing to see an 8.6 cycle of good and bad. I tried calibrating my life till now with just the 8.6 and got conflicting results. However good to know that you’ve started a positive cycle. Given that the last one was ‘brutal’ then it may well have been the last in a series of ever increasing bad ones. Not saying you won’t have down cycles from now on but they’ll be far less ‘brutal’ hopefully.
Good Luck.
Hello, Purvez, What you describe sounds absolutely fascinating. But I have difficulty imaging how to draw such a graph. Vertical axis would be how good/bad I feel? And would everyone born on same date have a similar sequence of 5’s and 3’s? Apologies if this comes across as garbled, but I think you are on to something, and I would love to explore this idea. Perhaps an example using a fictional person’s life events/timeline would help me be clear, if it’s not too much trouble?
Hi Philip, the way I envisage the vertical axis is based on life experiences which I suppose boil down to feelings at the end of the day. However the good or bad experiences could be in a number of different areas. e.g. Finance, career, relationships, health etc. I think most of us can say that a particular period in their lives was ‘over all’ good or bad, however one chooses to define good or bad. Also relative to other periods how much ‘more’ good or bad it was.
I’ve only started out thinking about this concept for about 18 months and so far my sample size is extremely small. So questions like whether everyone born on the same date would have the same cycles is not something I can answer.
I will give you an example which is a real life one. I have a friend who is currently 65 year’s old. He is a self made very successful millionaire and a very happy and contented family man. No airs or graces. A tee-totaler, non-smoker and physically quite fit throughout.
The reason I got interested in his life is that soon after he turned 60 he was diagnosed with cancer and had to have major surgery. He is currently in remission.
Without actually telling him why I got to know his life. He had a happy childhood and got married early at 22 in India. He then came to the UK and had quite a struggle establishing himself. Various business ventures either failed or gave him lots of problems. He is not precise on the period but he seems to remember that around the late 30’s he started to gain traction with the business. Since then he’s gone from strength to strength. He has 2 sons whom he got married whilst he was in his mid-50s and has a number of grand children 2 of whom were born before his 59th birthday.
So using my crude system I would say that he had a 5 wave cycle of total 22.575 of good years followed by a 13.975 of difficult years and then another 22.575 of VERY GOOD years. It is clear from talking to him that the second period of 22.575 years was significantly better than the first period of his life.
The sudden and unexpected appearance of the cancer soon after he completed his 3rd wave on an otherwise fit and healthy person is ‘spooky’ to say the least. This is where it gets interesting. I have no way of telling whether the 3 waves of his life represent an ‘ABC’ up wave or are part of a larger 5 wave structure and he is currently in his 4th of the 5 waves. If it’s a 4th then he has another 7 and a bit years of health troubles from which he’ll almost certainly recover and then he can look forward to a nice period of dotage from around age 73+ for another 22+ years.
If unfortunately his first 3 waves represent an ‘ABC’ then he has a long period of health problems and may not even survive the new down wave which would last 22+ years.
I for one sincerely hope it’s a 4th for he is a wonderfully kind and generous person.
The 5-3-5 structure brings the biggest question mark because currently I can’t think of a way of telling whether the wave is complete and a new wave in the opposite direction is going to start or there’ll be a 4th and 5th in the ‘over all’ same direction.
Right now I have very little data and a host of questions but I’m open to further discussion and research.
Sorry for the long comment here.
Hello, Purvez, thank you for your reply that was chock full of detail, and has me even more curious about the possibilities of your brainchild.
I tried to reply to your reply, but no link was available, so I hope you will be able to see this reply post.
The example you gave of your friend’s situation really helped me understand – thank you, and I share your hope that it is a W4 that is short and shallow that he is in now, and he emerges soon for a glorious W5 up.
A few thoughts prompted by your post:
-Could it be a lifetime EW chart is an aggregation of several EW charts for major areas of our lives: career, romance, wealth, health, happiness, etc? Each chart has a different cycle length. They weave in and out, having amplifying or cancelling effects on each other. For eg, Career could be a 5 year cycle, Health a 15 year cycle. Romance could be a 7 year cycle, since there is something called a 7 year itch?
-Interacting cycles. A person facing romance on a W3 up finds also their health and energy levels high (because this cycle lags the romance cycle?), while a person facing retrenchment after 5 waves up of career success could soon see stresses on his mental health and marital life, but only after some time from first losing his job?
-It would be strange if everyone had similar periods to each of their cycles. Rather like saying that everyone born in the Chinese year of the Rat would have very similar life outcomes, which I know to be untrue looking at the schoolmates I grew up with, all the same age, but in very very different places today.
– I have heard of Chinese astrologers who warn people to beware of certain periods of their lives (often in blocks of 12 years). For example, in a particular block, the person should be vigilant about serious health problems, and once that block is past, if the person has held out well, has good health to look forward to in the following block. Same goes for finances and relationships. These forecasts are very specific to the individual, with lots of calculations that start with the inputs of date and time of birth, and gender.
Thank you for raising this fascinating application of EW!
Purvez,
I learned it from Garret, so no reason to be secretive about it. Torque is simply price divided by volume. As volume on S&p is massive I use volume divided by 1 million.
You will see directly that high’s and lows in torque are different than in price. I now use my gann tools on torque dates and the result is mind boggling. I think Gann was great but price is lousy as input. Torque dates are cycle dates and that is what you want to see. I even used the square root method on torque and found that the 2007 high torque gave 5/20/15.
Wow!! Thanks Andre. I see what you mean about torque and how it is the ‘more important’ element in the cycle.
Thanks very much.
Hi Andre, very interesting stuff. Can you give an example how you calculate torque with square if nine ? Thanks for your explanations and time to educate people on this matter. Regards,jaze
Jaze,
I calculated the square root on torque. This is a very basic Gann technique.
Andre, With all that said, could 9/19 be a lower high , than 9/5, then continue down ?? Thanks nick..
The market is very weak now so a lower high is most likely. But it will be the last serious high and that could result in an overshoot or short squeeze. So the ATH stands as this was a Saturn cycle. And this should have been a 2015 high so Saturn was in an overthrow to reach august. The Jupiter and Venus cycle and the dasha gave support into the 9/3-4 weekend. That is all gone. A double top with 9/5 wouldn’t surprise me, but no guarantees. The timing is certain, however.
Just my thoughts; no trading advice 😉
Andre your timing is excellent and probably the best I’ve seen. Only thing that is bugging me is that your call for a 9/19 final top doesn’t fit with Peters Elliot wave analysis unless we get a further drop on Monday to around 2100 S&P and then a rally to a new ATH by 9/19 to complete the ending diagonal.
Qwertyqwer26
I just show what my system tells me. Let’s see what Peter posts tonight. If we would agree on everything, there would be no point in posting. By showing an alternative we can all learn. BUT; I have good reasons to expect a high! We’ll see.
Cheers,
André
Thanks Andre , very clear , we [you and I ] go back a ways. We would converse over on John Hampton’s site ” Solar cycles” a few years back… Nick
Too bad John doesn’t post anymore,
Yes indeed, a number of us were on John Hampson’s site and then gravitated here.
Hope John is well. I think the last thing he posted was he was going back for recuperation.
My bearmarket road map is based on the 1974 low. Simply because it is 8.5 years after the 1966 high and thus the midpoint of a 17 year cycle. This makes it very vibrational. (2 is vibrational; remember music).
The dow 1974 close price is used for timing. 4/27 is the start of my bearmarket.
6/27 was a low and 8 /27 a high; 2 month cycles.
The 1974 price cycle has a midpoint 9/22. Now we see how vibrations work. 9/22 is very vibrational, SO the FOMC meeting is 9/21. This meeting is just an expression of the same vibrations. You allways find major worldly events near vibrational points because everything is the vibrations.
Whatever the FED will say; it will be a capitulation date and we are finally starting the down move. My power dates give 9/19 so I expect a pull up into 9/22 with a w3 down next.
If you look at sunspots you will see march 2016 was a peak in sunspots. Even the sun responds to the vibration. But that shouldn’t be a surprise by now.
https://worldcyclesinstitute.com/making-waves/#comment-11319
Olga Morales appears to be in agreement…in her September 10 post she wrote, “I see more RED…22/23rd September”…the market may not like whatever the FOMC does and/or says…be well!
Great cycle work
yes- Armstrong cycles 8.6 and 17.2 — use them for real estate also.
The bigger cycle for stocks is 87 years from Spt8th to Spt3rd, 1929 and the start of the 29 crash. 1929 + 29 = 1958 -NO CRASH but there was a recession.
1958 + 29 = 1987 CRASH + 29 years = 2016 CRASH ???? probably not.
AS NOTED by some one else cycles ALTERNATE.
LAST WEEKEND I told my group to expect SEPT 9th to 13th to experience a severe sell off. THUS, ITS NOT DONE YET.
AS FAR AS TRACKING stock price Swings, I posted a review of SEPT to date.
Later
Jay
A new post is live at https://worldcyclesinstitute.com/wound-up-tight/
This website is for educational purposes relating to Elliott Wave, natural cycles, and the Quantum Revolution (Great Awakening). I welcome questions or comments about any of these subjects. Due to a heavy schedule, I may not have the time to answer questions that relate to my area of expertise.
I reserve the right to remove any comment that is deemed negative, is unhelpful, or off-topic. Such comments may be removed.
Want to comment? You need to be logged in to comment. You can register here.