
I’m not a big fan of ending diagonals. I’ve said it before and I’ll say it again: They’re my least favorite pattern.
There are virtually no rules. The waves within them are in 3’s and so subwaves can end without warning, even though they appear to be in the middle of a smaller pattern. The subwaves can also take a variety of paths, so you can never be quite sure what to expect.
This week, I was focussed on a small ending diagonal that has appeared to have failed. That’s not a truncation, because the larger wave is the third wave of an ending diagonal itself, so it’s got to be a wave in 3 waves, and can end any way it wants to.
Over the past week or so, I’ve rethought the overall larger pattern and I present it to you here. You’ll find this same pattern on all the major US indices.
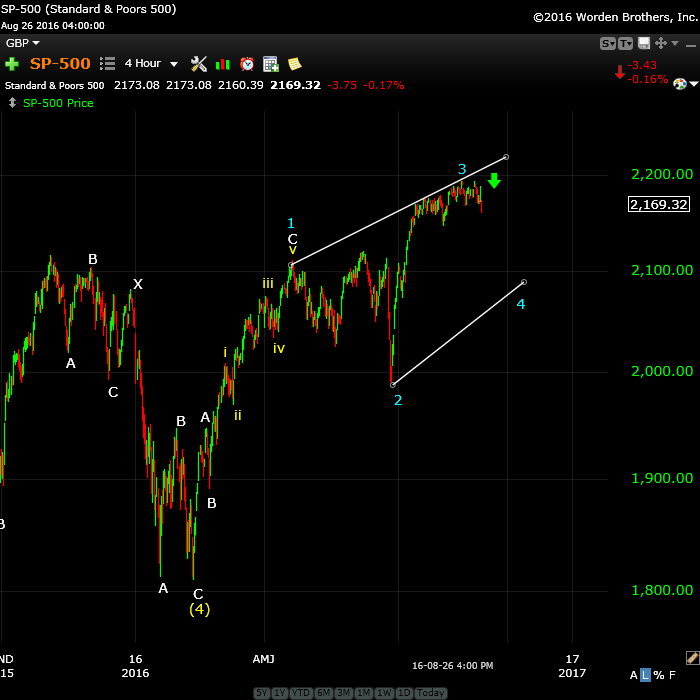
Above is a four hour chart of the SP500. You can clearly see the shape of the wave up from Feb. 11 as an abc corrective wave—a wave 3. Waves in 3 can only be triangles and in the fifth wave position, there is only one triangle available in the Elliott Wave library—an ending diagonal. I’ve maintained this was the pattern from about May of this year. Here we’re seeing it come to fruition. Because even though you may suspect an ending diagonal, as Robert Prechter says, identifying it may not happen until the final waves are taking shape.
We look like we’re about to start on the fourth wave, which may end up giving us about 100 points of down. The fourth wave has to overlap the first wave, so it has to drop below about 2110. The downside is a lot tougher to gauge. The lower trendline needs to slope in such as way that it converges with the upper trendline, so it can only drop so far, which presents a time element and the lower trendline is sloping upwards.
In any event, this pattern, with the eventual blow-off wave to the top, looks like it’s destined to top altogether within the next couple of months. It will be a dramatic reversal. Historically, October tends to be the month that major market tops take place.
That gives Wall Street enough time to get fully back in trading form and full invested.
_______________________
How Climate Parallels the Market and Forecasts Revolution and Unrest
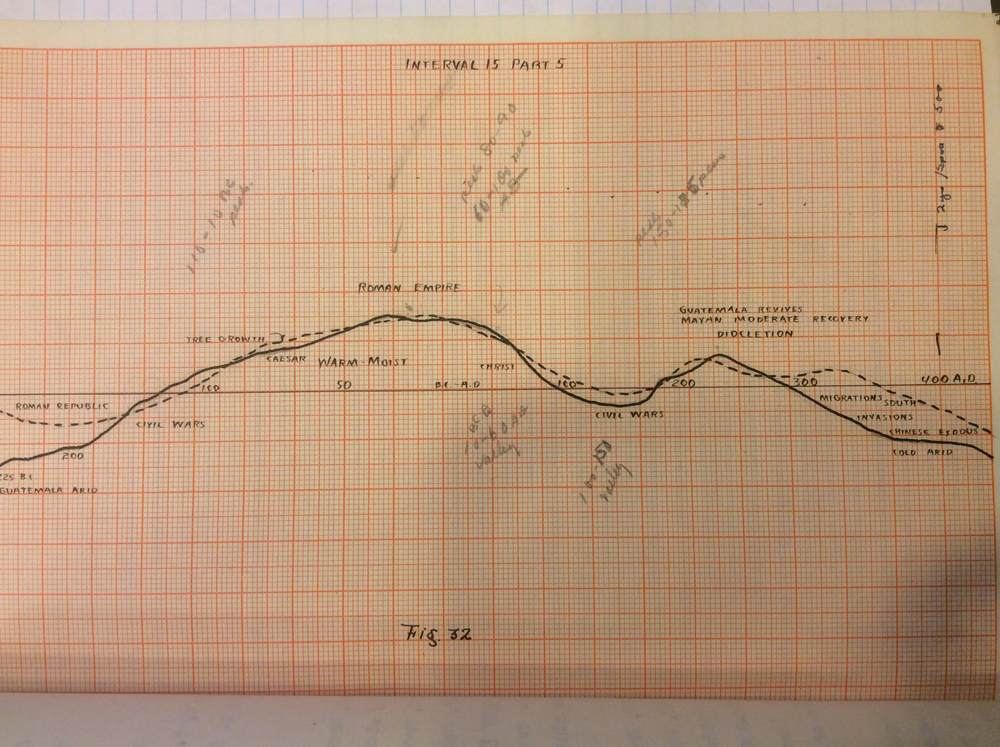
Last week I wrote about Dr. Raymond Wheeler and his ability to predict climate into the future and showed a chart of the current time period. Above is another chart of Dr. Wheeler’s that I discovered in his original writings at Baruch College in New York a couple of months ago. This one shows the temperature fluctuations at the height of the Roman Empire and the coming of Christ. The same pattern is playing out today; It’s pattern that returns every 500 years as the temperature on Earth reaches a cycle high and then turns down again. There is always a market crash that accompanies this cycle top.
At the time of Christ, the Roman Empire had reached its peak and was beginning a decline. Empires decline when the temperature turns colder. It begins with a warm, moist period (often with floods) and then gradually turns colder and drier. Caesar ruled at the heigh of the Roman Empire, of course, and was assassinated at the end of his reign (thanks Brutus!). After the peak in temperature, the empire began to fall apart through civil wars, and unrest.
The emperor Augustus (ruled 27 BC – AD 14) was a dictator and presided over major wars on the Empire’s borders. Persecution of Christians went on for some time as the empire began to fall apart. Next up were Tiberius and then Caligula. Caligula was assassinated, as were so many other rulers of the following period of decline. (Note: there were two calendars in operation at this time, so some dates differ by a year or two).
Temperature had already turned colder. Caligula reigned from AD 12 – 41 and is remembered for his cruelty, sadism, extravagance, and sexual perversity, presenting him as an insane tyrant (a theme of colder climates). Claudius (41 – 54 AD) followed as the next emporer, but although a kinder autocrat, had great difficulties ruling and was eventually murdered by his wife.
Nero followed, generally viewed as compulsive and corrupt (AD 37 – 68). Temperature continued to drop. Rome virtually burned to the ground during his reign (AD 64). He also began the First Jewish-Roman War, often called “The Great Revolt.” It was a time of continual revolution and revolt in various regions of the empire. His death (suicide) led to a period of civil war.
In AD 69, four emperors ruled in succession. Major unrest and rebellions continued. Domitian followed and is described as and autocrat and despot. He was finally assassinated in AD 96. Nerva then came to power and was the first Roman Emperor to be elected by the Senate. so we start to see autocratic rule changing into a more democratic approach. This is an ongoing theme during these intense periods of revolution. Democracy tends to eventually get a new lease of life, but it’s not an easy journey, and in fact, this was a little ray of hope in a much longer road into authoritarianism.
Trajan (98 – 117 AD), the next emperor, began an expansionary phase and brought the empire to its maximum territorial extent. Hadrian (117 – 138 AD) followed and is best known for Hadrian’s Wall, a defensive fortification in Britannia (Britain), built “to keep out the barbarians.” Ring a bell? It was the northern limit of the Roman Empire (in Britain). He presided over The Second Jewish-Roman War.
Wars and revolts continued through the dual reign of Marcus Aurelius (161 – 180 AD) and Lucius Verus. Aurelius’ reign was marked by continuous warfare—with typically accompanies colder times. The Roman coin was highly devalued (inflation) and the Roman Empire continued to crumble, with the Germanic tribes threatening the borders.
The Denarius was the Roman coin which, when originally minted, was about 90% silver. By the time Marcus Aurelius was emperor, it was down to 75% silver.
Commodus (AD 180-192) further devalued the Roman coin (more inflation). He was the emperor that promoted gladiators and actually took part himself in gladiatorial games to entertain the people (keep them occupied and they won’t see the deterioration around them). His reign was rife with conspiracies and assassination attempts. This marked the bottom of the cold period.
Then we had the tumultuous Year of the Five Emperors (AD 193). Enough said.
Caracalla (AD 198-217) further devalued the denarius by doubling the face value of the coin (calling it the antoninianus), which effectively reduced the silver by half again to 37%.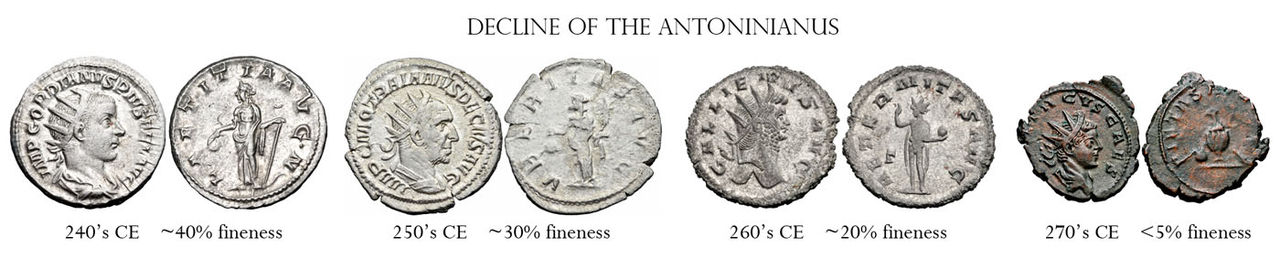
The Roman Empire from there gradually descended into the Crisis of the Third Century (AD 235-284), where it nearly collapsed under the combined pressures of invasion, civil war, plague, and economic depression. During this period, there were about 50 emperors. Most of them were murdered, assassinated, or killed in battle.
By the time Gallienus (AD 253-260) came to power, the coins contained barely 5% silver. He also raised the pay of soldiers by 50% (similar to minimum wage legislation today). With continuous wars and money that was almost worthless, the government also raised taxes.
When Diocletion came to power (AD 284), he was able to stabilize the empire and there was a long period of peace. This marked a new temperature high. After his reign, the Roman Empire really began to fall apart and you can see from the chart that as it got colder and dryer, there were major migrations, constant invasions, pandemics, and starvation. Similar fates await us over the coming decades.
So, you can see how climate is a huge factor in forecasting the future. However, it’s not a “cause and effect” scenario. I believe the real culprit are forces from the planets and sun (our Solar System) and these same forces have an effect on our climate. I look towards electromagnetic waves, as we know they’re emitted by planets and have an effect on us through the pineal gland. That science is well documented.
The herd, of course, affects the movement of the market. How they feel affects the economy in a general way. Of course there are other factors that are man-made (greed, the rise of the merchant class, usury, for example) and all those negative social aspects that the Bible warns against. The raise their heads in times of plenty and a revolt against them comes in times of colder temperatures, disease, and economic distress. Fun time lie ahead …
For an overview of the climate cycle going back 2000 years, watch my short video entitled, “Global Cooling.”
It’s a fascinating world, where cycles occur over an over again in a predictable manner. However, humans don’t pay them much attention … to our detriment every time.
__________________________
New Widgets in the Sidebar
Over to the right, you’ll now see a list of recent posts. These are only posts that relate to this Market Blog. You’ll find the last ten in descending order.
Also on the right, you’ll find the more recent entries in the Forum. I’ll be posting some of the most recent comments there having to do with astro influences later today or tomorrow.
Subscribing to Comments
You’re now able to subscribe to comments on individual posts. That triggers an email that will be sent to you instantly whenever there’s a reply to that comment. You’ll be able to subscribe to any replies that follow individual comments you make and you can subscribe to all comments on a post, so that you don’t miss an important comment during the week. You can also subscribe to all comments without making any comments yourself. Here’s the option just under the submit button:

You’ll also be able to unsubscribe at any time or change your subscription options. Remember, it’s per post. I do a new post each weekend, so if you want to subscribe to all comments, each week, you’ll need to re-subscribe each week to the new post. You should really need to worry about unsubscribing to old ones, as once a new post is live, you wouldn’t expect to get replies to old posts (as they’re not as readily available – although it could happen).
That’s not a worry, as you can change your overall subscriptions at any time. There’s a link in the email you receive to let you do that.


One of the best posts ever written by your hand P! Ty!!! I totally agree with the shit that is coming plus your new count seems logical timingwise!!!
Cheers,
W
🙂
Thanks, Peter. Very well written and fascinating survey of weather effects on Roman Empire. Look forward to hearing more as market opens next week, =).
And there were floods in 44 BC, at the top of Caesar’s reign. I also have the charts for the Mayan top, Medieval top, etc. It’s much the same story, and they’re all 500 years apart.
A little explanation of what the market is doing. 90 months = 90 degrees from march 2009 gives 9/4/16. This is a major date to test and confirmed by the 1929 APD (see above).
Normally 8/29 should have been a low, so the market could do one more leg up into laborday and the job report. But other cycles force the market to make a high 8/29. So we need an artificial low on Wednesday to restore the sequence. This is what you see in my cycledates above.
8/28-29 is the strongest vibration this year and – I said it before- the start of our journey into the 2017 low. So Monday is a point of no return. But next week is a synchronization week with likely a double top 9/5. My tidal inversions give 9/6 and that makes sense as US markets will be closed 9/5. So the vibrational date above (9/5) is exact, but with market closed it shows one day later.
Many people will be fooled into thinking the trend is up. But not us!
A storm is brewing? You bet. And lightning stikes tomorrow.
As everything is a vibration I expect some bad news soon. Wonder what it can be.
Cheers,
André
Thanks Peter. Good work!
I like the Wheeler chart/analysis.
I know especially tops of cycles can take a while, but isn’t it 15 years late now?
I guess it depends on your perspective Kent. For those living in the 16th century it is nearly 500 years too late.
Wow Peter, the Roman Empire analysis in conjunction with Climate change is a true ‘eye opener’ for me. Thanks very much.
Andre, thanks too for your timing info. Here is something that I have been playing with:
https://postimg.org/image/yq9d4z5pp/
This is a DJIA chart from last May’s top. The 2 bits that I’ve marked by elipses have an eerie similarity and within that the red square shows, in my opinion, the drop on Friday. So on that basis we should expect a high today as per your timing. I don’t know whether this sort of comparison is valid but people often talk about the market’s rhyming abilities. So I’m using this as a vague road map.
purvez,
We’ll see. But sofar my cycle dates are playing out as expected.
Cheers,
André
Yes indeed they are. I’m ticking them off the list on my computer screen. LOL.
🙂 🙂 …and loving it.
PALS:
Phase: bullish all week
Distance: neutral to slightly bearish all week
Declination: bullish until Wednesday, bearish Th, Fr.
Seasonals: often steep selling end of August
Summary: mixed, price is not overdone either way, will wait in cash until either price gets overdone or PALS direction is more unified.
Clever, clever Valley. I need to find a way of co-relating PALS with EW, but I have to say I’m still struggling. Hence I can’t get the ‘maximum’ out of what your PALS tell me.
My fault entirely….but it’s still ‘Work in Progress’. Thanks for your input.
Thanks, Purvez! My trading success may be a journey and not a destination. =)
Iceland raised the alarm after its largest volcano was hit by the biggest tremors since 1977.
Let’s suppose everything is a vibration. Could this news reveal the magnitude of the vibration that is active? Remember what I wrote this weekend?
Andre , your call for the 29 th high looks good…..n
Last weekend I explained how the market is preparing for the slide down. The dasha and venus indicator run into the weekend.
Looking at the vedic square of nine we see that 144 squares out with 9/5. 144 was very special to Gann as it was 12 -squared. But 144 is also the number of days between 4/14 (vedic equinox) and 9/5.
Just another reason the market wants to creep into the weekend.
Next week we can finally start the move down- as explained this weekend.
Cheers,
André
You can also see 182 is 270 degrees from 9/5. 182 days from 9/5 is 10/13, just one day from the 10/14 cycle date.
should rephrase that; 182 is 270 degrees from 144 and conjunct 9/5.
In the tropical sqr9 we see 177 aligns with 9/12. 191 is square this number and gives 9/27. You can find both dates in my list with cycle dates.
Andre , I have your dates copied , and placed in a folder, keeping up…n
One cycle I had in my system – but overlooked – was up into Tuesday. Europe followed this cycle and wanted up Monday and Tuesday. At first I didn’t understand this as 8/29 was a major vibration. But now I saw this cycle and now I understand everything. No worries; the dates I gave you are once again confirmed.
Somebody suggested I should invert my dates; high should be low etc, but I think I’ll pass. Anyway as of today we are in the cycle that targets the 9/12 low. This low is certain. I expect a high 9/5, but that will be a retrace or a w5 type top with divergences.
This weekend I’ll summarize my analysis. The sad thing with vibrations is that they were created with the Big Bang and will run til the end of time. So I gave you the dates into october and that’s it. I won’t/can’t change them. So not sure what to post about.
But I’ll keep repeating some messages so you all understand.
Cheers,
André
Yes please, Andre. Repetition keeps my 2 brains cells pointing in the same direction.
Many thanks for your posts.
After today’s action in the DJIA, IF (BIG IF) we touch 18500 or higher in this up wave then I think we will be in a 3rd of a 3rd of a 3rd down.
”Wild’ dreams BEARS’!!!….but remember it is still a BIG IF first.
Oops I had not factored in andre’s Sept 5th high. Well….. there you go. how much more ‘guidance’ does one need? UP to 18500++ till Sept 5th (I’ll use the long version of dates to stop confusing myself…living in the UK does that to you) before the huge drop.
‘I love it when a plan comes together’. Someone said that….I’m sure of it. LOL.
PALS next week:
Phase: bearish post NM
Distance: bearish farthest distance next week
Declination: bearish falling past equator to far south position
Seasonals: early September favorable
Summary: have puts in place that expire in 9 days on the SPY.
Will take profits if we get a decent selling tomorrow or Friday.
tomorrow morning look very bullish; according to my indicators, with a strong sell-off starting approx. 1:00pm
Sounds good, will look for that pattern.
Valley, I hope you are not being TOO greedy here. There should be a bounce soon that you can take advantage of.
Tom, looks like the ‘strong sell off’ came a bit early. I guess we all have to ‘tweak’ our indicators occasionally.
Thanks! I took profits =)
‘NICE’ Valley!! It’s good when a call come to fruition.
Rebought short position at 1PM, let’s see if Tom is correct. =)
looks like everything got inverted today
https://postimg.org/image/vutk7nb4l/
Back to cash. May look to reshort Friday.
If we draw a trend line from Brexit low to 8-26-16 low – today we broke out to the downside of the wedge. S&P fashion will want to come up to check the bottom side which would coincide with what Tom is saying. Wedges like to retrace back to the bottom and then sum. 1950ish is a spot to watch which is bottom of the megaphone pattern forming if 2080 breaks..
I would highly recommend the following article to everyone:
http://www.salientpartners.com/epsilon-theory/magical-thinking/
It is written in a style that is entertaining whilst being educational. A rare thing.
Just to be clear. I have no links (financial or otherwise) with salient partners. However I DO look forward to reading this guy’s posts, as much for entertainment as education.
A little additional analysis.
The S&P set the ath 8/15 and I think this will stand for a long time. But Europe still wants to go up.
So I decided to take a look at stoxx 600. My vibrational indicator shows that Stoxx 600 is basically up from 8/8 til 9/20.
The good news is that this confirms the high 9/19 I already gave you. But this also shows that the 9/19 high is significant and things will really speed up then.
My cycle dates can’t change. So the high 9/5-6 and the low 9/12 are fixed.
But it gives a little more insight in the working of the market.
Thought you might want to know.
Thanks andré. Very kind of you!
The turning point should be 2178ish.
The bottom of the triangle was not quite touched yesterday.
Should be today sometime if we have any volume..
Once the market opened and the charts moved over a day 2184 ended up being the bottom of the triangle. We should reverse from here but have to admit it is looking pretty strong..
https://worldcyclesinstitute.com/ending-diagonals/#comment-10517
“84 years ago on the 31st August 1932 there was a Solar Eclipse visible over NYC…The Solar Eclipse on the 1st September 2016 is connected to this eclipse, exactly 84 years and 1 day difference.”
_____________________________________________________________________________________
https://worldcyclesinstitute.com/meanwhile-back-at-the-contrarian-corral/#comment-10715
September 3, 1929: The Market Reaches its Peak
After a surge of optimism, the bull market reaches its peak — the Dow Jones Industrial Average closes at 381.17. A newspaper headline trumpets, “Public Demand for Stock Appears Insatiable.”
July 8, 1932: Dow Jones Reaches a Low
The Dow Jones Industrial Average reaches its lowest point of the Great Depression, closing at 41.22, down 89 percent from its peak in 1929.
_____________________________________________________________________________________
just a little ‘thinking out loud’…
Sept. 3, 1929 was a Tuesday, day after Labor Day. If you’re looking for a pivot high, maybe Sept. 6 is a better day to target.
thanks…aware of those factoids…
Merkel’s party takes hit in German elections amid anti-immigrant sentiment…
http://www.cbsnews.com/news/merkels-party-takes-hit-in-german-elections-amid-anti-immigrant-sentiment/
have reviewed the proprietary work of another stock market cycle analyst…he has consistently referenced similarities with the 2000-2001 stock market…Friday, September 1, 2000 was a significant day…
Jay on the Markets (Jay Kaeppel) seasonal data shows three days before and three days after major market holidays in US are consistently bullish thru decades. So, even tho’ PALS is aligned negative next week, I am hesitant to short here. However, if price go’s higher next week, will short.
May place a small bet on Friday expiration puts on Monday at open. Hurricane set to travel up Eastern seaboard into middle of next week. May add uncertainty to market and given negative PALS this may tip scales to down side, overcoming seasonal strength.
My cycle dates gave a high 9/5. So yesterday was up. No surprises sofar. And next comes the low 9/12.
This shows the jobreport didn’t matter at all. It was a lousy report but this time bad news was good. News always comes when the market needs it, but it can’t change its course.
What I learned this week is that we need to look at both Europe and US. Friday european markets went up much steeper than US markets. All week US markets wanted down and European makets wanted up. This is a very unhealthy situation and shows what I said last week: that this week would be a synchronization week. Markets need to be in sync for big moves. 8/29 should have been a low but it was a high. Or rather : it was both and confused the market, 9/5 should be a high and it will.
So next week volatility will pick up a bit. Stoxx 600 shows 9/19 is a very significant high. This will be the anniversary of the 2014 september top and that gave us the october low. If you want to predict the market, study the past.
As everything is just one vibration, astro gives the same. 9/6 we have the sun conjunct the node and 270 degrees on the death and destruction midpoint. So this will be the mother of all moon wobbles. And HC mars will trine Jupiter; all on the same day. You may remember the 12/1/15 high was caused by HC mars conjunct Jupiter; major cycle.
We are down into 3/25/17. No central bank can stop this.
Cheers,
André
Thanks A, loving it! 🙂
Hi Peter
I m thinking way outside the box here.
if I take my timing which if correct should basically
show full moon highs and new moon lows ( loose correlation )
mid sept becomes a high followed by a mini panic .
the longer cycle being bearish into January .
With that cycle in mind and dovetailing it with your ending
diagonal ( very speculative I know )
what comes to mind as the ultimate fake out would be we are
only now completing wave 1 of the ending diagonal .
my line in the sand is obviously the Jan – Feb 2016 lows .
my focus would be 10 days following the start of mercury going retro
for a high ( correlating with the full moon )
also I’d keep my eye out for 10 days after mercury goes direct for a low
( correlating with the puetz cycle )
It’s been many years since mercury has worked in this fashion
yet it’s not just an off the wall thought ,I’ve used that method before
and when it worked it worked for about 3 years straight before failing .
also back then there was a 118 trading day cycle that repeated over and over which showed several 59 trade day cycles and a few 236 trade day cycles . whether these 59 trade day 118 trade day or 236 trade day cycles
start to appear I can’t say .all I can say is the market is feeling similar
to me as it did back then .
if history repeats then I’d expect a wave 3 type move upwards in the year 2017 .
so far the bearish cycles appear to be working ( already noted above )
I think your onto something with the ending diagonal
still 10 days or so for me before I’m able to dig back into the market .
Joe
The ending diagonal isn’t speculative at all. It’s the only pattern possible. I posted a video on the pattern in the post. Good to see you back.
A new post is live: https://worldcyclesinstitute.com/making-waves/
This website is for educational purposes relating to Elliott Wave, natural cycles, and the Quantum Revolution (Great Awakening). I welcome questions or comments about any of these subjects. Due to a heavy schedule, I may not have the time to answer questions that relate to my area of expertise.
I reserve the right to remove any comment that is deemed negative, is unhelpful, or off-topic. Such comments may be removed.
Want to comment? You need to be logged in to comment. You can register here.