
Update Friday, July 8, 3:15 PM EST
Above is the 60 minute chart of ES showing an expanding triangle, which is different than a diagonal (although both are triangles).
This is what Purvez was referring to in his recent comment and I think it looks more like the pattern we have now (than a diagonal), which should be on a …. diagonal 🙂 , and hence why they call it that. If this is indeed the pattern, this leg should not rise above the upper trendline.
What this means is that we’re going to get one more very large drop to complete the E wave and then a final wave up to to top. However, I don’t see a turn coming until July 15, so we may just wander around at the top here before turning down.
I will get a better chance to look at this tonight, but after this morning’s move, I can’t see how the contracting ending diagonal would work.
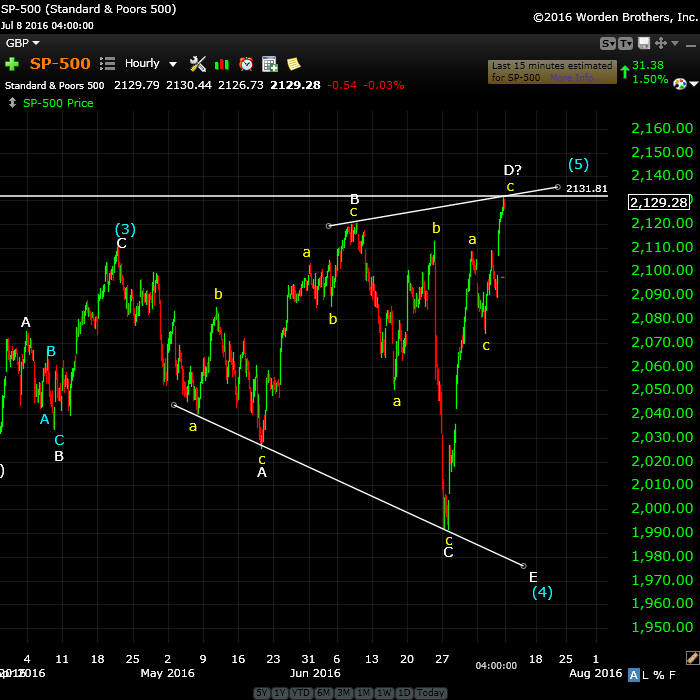
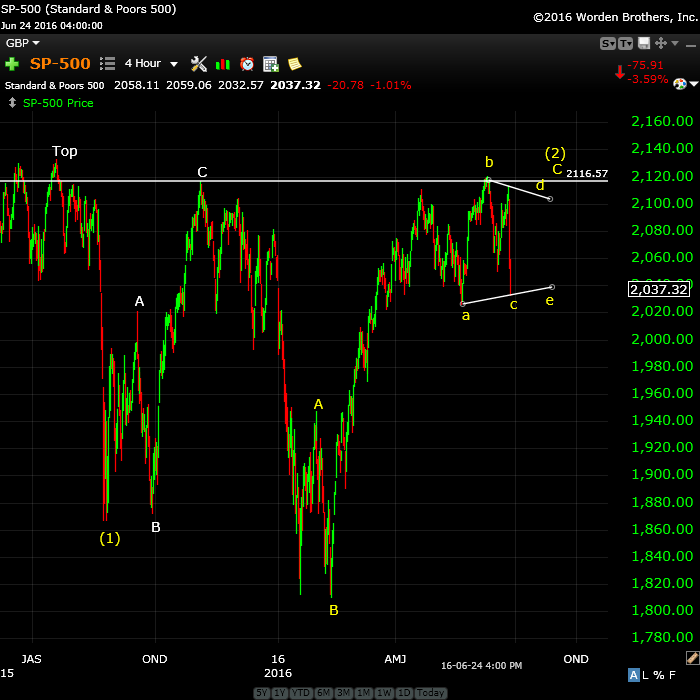
Above is the one hour chart of the SP500 showing an expanding triangle. As such, we have a large E wave still to go, followed by an even larger 5th wave. There’s one other configuration that would make this the final wave up, but I need to spend some time on charts to get closer to an answer as to probability.
This is not an ending diagonal because it travels sideways. An expanding ending diagonal travels on an angle upwards (a diagonal). An ending diagonal is also a fifth wave and so doesn’t quite fit the wave structure, while a triangle is a fourth wave, with one final wave to go after it.
________________________________
Update Wednesday, July 6, 1:30 PM EST
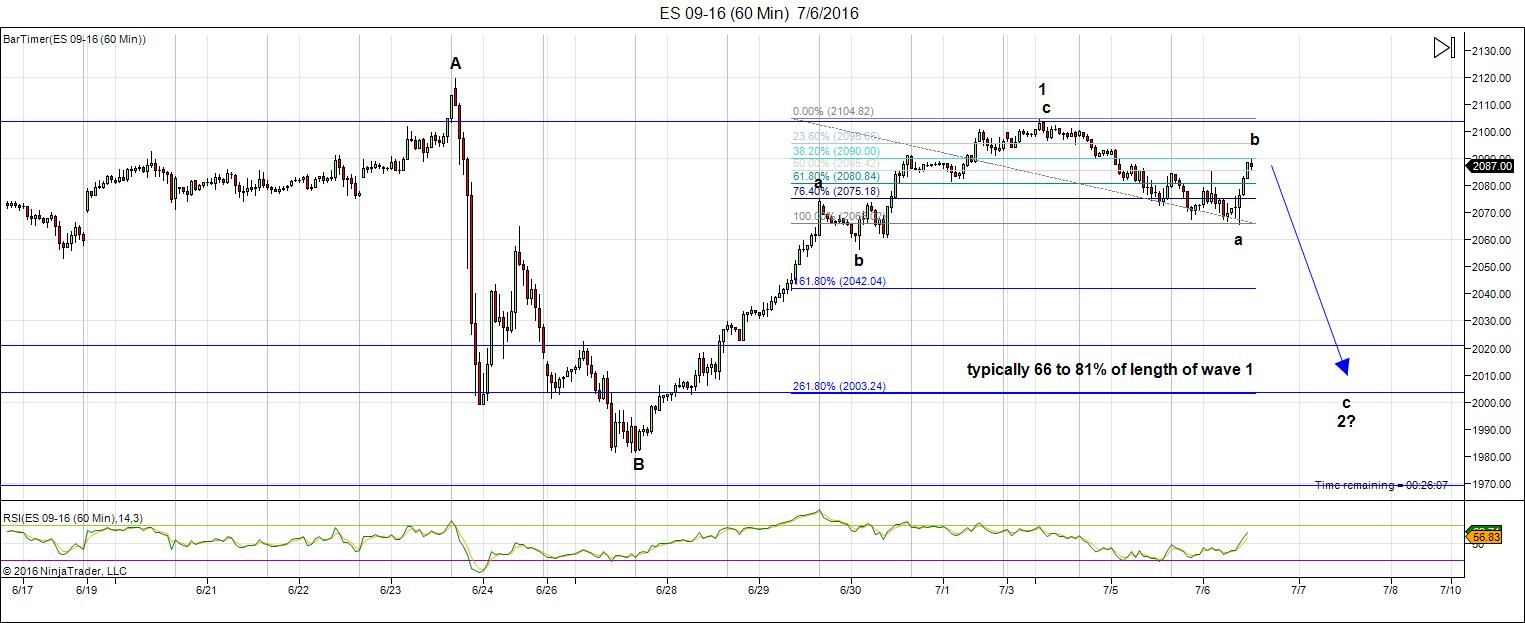
Above is the 60 minute chart of ES (SPX eminis) showing progress to now. We’re in the b wave now and it may have a little bit more to the upside before turning down, It should not go to a new high. You can see the fibonacci tool on the screen. It’s projecting about 2003 as an end point (the lower end of the spectrum, which is what I would expect since this is the top of the market).
You can think of wave 2 and 4 of the ending diagonal as the countertrend waves (why they’re so much choppier), while 1, 3, and 5 are the motive trend waves.
Another reason this is so choppy and slow is that currencies are finishing up. I’m watching the dollar and euro and they’re back and forth in a rhythm with the indices.
I have no doubt that ES, SPX, SPY and the like will hit the target on the 14/15 of July date.
I’m a little under the weather today, so I won’t be around to participate all that much.
_________________________
Update: Tuesday, July 5, 3:30PM EST
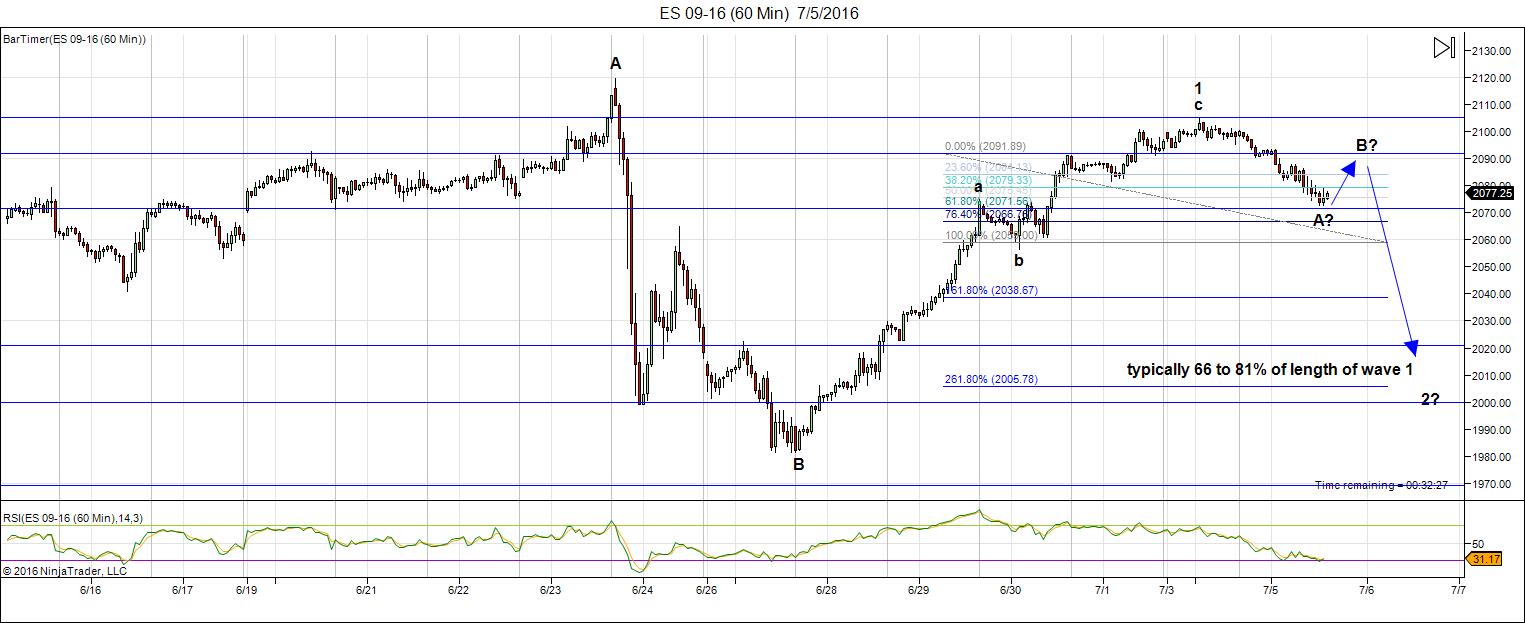
Above is the 60 minute chart of ES (SPX emini futures). We hit the target of 2103 yesterday and have turned down. The second wave of an ending diagonal typically retraces between 66 and 81% of wave 1. Knowing that and using the first wave down as an “anchor” for fibonacci measurements, I would lean towards 2071 as the possoble pivot point for the B wave.
From that point, if the bounce retraces approx. 61%, the wave down at 2.618 X the A wave down would put us right in the target range.
Update (after the close): I would put the bounce target at 2093 ES (a 62% retrace) and that makes the downside target 2007.
_____________________
Original Post: Sunday July 3: Not to worry. I’m not going anywhere. The title of this week’s post is my projection for the start of the crash. The market should stay up until September to finish up the current EW ending pattern. However, there are some really great opportunities in the market leading up to that point, particularly in futures and currencies.
Let me say it again: Starting Tuesday, there’ll be some terrific set-ups in currencies and futures. I’ll outline them in the video and chart section below.
It’s true this is perhaps my final free post of this nature (I’m working on launching a paid service so I can keep this information coming for those who want to keep on top of where the market is going over the next few years). There will be much more to it than these posts. More Elliott wave info, nightly videos, and longer videos on the weekends. More to come during the week as I finish up the technical issues.
It will be as much about learning the basics of Elliott wave (so that you can be a more profitable trader), as about identifying high potential set-ups.
Last weekend I called for the market to rise up one more time. Apparently, I was one of the few to call for a new rally. Here’s what I said:
- Markets typically do not turn on a dime. Topping is a process.
- Markets don’t come down in one fell swoop. They zigzag. Even motive waves with big drops have large second waves that attempt to reach back up to the top before turning over. You just have to look a the big picture we’re in now. This second wave almost reached back up to the top.
- Events do not change a market’s direction. They don’t change world mood. The markets move to the mood of the herd. The mood of the herd determines events. I’ve never seen an event change a trend.
- Markets turn on cycle turns. We didn’t have a major one Thursday/Friday, but we have some major ones coming up.
- In the Elliott wave realm, patterns have to play out and you can’t have an ending wave in 3 waves, unless it’s a triangle of some sort. We’re stuck in “no man’s land” at the moment. I’m looking for a top that fits the EW rules
So, for all these reasons, without even looking at the intricacies of the current wave structure, EW logic tells me we’re not done. I seem to be one of the only ones to have called this rally. Well, we’re not done yet. This pattern is very likely an ending diagonal (a triangle) and, as such, it’s going to take some time to play out.
That’s why I’m targeting September for a market turn.
Bottom line: This past week created an ABC wave up, which should be wave 1 of an ending diagonal. There are five waves in an ending diagonal. Wave 2 should start down on Tuesday, July 5. I expect the bottom at around July 14/15. It should be large drop in 3 waves, but not to a new low. However, I can’t give you a target right now. I should be able to do that as the wave progresses.
As far as I’m concerned, the long-term trend is still up, but not for all that much longer.
The rules for a trend change in Elliott wave are very clear. We need to see five waves down at small degree and then 3 waves up to at least 62% with an turn down at that point (that’s the entry point).
__________________________
Andy Pancholi’s Market Report Video
Andy Pancholi has made public the next two turn dates: July 5 and July 14/15. He continues to nail these cycle turns. To purchase Andy’s high-end cycles report (or for more info), click here.
Wave Three Down
Here’s a link to a projection for wave three down in the SP500.
______________________________
Here’s a video overview of the market for Tuesday, July 5, 2016:
Market Report for July 5, 2016  |
 |
Make sure you zoom the video to full size with frame expander (arrows) in the bottom right hand corner and also set the quality to as high as your web connection allows. This is an HD quality video so the best viewing is at that level. |
_______________________________
The Charts Going into Monday
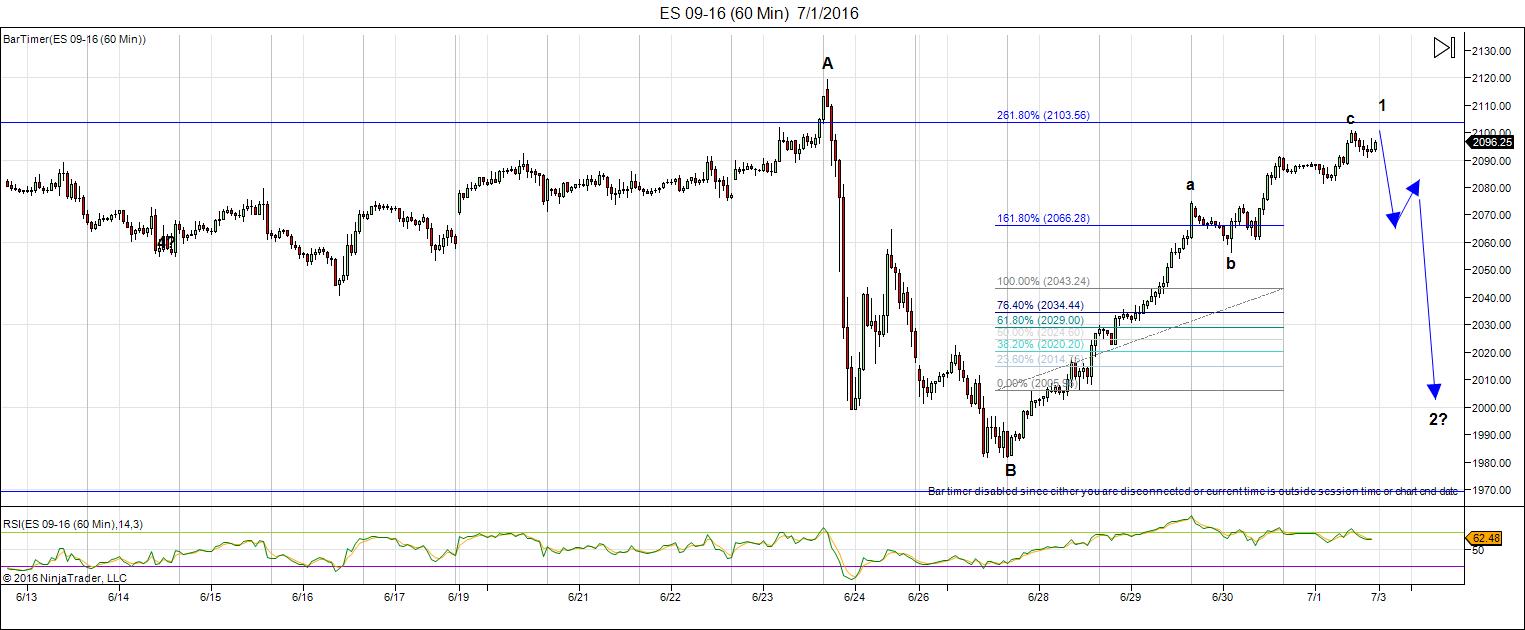
Here’s the 60 minute chart for ES (emini futures) with the count to now. I’m expecting to see a top on Tuesday at ~2103. We have a corrective wave up. It still lends itself to an ending diagonal finishing pattern. The first wave up is the largest of the pattern. This wave down will be in 3 waves (actually a 5-3-5 pattern). I can’t provide a target yet, but should be able to after we see the A wave trace out its 5 wave pattern.
NOTE: Here’s an EW guideline. Wave 2 usually retraces between 66 and 81% of the length of wave 1.
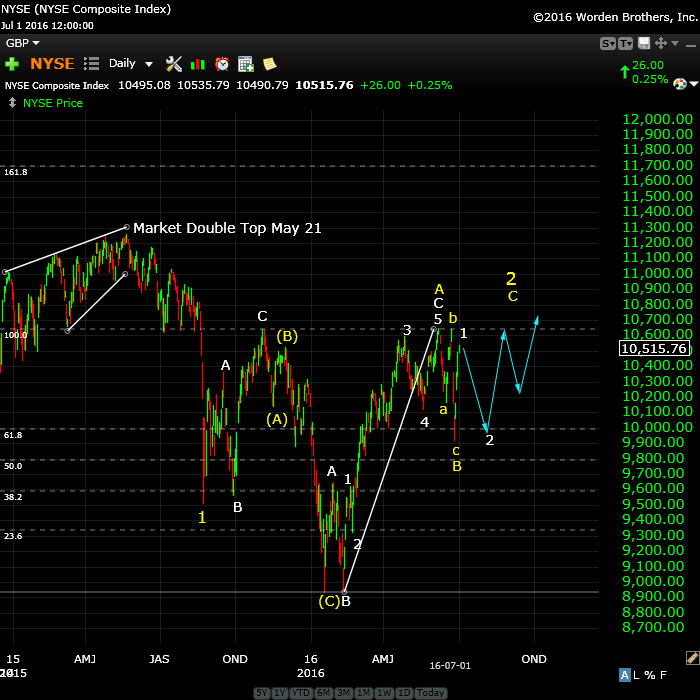
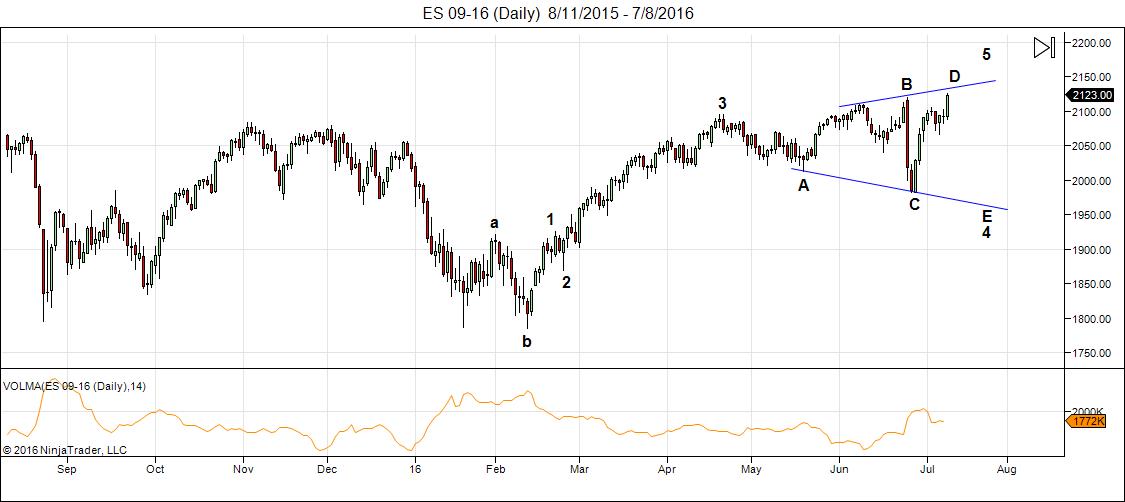
Above is the daily chart of NYSE (the largest cap index in the world) and the one we really need to pay attention to for the US market. I had thought at first glance last Friday morning that the NYSE had done a double top, but on closer examination, it missed by about $10.00 or so. That was a big clue that we were going back up to make the top “official.”
The setup has been screaming for an ending diagonal now for about two weeks. We’ve completed the first wave up (a corrective wave in 3) and this wave down should be in three waves, but not to a new low. That will all but confirm the ending diagonal.
NOTE: Here’s an EW guideline. Wave 2 usually retraces between 66 and 81% of the length of wave 1.
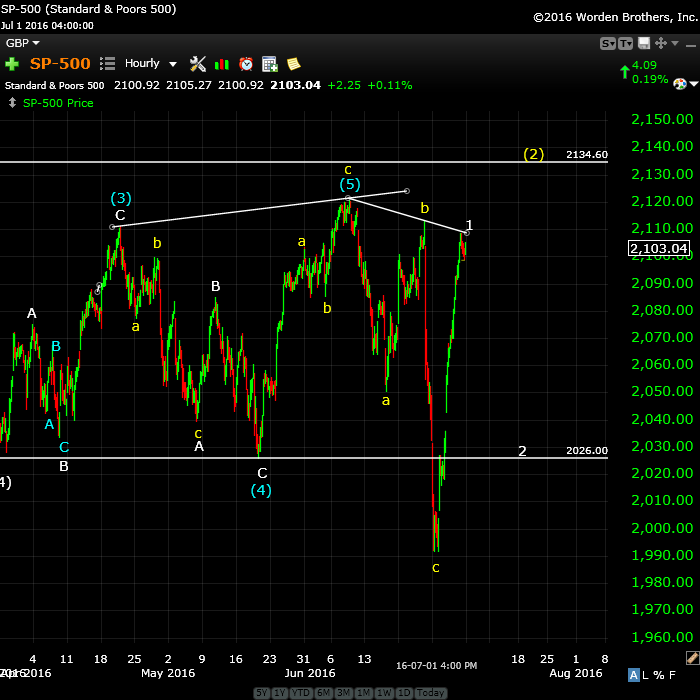
Above is the an hourly chart of the SP500, the first wave up of the ending diagonal. This should follow the same path as ES (above) and my short-term prognosis is exactly the same. I’ve placed a horizontal line at a possible stopping point for wave 2, but it’s just a guess. I show my thinking in the video.
NOTE: Here’s an EW guideline. Wave 2 usually retraces between 66 and 81% of the length of wave 1.
I don’t expect the SPX to reach up to a new all time high. However, it may get very close.
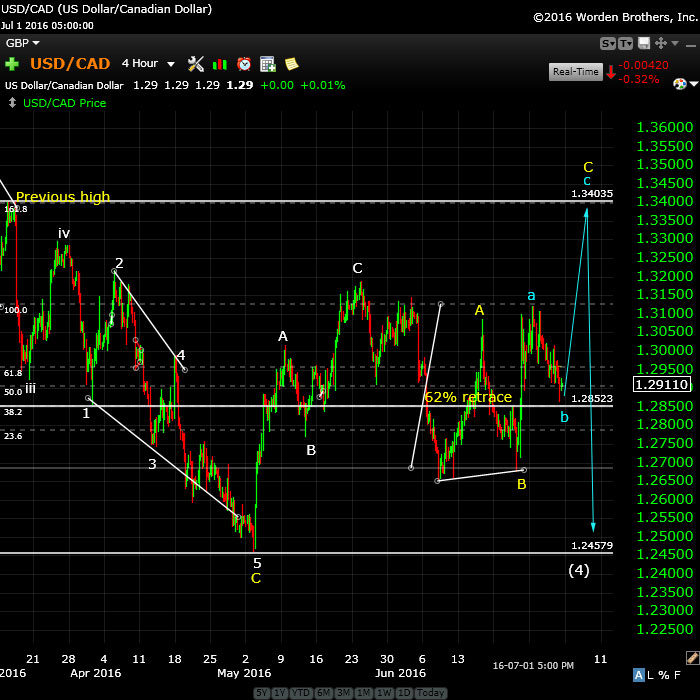
Above is the 4 hour chart of USDCAD. Finally we have all the currencies aligned and they’re giving quite clear counts. Take a look at EURUSD, USDJPY and CAD here and see how I’ve market out quite literally the same path for the them all.
This has been the most frustrating pattern to try to predict, until now. The yellow A wave is the exact same length as the blue a wave. The blue b wave has almost retraced 62% and on Tuesday, I would expect a turn from about 1.2852 (horizontal line) up to 1.2403 to complete the blue and yellow C waves. Then a turn back down eventually to 1.24570.
After that, we’ll turn up in a very large fifth wave, which will eventually take up to a new high for USDCAD.
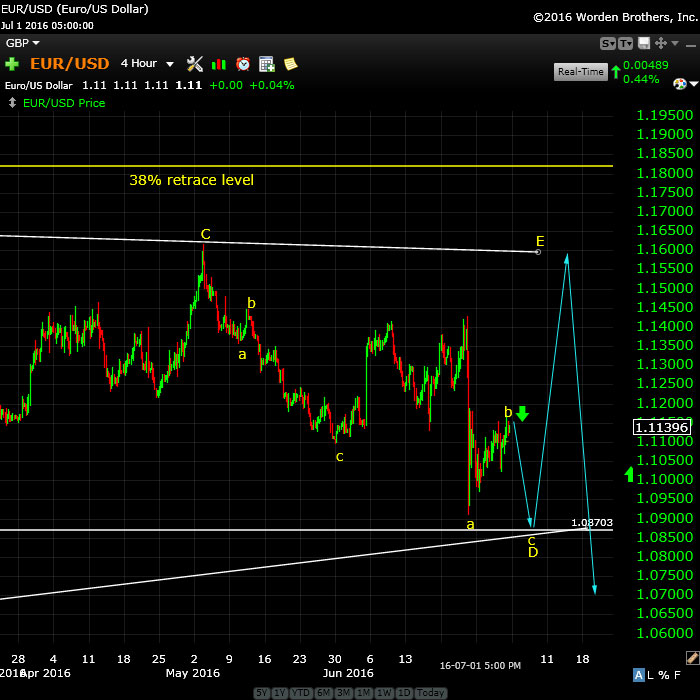
Here’s the four hour chart of EURUSD showing the ongoing triangle—the major (combination—a flat and a triangle) corrective pattern we’ve been in since March, 2014. We’re in the final stages of a bearish triangle formation, with one more leg up to go to finish the E wave. I’ve widened the triangle here to leave a distance between yellow D and E of .618 X the distance between waves A and B (not shown here), which is the typical wave E length. (I show more in the video)
This means that Tuesday, we should start to drop to the 1.0870 level and then I suspect when we finish wave 2 of the ending diagonal in the US indices, we’ll turn up in the final E wave of the triangle.
EURUSD should turn down after finishing the E wave in tandem with the US equities.
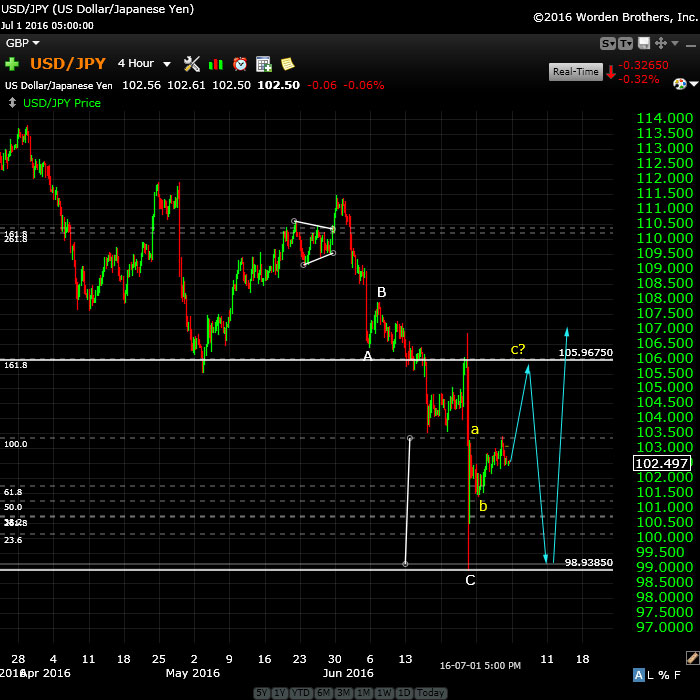
Above is the four hour chart of the USDJPY. We’ve now met my target at 100.5823 and headed a bit lower. We immediately bounced and now I would expect us eventually to head back down to a double bottom. However, as the other currencies complete their next waves, USDJPY should head up here in a C wave. NOTE: We may not rise nearly as far as what I show in the diagram. We may only reach the yellow a wave area and head south after that.
The next move down as the other currencies turn, is likely the double bottom I’m expecting, before a turn up in a very large 5th wave to a new high. Give this a couple of months to play out.
________________________
First Wave Down – What to Watch For
What we’re looking for (likely in September) to confirm a turn is a motive wave down in 5 waves at small degree. After that, we should get a second wave that will retrace up in 3 waves about 62%. That’s the preferred EW entry point. So don’t feel you have to rush in. There’ll be a much better opportunity at the second wave level than at the top and the risk is substantially reduced.
You’ll find a diagram in the forum here.
__________________________
History: The 1929 crash
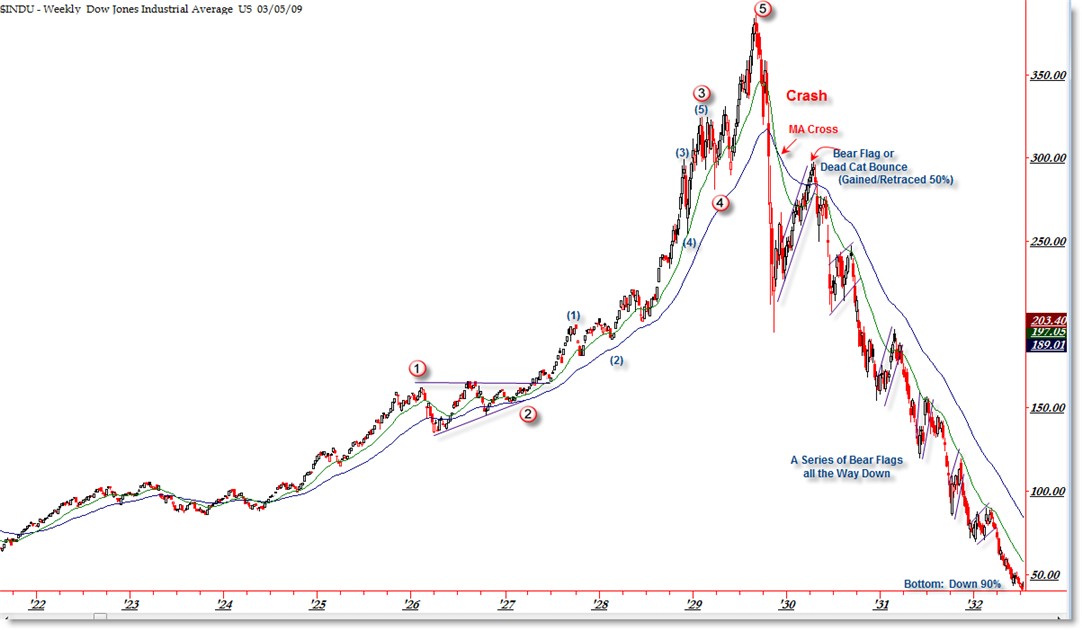
I think it’s important to look at 1929 and the wave structure (above and below), which was the same as 2007—to a point. I will show the 2007 crash below in the “What If” section.
The wave structure of the 1929 crash was in 3 waves overall. There were 5 waves down from the top (the A wave) and then a very large B wave retrace. The final C wave down was a stair-step affair and lasted over 2 years.
Let’s look a little close at the timing of the 1929 crash because the similarities to today are uncanny.
The market peaked on September 3, 1929 and then it took 2 months for the crash to actually happen (to reach the bottom of wave 5 of the A wave). The larger crash which we always hear about began on October 23, 1929. Then there was that large B wave, which lasted 5 and a half months and finally (which I explain a little further in the cycles section below), the C wave which went on for more than 2 years. This might be the scenario we’re looking at going forward.


Andy Pancholi free videos…
“Week Ending 8th July 2016…S&P500 together with a whole series of global markets are likely to change trend” – http://tinyurl.com/jnnvhzw
“Week Ending 9th September 2016…S&P500 together with a whole series of global markets are likely to change trend” – http://tinyurl.com/j2ynjd6
Andre’, Richard Meuter,
Andre’: thanks for the book reference, the library continues to grow. Love those topics.
Richard: North Node=Rahu in ancient Vedic. This is VERY important to understand. Also, part of Metonic cycle. Rahu/Ketu are critical to the understanding of eclipses and all things lunar. There are certain themes expressed in each cycle. I have begun to research the Lunar Gestion Period which would involve 9 months from the New Moon to the 1/4 moon and again to to Full moon and again to 1/4 moon… Interesting and fun stuff. Some say Gann focused entirely on Lunar movement at the end of his career, but then again, Gann is an enigma, inside of uncertainty , inside of occultation, …
Sunday morning; time for a little intermezzo.
I am fascinated by cycles like most of you. We can use astro, Gann, Bayer etc but – and here is my point – I have come to believe our whole universe resonates with vibrations. And that if we would find the vibration we would be able to explain everything we see. This is the core of Gann’s theory, but Gann wasn’t original in this.
Pythagoras found that if you half or double the length of a string you get pure notes. There is no explanation for this but we can hear it; our brain recognizes the vibrations. Everyday our brain is tuned by the Schuman resonance that is caused by the athmosphere that grinds along earth’s surface. We may not be aware of this but our health depends on vibrations.
Two major cycle I see are these:
1) The 17 year cycle. Not lunar, not astro, just vibrational. 1/4th gives 221 weeks.
1,5 times a 221w vibrations brings us from the 2009 low to 7/21/15. One leg up, one down, and one up again. And now down again. Half a cycle is 110 weeks; more than 2 years.
Beneath the 221 we find the 78 week. When the 221w gave a high the 78 gave a low. 39 weeks up brings us to 4/20/16; indeed a major date confirmed by Gann theory.
And now we are down for 39 weeks and for 110,5 weeks. These vibrations are now in harmony. This should bring us at least into jan 2017.
The reason this hasn’t happened yet is found in the 25 week cycle. When the 78 week gave a high 4/20, the 25 made a low and 12,5 weeks up from 4/20 brings us to 7/16.
So from 7/16 we will have 3 vibrations in harmony, at least into 10/12, 12,5 weeks down. 7/16 is exactly 1 Uranus cycle from the 1932 low (I explained in the forum).
In my mind this is the only way to get decent timing.
The second major vibration is in ‘e-timing’. Eulers constant is a vibrational number,
30.000 times 2.7182818 (=30 degrees) from the nyse birthdate gives 8/25/15. This should have been a major high, but the market reversed as the 250e (a harmonic on 30.000) made a low and went up for 125e. 125e from 8/25 gives 7/30.
This explaines why 7/15 and 7/30 are so significant, It also explains how the major cycles turned in 2015 and we are now supported by just minor cycles until they run out of energy. We can’t ignore vibrations; no central bank can stop this. I see a lot of confirmation in astro as everything responds to these vibrations.
Maybe something for the forum?
Just let me know what you think.
André
Yeah, dump all this fabulous stuff in the forum, if you don’t mind!
Hi Andre
in Vedic astrology the 17 years is the Vimsottari cycle for Mercury dasa; Mercury is the significator of markets
I didn’t know that, but sure makes a lot of sense. Thanks.
Whitemare.
One question. The sum of all mahadasha’s is 120 years, or one human life. Raman says that one cycle is 60 – LUNAR- years. Could it be we have 17 solar (365) and 17 luar (354) years? Very interestin stuff. Thanks again.
To illustrate my point. In Vedic astrology a concept is used by the name of upagrahas. These are mathematical positions calculated from the sun’s (vedic) position. The idea is that when something touches one of these points something will happen. As the sun moves constantly (relative to earth) the points drift through space.
7/9 the moon (gives most hits as it has the shortest orbit) crosses Vyatipaata.
7/16 (see above!) the moon crosses Dhuma.
7/23 Parivesha is crossed.
8/1 Upaketu.
The vedic system – derived from babylonian astro – has been around for thousands of years. The dates you see above are vibrational. But it is no real confirmation; it just shows you can see the vibrations.
This system is new to me so I’ll have to see how it works. Could it be that when Mars hits a point this is more significant than when the moon hits? I can see now that 9/27 Mars hits Parivesha. We’ll have to see if this is significant.
http://ray.tomes.biz/maths.html
Read here the universal formula for distance in the universe – say from galaxy to atom – is 10 to the power 4.5. This translates to 86.5 year, or 5 times 17.
5 is very harmonic. And this not only explains why Uranus has an 84 year cycle, it also proves Uranus is one of the most vibrational planets in our galaxy.
This is what Ray says : “The Universe consists of a standing wave which develops harmonically related standing waves and each of these does the same.”
This kinda describes what I tried to say above.
I’ve been reading in a few places that EW is no longer pointing a crash possibility in 2016? All bear possibilities have been ruled out? How is that possible? Are you seeing the same thing Peter that this just keeps going sideways to higher (melt up) then next year we see the big waterfall to the downside everyone has been talking about?
You sure won’t get that from me. Some of Prechter’s group has been forecasting that for months, but I really prefer to be on the other side from them, based upon their accuracy. They’re starting to back off now, because sentiment is SO bullish (up to record levels again).
Charlie. That is what i am reading. All bear possibilties out. Spx. 2200 2300 2500 etc. U look at spy and all etf money flows. All are negative or down. Cpc. All bullish. But bankers. Wont let this market coorecy 50 points. Most are saying correction to 2070 only
That’s what I’m sensing too. Being an election year & if market crashes Trump wins. & now with EW ruling out a crash, it looks like we have to wait until at least after elections
Watch out, No bears left this week the bottom will fall out starting by Tuesday .
New post: https://worldcyclesinstitute.com/periodicity-and-patterns/
This website is for educational purposes relating to Elliott Wave, natural cycles, and the Quantum Revolution (Great Awakening). I welcome questions or comments about any of these subjects. Due to a heavy schedule, I may not have the time to answer questions that relate to my area of expertise.
I reserve the right to remove any comment that is deemed negative, is unhelpful, or off-topic. Such comments may be removed.
Want to comment? You need to be logged in to comment. You can register here.