
Update Friday, July 8, 3:15 PM EST
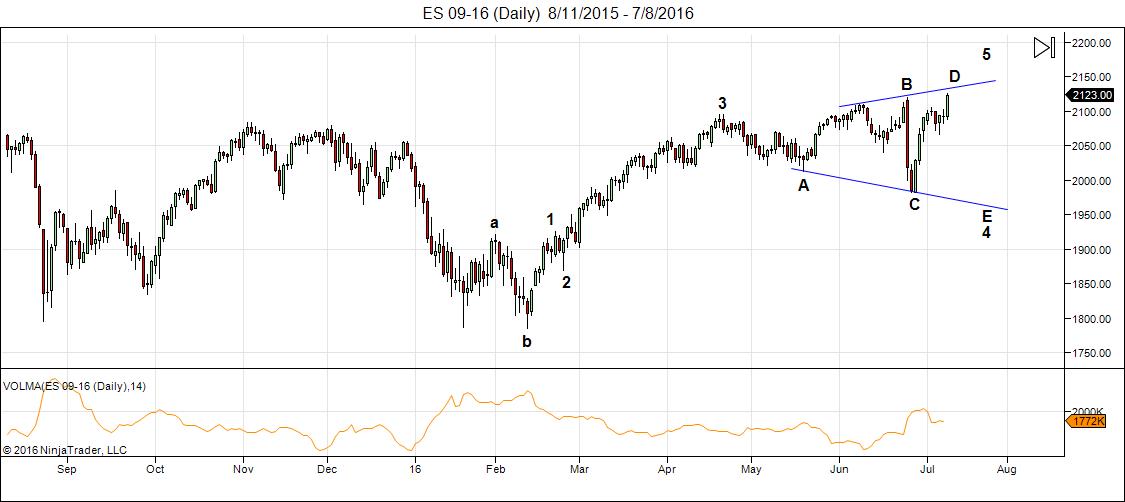
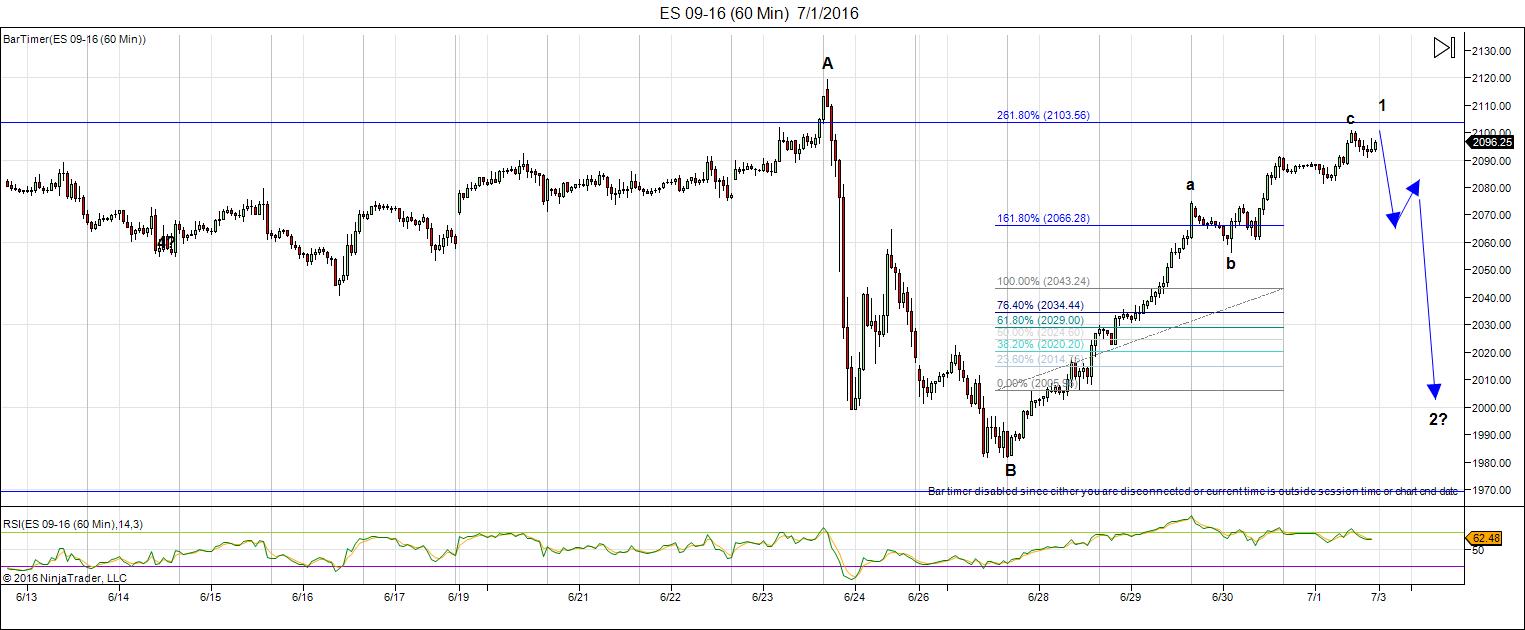
Above is the 60 minute chart of ES showing an expanding triangle, which is different than a diagonal (although both are triangles).
This is what Purvez was referring to in his recent comment and I think it looks more like the pattern we have now (than a diagonal), which should be on a …. diagonal 🙂 , and hence why they call it that. If this is indeed the pattern, this leg should not rise above the upper trendline.
What this means is that we’re going to get one more very large drop to complete the E wave and then a final wave up to to top. However, I don’t see a turn coming until July 15, so we may just wander around at the top here before turning down.
I will get a better chance to look at this tonight, but after this morning’s move, I can’t see how the contracting ending diagonal would work.
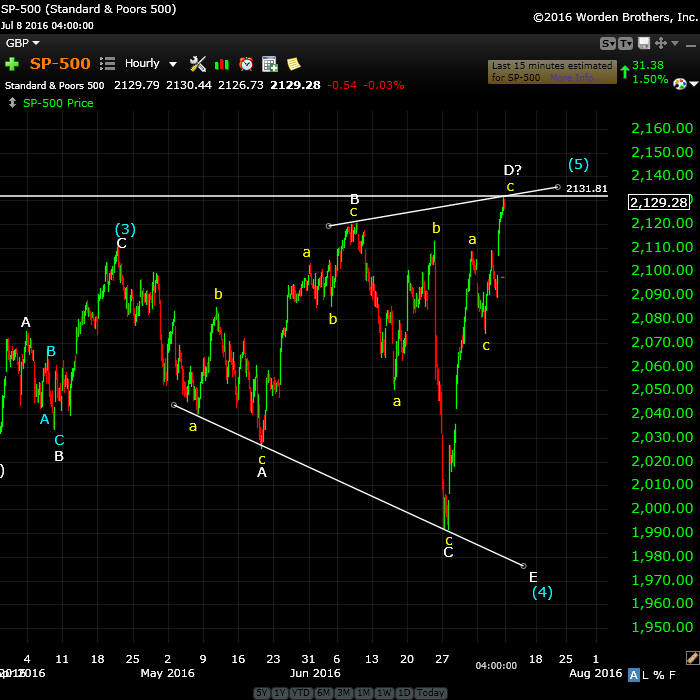
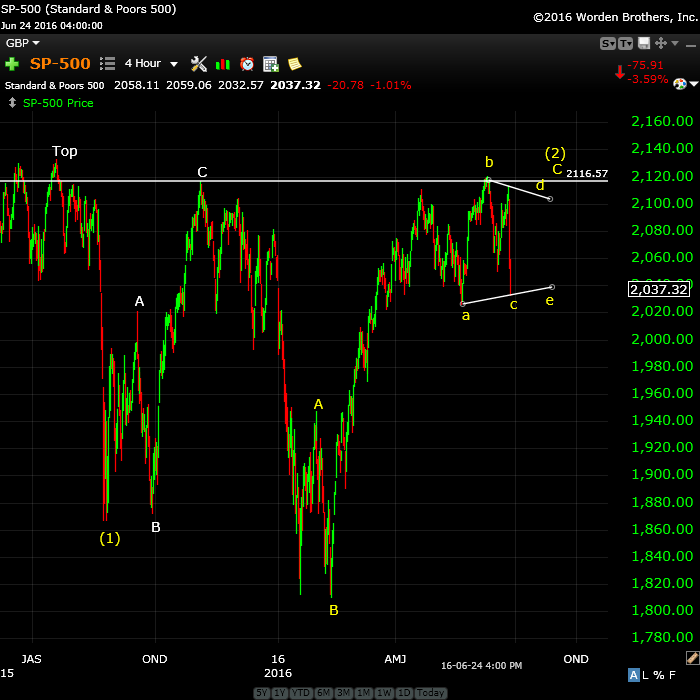
Above is the one hour chart of the SP500 showing an expanding triangle. As such, we have a large E wave still to go, followed by an even larger 5th wave. There’s one other configuration that would make this the final wave up, but I need to spend some time on charts to get closer to an answer as to probability.
This is not an ending diagonal because it travels sideways. An expanding ending diagonal travels on an angle upwards (a diagonal). An ending diagonal is also a fifth wave and so doesn’t quite fit the wave structure, while a triangle is a fourth wave, with one final wave to go after it.
________________________________
Update Wednesday, July 6, 1:30 PM EST
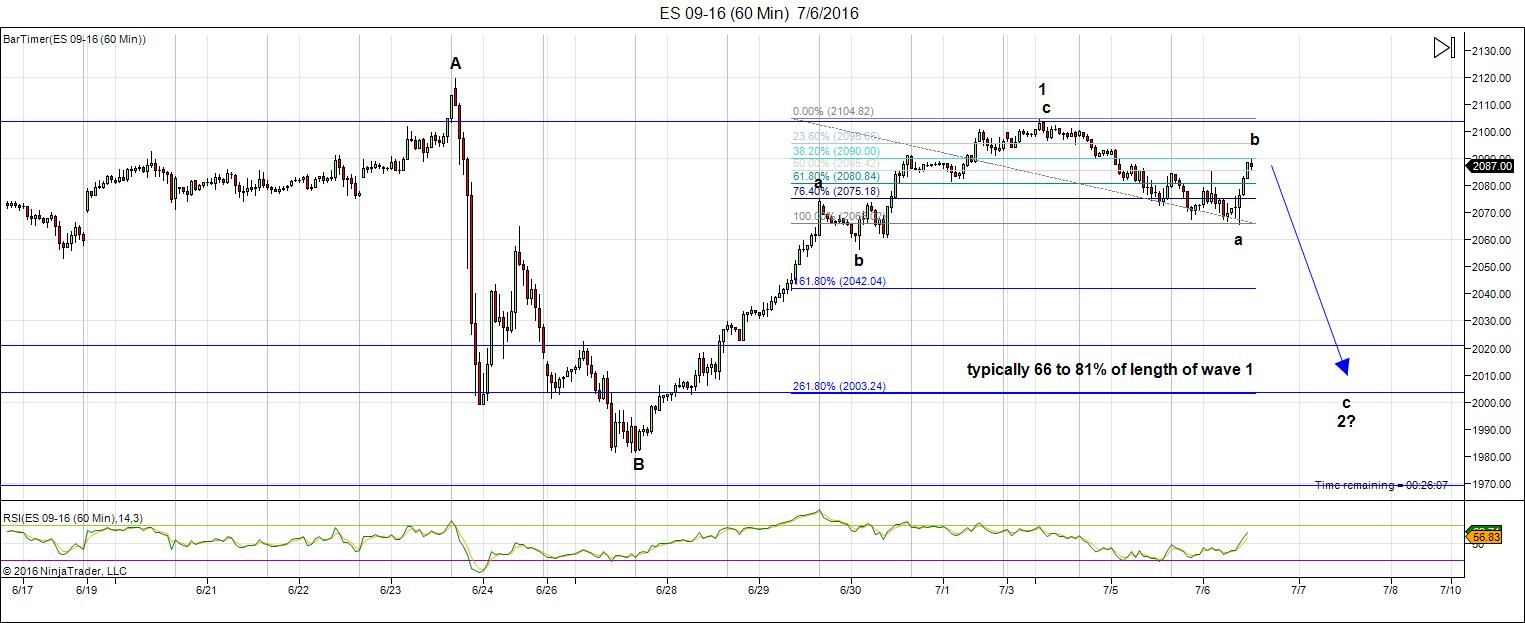
Above is the 60 minute chart of ES (SPX eminis) showing progress to now. We’re in the b wave now and it may have a little bit more to the upside before turning down, It should not go to a new high. You can see the fibonacci tool on the screen. It’s projecting about 2003 as an end point (the lower end of the spectrum, which is what I would expect since this is the top of the market).
You can think of wave 2 and 4 of the ending diagonal as the countertrend waves (why they’re so much choppier), while 1, 3, and 5 are the motive trend waves.
Another reason this is so choppy and slow is that currencies are finishing up. I’m watching the dollar and euro and they’re back and forth in a rhythm with the indices.
I have no doubt that ES, SPX, SPY and the like will hit the target on the 14/15 of July date.
I’m a little under the weather today, so I won’t be around to participate all that much.
_________________________
Update: Tuesday, July 5, 3:30PM EST
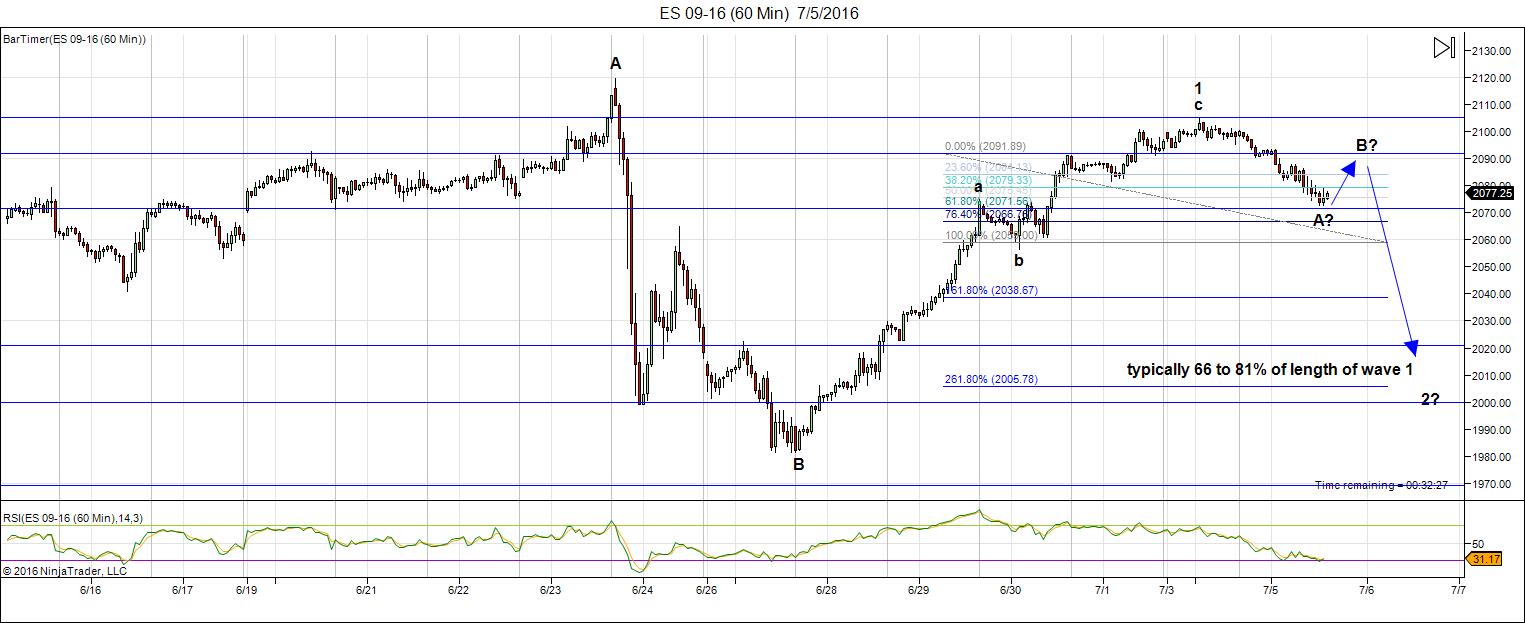
Above is the 60 minute chart of ES (SPX emini futures). We hit the target of 2103 yesterday and have turned down. The second wave of an ending diagonal typically retraces between 66 and 81% of wave 1. Knowing that and using the first wave down as an “anchor” for fibonacci measurements, I would lean towards 2071 as the possoble pivot point for the B wave.
From that point, if the bounce retraces approx. 61%, the wave down at 2.618 X the A wave down would put us right in the target range.
Update (after the close): I would put the bounce target at 2093 ES (a 62% retrace) and that makes the downside target 2007.
_____________________
Original Post: Sunday July 3: Not to worry. I’m not going anywhere. The title of this week’s post is my projection for the start of the crash. The market should stay up until September to finish up the current EW ending pattern. However, there are some really great opportunities in the market leading up to that point, particularly in futures and currencies.
Let me say it again: Starting Tuesday, there’ll be some terrific set-ups in currencies and futures. I’ll outline them in the video and chart section below.
It’s true this is perhaps my final free post of this nature (I’m working on launching a paid service so I can keep this information coming for those who want to keep on top of where the market is going over the next few years). There will be much more to it than these posts. More Elliott wave info, nightly videos, and longer videos on the weekends. More to come during the week as I finish up the technical issues.
It will be as much about learning the basics of Elliott wave (so that you can be a more profitable trader), as about identifying high potential set-ups.
Last weekend I called for the market to rise up one more time. Apparently, I was one of the few to call for a new rally. Here’s what I said:
- Markets typically do not turn on a dime. Topping is a process.
- Markets don’t come down in one fell swoop. They zigzag. Even motive waves with big drops have large second waves that attempt to reach back up to the top before turning over. You just have to look a the big picture we’re in now. This second wave almost reached back up to the top.
- Events do not change a market’s direction. They don’t change world mood. The markets move to the mood of the herd. The mood of the herd determines events. I’ve never seen an event change a trend.
- Markets turn on cycle turns. We didn’t have a major one Thursday/Friday, but we have some major ones coming up.
- In the Elliott wave realm, patterns have to play out and you can’t have an ending wave in 3 waves, unless it’s a triangle of some sort. We’re stuck in “no man’s land” at the moment. I’m looking for a top that fits the EW rules
So, for all these reasons, without even looking at the intricacies of the current wave structure, EW logic tells me we’re not done. I seem to be one of the only ones to have called this rally. Well, we’re not done yet. This pattern is very likely an ending diagonal (a triangle) and, as such, it’s going to take some time to play out.
That’s why I’m targeting September for a market turn.
Bottom line: This past week created an ABC wave up, which should be wave 1 of an ending diagonal. There are five waves in an ending diagonal. Wave 2 should start down on Tuesday, July 5. I expect the bottom at around July 14/15. It should be large drop in 3 waves, but not to a new low. However, I can’t give you a target right now. I should be able to do that as the wave progresses.
As far as I’m concerned, the long-term trend is still up, but not for all that much longer.
The rules for a trend change in Elliott wave are very clear. We need to see five waves down at small degree and then 3 waves up to at least 62% with an turn down at that point (that’s the entry point).
__________________________
Andy Pancholi’s Market Report Video
Andy Pancholi has made public the next two turn dates: July 5 and July 14/15. He continues to nail these cycle turns. To purchase Andy’s high-end cycles report (or for more info), click here.
Wave Three Down
Here’s a link to a projection for wave three down in the SP500.
______________________________
Here’s a video overview of the market for Tuesday, July 5, 2016:
Market Report for July 5, 2016  |
 |
Make sure you zoom the video to full size with frame expander (arrows) in the bottom right hand corner and also set the quality to as high as your web connection allows. This is an HD quality video so the best viewing is at that level. |
_______________________________
The Charts Going into Monday
Here’s the 60 minute chart for ES (emini futures) with the count to now. I’m expecting to see a top on Tuesday at ~2103. We have a corrective wave up. It still lends itself to an ending diagonal finishing pattern. The first wave up is the largest of the pattern. This wave down will be in 3 waves (actually a 5-3-5 pattern). I can’t provide a target yet, but should be able to after we see the A wave trace out its 5 wave pattern.
NOTE: Here’s an EW guideline. Wave 2 usually retraces between 66 and 81% of the length of wave 1.
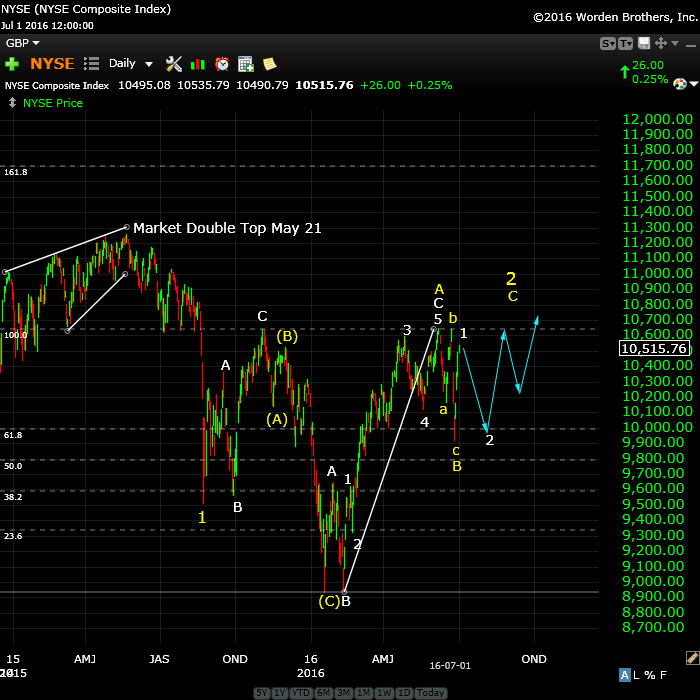
Above is the daily chart of NYSE (the largest cap index in the world) and the one we really need to pay attention to for the US market. I had thought at first glance last Friday morning that the NYSE had done a double top, but on closer examination, it missed by about $10.00 or so. That was a big clue that we were going back up to make the top “official.”
The setup has been screaming for an ending diagonal now for about two weeks. We’ve completed the first wave up (a corrective wave in 3) and this wave down should be in three waves, but not to a new low. That will all but confirm the ending diagonal.
NOTE: Here’s an EW guideline. Wave 2 usually retraces between 66 and 81% of the length of wave 1.
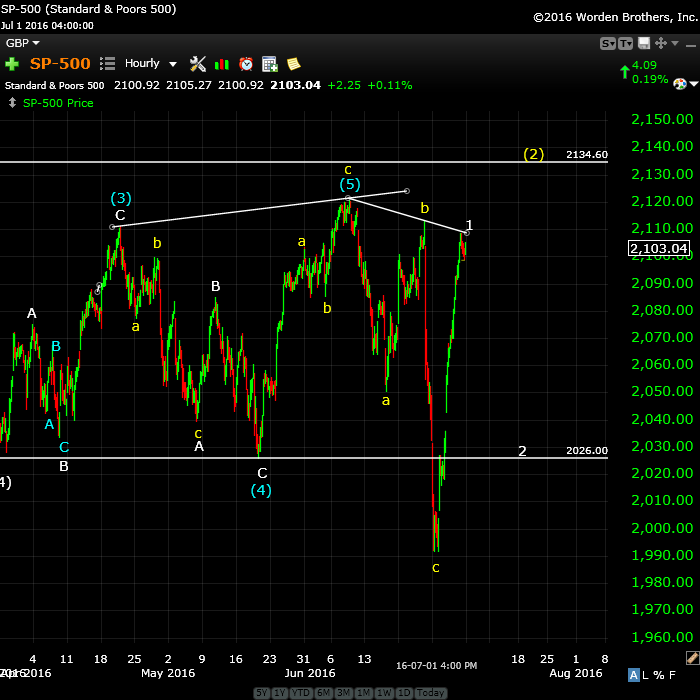
Above is the an hourly chart of the SP500, the first wave up of the ending diagonal. This should follow the same path as ES (above) and my short-term prognosis is exactly the same. I’ve placed a horizontal line at a possible stopping point for wave 2, but it’s just a guess. I show my thinking in the video.
NOTE: Here’s an EW guideline. Wave 2 usually retraces between 66 and 81% of the length of wave 1.
I don’t expect the SPX to reach up to a new all time high. However, it may get very close.
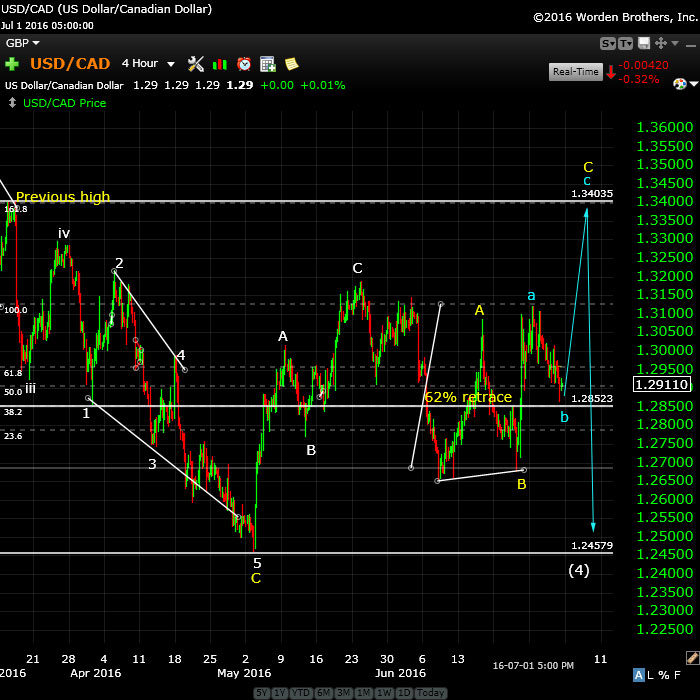
Above is the 4 hour chart of USDCAD. Finally we have all the currencies aligned and they’re giving quite clear counts. Take a look at EURUSD, USDJPY and CAD here and see how I’ve market out quite literally the same path for the them all.
This has been the most frustrating pattern to try to predict, until now. The yellow A wave is the exact same length as the blue a wave. The blue b wave has almost retraced 62% and on Tuesday, I would expect a turn from about 1.2852 (horizontal line) up to 1.2403 to complete the blue and yellow C waves. Then a turn back down eventually to 1.24570.
After that, we’ll turn up in a very large fifth wave, which will eventually take up to a new high for USDCAD.
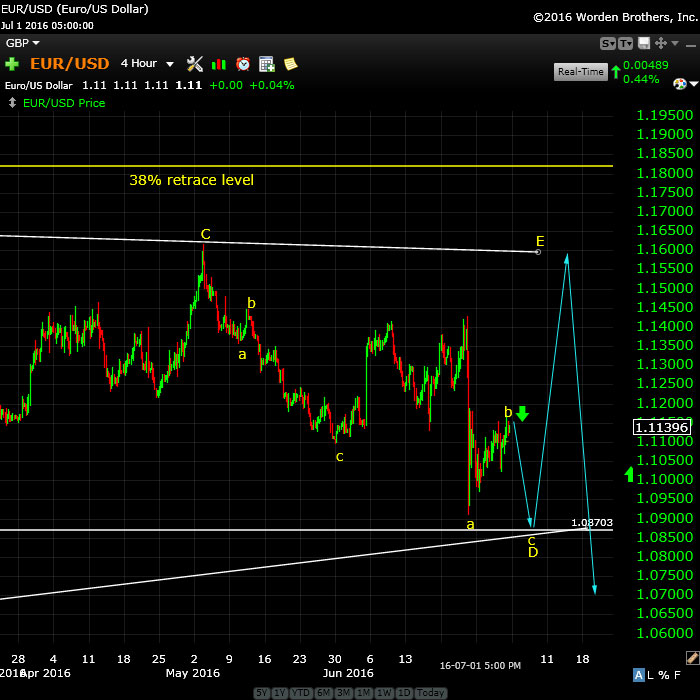
Here’s the four hour chart of EURUSD showing the ongoing triangle—the major (combination—a flat and a triangle) corrective pattern we’ve been in since March, 2014. We’re in the final stages of a bearish triangle formation, with one more leg up to go to finish the E wave. I’ve widened the triangle here to leave a distance between yellow D and E of .618 X the distance between waves A and B (not shown here), which is the typical wave E length. (I show more in the video)
This means that Tuesday, we should start to drop to the 1.0870 level and then I suspect when we finish wave 2 of the ending diagonal in the US indices, we’ll turn up in the final E wave of the triangle.
EURUSD should turn down after finishing the E wave in tandem with the US equities.
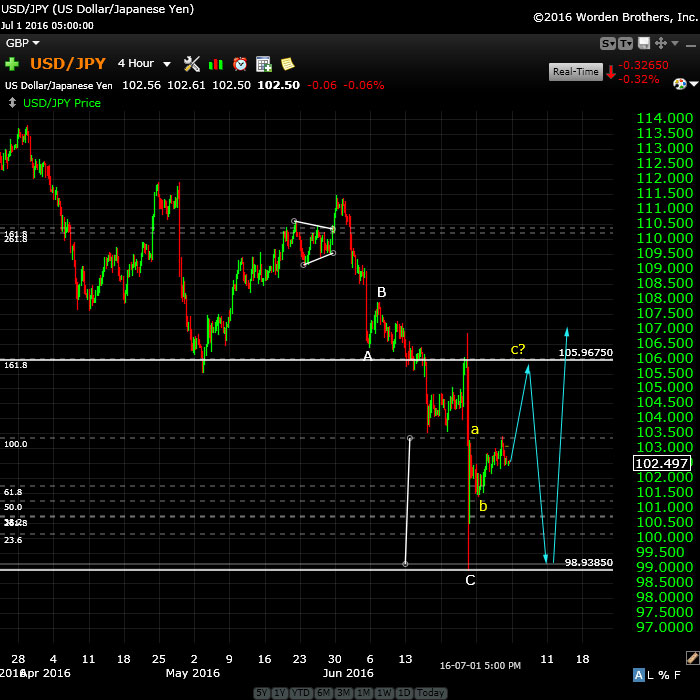
Above is the four hour chart of the USDJPY. We’ve now met my target at 100.5823 and headed a bit lower. We immediately bounced and now I would expect us eventually to head back down to a double bottom. However, as the other currencies complete their next waves, USDJPY should head up here in a C wave. NOTE: We may not rise nearly as far as what I show in the diagram. We may only reach the yellow a wave area and head south after that.
The next move down as the other currencies turn, is likely the double bottom I’m expecting, before a turn up in a very large 5th wave to a new high. Give this a couple of months to play out.
________________________
First Wave Down – What to Watch For
What we’re looking for (likely in September) to confirm a turn is a motive wave down in 5 waves at small degree. After that, we should get a second wave that will retrace up in 3 waves about 62%. That’s the preferred EW entry point. So don’t feel you have to rush in. There’ll be a much better opportunity at the second wave level than at the top and the risk is substantially reduced.
You’ll find a diagram in the forum here.
__________________________
History: The 1929 crash
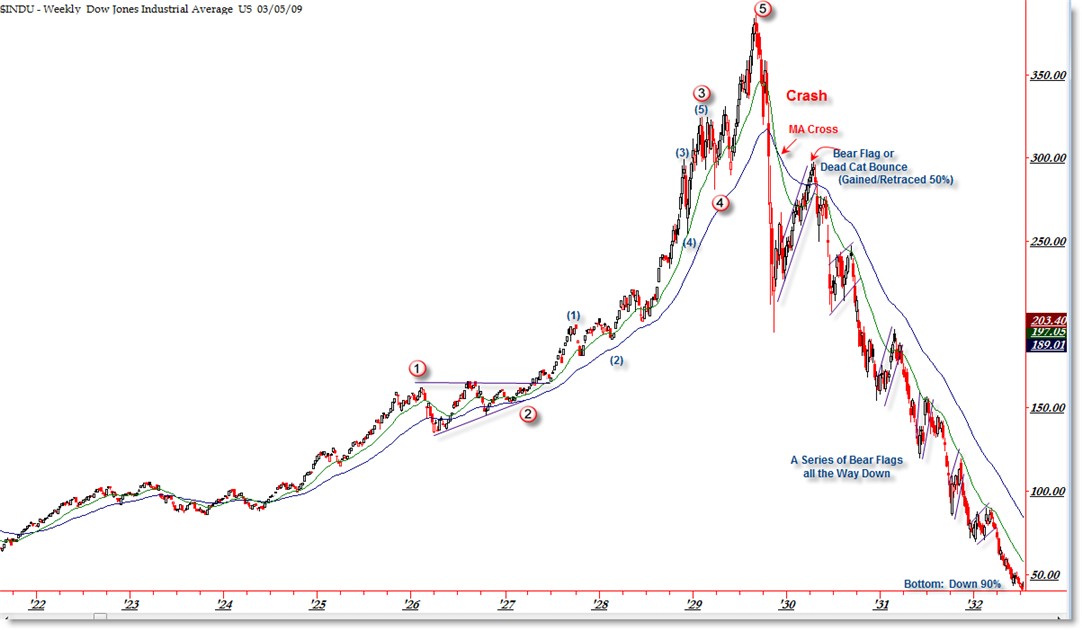
I think it’s important to look at 1929 and the wave structure (above and below), which was the same as 2007—to a point. I will show the 2007 crash below in the “What If” section.
The wave structure of the 1929 crash was in 3 waves overall. There were 5 waves down from the top (the A wave) and then a very large B wave retrace. The final C wave down was a stair-step affair and lasted over 2 years.
Let’s look a little close at the timing of the 1929 crash because the similarities to today are uncanny.
The market peaked on September 3, 1929 and then it took 2 months for the crash to actually happen (to reach the bottom of wave 5 of the A wave). The larger crash which we always hear about began on October 23, 1929. Then there was that large B wave, which lasted 5 and a half months and finally (which I explain a little further in the cycles section below), the C wave which went on for more than 2 years. This might be the scenario we’re looking at going forward.


First post, celebrate! Peter Temple thank you for Worldcyclesinstitute.com and the Elliot Wave lessons. Chart of US equities look like a fireworks display, which when they reach the top of their flight light up brilliantly. Imo slight chance of this happening this week with another 4% jump in US equities. Playing Vix calls this week don’t want to risk much and PALS suggests a pullback. Yet a 4% jump would reprice US equities to higher plateau with which to add interest going into Olympics and Conventions.
Peter, great work you have saved me a lot of money on trades I shouldn’t be making.
Laying in weeds watching your charts. I’m in on subscription.
Thank You,
Charles,
haha … made MY day! Thanks!
Some beginner questions:
{The rules for a trend change in Elliott wave are very clear. We need to see five waves down at small degree and then 3 waves up to at least 62% with an turn down at that point (that’s the entry point)}
Peter would you explain this a little more? What does small degree mean -any intraday timeframe? Does it only need to appear on one timeframe, no confirmation needed, either from other timeframes or other markets? If this indicates the COT then are all other pullbacks in an uptrend always in 3 waves or some other formation? If these are covered in Prechter’s book let me know, hope to order it this week. Thanks.
Hi Ellen,
That is a great question! And no, although the Elliott Wave Principle is a great book for explaining wave structure, it doesn’t give you any practical tips on trading. My course will, which I’m working on. I’m also just finishing my slides for an upcoming webinar, so I’ve added this topic and placed a visual in the forum here: https://worldcyclesinstitute.com/forum/elliott-wave-resources/change-in-trend-market-top/#p86
You’ll need to be signed up in the forum to see it. I’m not putting here because it will last much longer in the forum and be accessible to everyone who’s a member.
So “small degree” is EW lingo (I try to watch that, but sometimes I screw up) and really just means the first set of five motive waves (there are rules for motive waves), which will be a very small set of waves.
In an established trend, all waves in the direction of the trend will be in 5, all corrective waves will be in 3’s. That’s all covered in the book.
Hope this helps.
Hi Peter, in this post you say that Andy’s continues to nail the turn dates but his June 29 turn date for the S&P was a miss, wasn’t it? Or am I missing something? Please let me know, thanks, Alan
Alan,
I’ve commented on this last week. The 29th was a minor date for the SPX only. It was the top of the A wave, so it was not a miss. However, Andy had placed it on the cover of the June issue, which indicated it was a major date. The major date was the 24th/25th (in the spreadsheet that he also provides, which is all I look at). So I think what happened is that he transcribed the wrong date to the cover. I’ve emailed him on this but haven’t heard back. I think he’s taking a few days off. But I’ll let everyone know when I hear back.
I always look at the spreadsheet because that shows all the dates. The major ones are the ones with clusters of turns for at least currencies and equities.
Ahh, that explains it. I did notice that only the S&P had a turn date so I agree that it didn’t make sense that the 29th was listed as a major date on the cover. Thanks for clarifying Peter.
below is an email sent to a number of my trader friends…Peter has seen the email…want to memorialize my take on Peter’s work and offer him best wishes as he moves forward!
_______________________________________________________________________
From: rotrot
To: my trader friends
Sent: Tuesday, June 7, 2016 7:42 AM
Subject: Peter Temple (World Cycles Institute)
Peter Temple (World Cycles Institute) is brilliant…have carefully read and studied his work…although his forecast of the daily squiggles and wiggles is not always exact, his overall analysis is as close to perfect as you can hope to find…and it is free…his utilization of currencies to validate and forecast the stock market moves is particularly interesting…do yourself a favor, take some time to review his analysis and forecast (short and long term)…you won’t be disappointed!
Thanks rotrot … for all the support. very much appreciated.
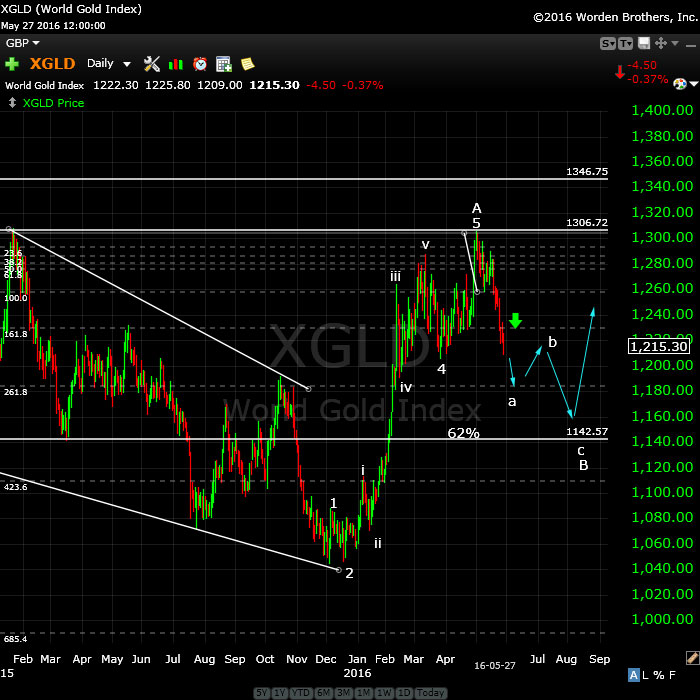
What’s your outlook for gold it’s been having a good run but do you see it moving down soon..thanks again, best regards
Hi PJM,
I talk about it in my video this weekend. I still see it correcting down. However, if it goes above its current high (1362.60), I would change my outlook.
USDJPY is 101.74 … hmm wondering if it could head to the double bottom at you talked about at 98.93 instead of going up to C wave of 105.96
Yes, I put a note in bold on the chart saying it would do one of two things (at least I think I did), and it’s doing the second, a turn at the fourth wave area. It should come down in 5 waves. This is the first, watch now for a second wave to retrace about 62% of the drop and head down again.
I would expect a bounce in USDJPY shortly at 101.2425 or so. This wave down doesn’t look motive, so I’m not sure what the game is. We could still see a big bounce to that C wave high. Not sure. I wouldn’t expect it to bottom before everything else finishes and hits targets. USDJPY would be something I would be very cautious of right now.
Short term cycles turn down beginning today and target a low on July 21st.
2 year cycles is flat until July 8 and begins turning up July 9
From July 21 to August 4th the Dow should be up.
Major Key dates where both cycles match .
August 4th
Sept 1st-2nd
Sept 16th
Nov 14th
Dec 12-13th
Feb 3rd 2017
17384 closing support for the Dow
below that is 16820.
Resistance is 17948 ( basically Fridays close )
The conflict sits with the 2 yr cycles versus the short term cycles
One being flat the other pointing down .
after July 8 the market may stall and then accelerate up following the
July 21 short term cycle low .
Its to soon to be aggressively bearish .
Joe
Joe,
If short term cycles are right the low will be July 21?
Do you also have dates in between like (Andy) Juli 14,15?
I m short and my strategie is to stay short till July 8 if that turns out to be a short term top I will hold on to my shorts till July 14/15 if not I will sell them.
Thanks
John.
I just posted a chart of ES but can’t give much more guidance than the fact that we hit the target and turned down.
USDCAD has been on the move since yesterday.
Hi Peter. Do you think oil has topped at $52 and we head down now? Or is your base case still for a rise to $62 followed by a bigger drop?
I’ve always said it will either turn here or at 62, but I can’t quite tell with the wave structure. The subwaves don’t look motive to me (which would mean a turn down), but I’m not sure enough to pick a direction at the moment.
If I were to pick an inflection point for a B wave to start in ES, based on some fib measurements, it would be 2071.
I just updated the chart of ES at the top of the post.
Was in cash today, avoided draw down. Have limit order on call options on SPY that expire Friday 208.00 limit price 1.00. Hoping to be filled tomorrow morning and will hold until Friday.
This worked well these calls are profitable. Looking for 210 on SPY by Friday.
This trade was profitable at Friday closed above 210.
I added a couple of targets under the ES chart (2093 ES for the upside and 2007 for the eventual target to the downside).
USDCAD. Has hit its first wave target of 1.3016 and should retrace 62% now to 1.29 (it will trace out a very small second wave here to the upside before continuing down). After it hits 1.29, it should turn up into a third wave.
John
my timing model does not show Andy’s cycles
yet I can see them .
as noted July 9 the 2 year cycles turns up even though
the short term cycles point to a low on July 21 .
we’re into a mixed picture at the moment .
Peters wave count based on the weekend updates appears
to be on the money plus minus a few minor details yet the overall
picture he laid out is worrth serious consideration.
all my cycles work points lower from Aug 4 th .
today’s drop was expected . the problem I’m seeing with any bullish
calls is the bigger picture is turning downward into Jan March 2017 .
I’m going to watch the euro along with the 10 day moving average of the daily adv decline line . 17808 on the cash Dow is an important level as is Friday’s close ( 17948 ) . keeping above 17808 is technically bullish yet
17820 – 17812 is the next lower support .
my bias is more of the bigger picture than the short term noise .
my gut says be concerned with the July 21 date .
something to me says expect as Peter says an unexpected market with in an expected move .
that’s not a quote yet if you listen to his weekend video he touched on it .
July 21 is the key date from a historical perspective .
it’s not always what we expect the market to give us .
sometimes we must accept what we get .
the euro appears to be holding so we need a news type event to complete the wave count ( I hate trading based on news )
Joe
Thanks Joe,
Very interesting times and big moves are comming that is for sure.
I still play my cards for a big down move, like Peter is showing us.
Have you seen the latest video from Andy the part he talks about the euro is very interesting and I think we will see a big down move in the euro around 14/15 July.
(The news will probably contain a big (Italian) bank failure).
http://cyclesanalysis.evsuite.com/how-to-use-the-market-timing-report-optimized/?inf_contact_key=f7c0ab35717bfaa18ff3698d87df0d8d5e98a6f4dded3d53dc356fcad5fb2316
Good luck to all.
What I wanted to ad there is a big head and shoulder formation in euro/dollar (March 2016 till now).
The euro is stuck by a big (Brexit) bumble and the one’s that did this have left the ship.
I’ve never seen a more difficult market to try to trade. My count on the USDCAD, although looks correct has ended up in an ending diagonal, which is impossible to predict an end to. In fact this currency pair has traced out an ending diagonal in both directions and this one has an ending diagonal within an ending diagonal!
ED within and ED? Can it get any better Peet? >< Good luck with that! 🙂
Cheers,
W
Hi Peter
Wanted to ask if you have an idea of when you will be offering your E W training course?
Thanks
Michael
PS. Thanks for all the help. Looking forward to your new site.
Michael,
A couple of weeks at the most, I hope.
Thanks Peter.
Peter
I have finally finished catching up on my sunspot data and
I’m a bit surprised by what I’m seeing .
the Sunspots have not just declined they have Collapsed .
to add to this i had created a comparison chart a few years back
based on a repeat of the Dalton minimum and the correlation
to today is amazingly close .
the comparative time to today would be January 1807 .
The solar maximum was from Oct 1804 to January 1805
and my data I’m correlating this to is the period of
may 1798 to Jan 1813 compared to august 2009 to Nov 2021
( yet can be extended out to march 2034 )
i have data from 1784 to 1826 yet when i created this i was
considering a normal cycle so I’m leaving it as is .
i was 2 years behind on data and today’s catch up was a pleasant surprise
to see.
If this continues which I’m assuming it will the global warming crowed
may have to change their story or i guess claim that global warming
has now caused the cooling .
Joe
also i should add.
the data i use is daily data yet its converted to a 3 month average and plotted
monthly .
John
I am watching Andy’s video that you provided the link to .
he said many times you must have your own trading system
in order to use his newsletter. also he uses lots of historical
data and statistics .
that is very good advice .
I’m guessing you are way more in tune to Andy’s work than i am
and I’m not about to question the mid July date yet i am going to trade
based on my system .
I’m perfectly OK with missing a shorter term movement if i question
what is going on and also i tend to wait forever if need be for a set up
to be in place before placing a trade .
some people may not be aware of this and maybe peter can touch on it
yet there is also a correlation with the annual sunspot cycle to the USA GDP
data . If history holds true then this bear market when it does come may just
be a loud thump with no bounce what so ever .
our governments are going broke , the masses are becoming fed up with their leaders and the taxes and regulations are killing our economies .
Joe
I agree Joe,
You have to follow your own system and I m trading on the AEX and DAX that is telling a different story right now (minus 1,91% and minus 1,67% today)
I have the following short term dates July 7/8 ,July 13,July 21,July 30 and August 4
If we make a lower top July 7 and 8 then I think we will see a big drop around July 13 and a huge rally Till July 21.
Let’s wait and see.
WW3 may also be around the corner or what Joe? Wouldn’t surprise me… 😉
Cheers,
W
I posted a chart of ES up top.
EURUSD. We’re in a second wave bounce at the moment, which should target 1.11255 before a turn down into a third wave.
USDCAD. Same thing. It’s targeting 1.29224 (second wave) before a turn up into a third wave.
Pete, I have a question about a Job Abraham that post on here…He has a Blog that can be found at jobjas.wordpress.com. I accessed his site several times and found it quite interesting. For some reason access has gone private…Do you or anyone else that posts here know how to access Job’s site.
And how do I become a subscriber on your paid site that is about to start?
Hi Peter
I hope you are feeling better today ?
When are you going to start your paid subscription service ? since there are many things I would like to share with you & your subscribers, but I avoid doing so in this open forum …. since I do not like to be attacked … etc
Any way last week if you do remember , I said the ES failed to stop @ 78.6% ratio , and the next ratio that might stop the price will be 88.6% ( price target 2104 ) . Well this exactly what happened , and price stopped @ 2104.82 and moved down.
Of course we all know that Sq-root 61.8 = 78.6 % and Sq-root 78.6% = 88.6% A VERY IMPORTANT RATIO
Over the years I have noticed if price re-act to 88.6% once , then it could do the same for the next few swings , and then after that will move back to re-act to the 61.8 % ratio and other classical ratios .
I feel that if 78.6% fail to stop the move that have started up yesterday from ES 2065 , then 88.6% ( ES 2100 – 2101 ) will stop it , and then go down .
Of course if the price will not stop at that ratio 88.6% , then we could just go up higher and higher …..
Peter … do you know I like 2160 more than 2134 ( yes, I know you will say not again ) .
I am sure you know the importance of that number …. it is the most important number in the whole esoteric world ! and the S&P love that number ……
Peter … do you know what was the price low after Oct 1987 crash ….
Well let us leave it here …just in case you are still under the weather :-))
Regards
AZ
AZ,
Yes better this morning. I’m hoping to get the technical aspects finished today. I lost a couple of days this week, so if I don’t get it up and running tomorrow, I do the regular routine this weekend again. Don’t know the answer to your 1987, but I suspect you do. If not, it’s easy enough to find out.
AZ,
The ending expanding diagonal I just posted will give you 2160. Just, by the looks of it.
The alternative is a target just under 2134, which is my preference as NYSE is nowhere near a new high.
Pretty powerful b wave this one!
Yeah, and it may in fact, do a double top. I didn’t expect that. (a double to 2105 in ES).If that’t case, we start over with my projection for the bottom. We’ll need to wait for the a wave down. It should still drop to the projected 66-81% area.
Peter, in looking ahead-andy has major turn 7/14-15, how does timing possibilities look for this move down and the final rally to complete 2, and get it done by the 14 or 15.
Thanks TAJ
TAJ
So far, no change.
ES did not go to a new high, or double top, so the targets haven’t changed for the downside.
I think it probably will be a sudden fall to the wave c target area sometime next week over 3 days or so. Time to start building shorts today for me!
We have a labor report at 8:30 am EST, as well.
7/11 is a crashdate and very likely a high. Then down into 7/13 and up again into 7/16-17 (expiration). After 8/1 (high) we should see some more downforce.
Cheers,
Andre
He lives! 🙂
Still breathing. Had some work to do.
This weekend I’ll post my analysis for the next few weeks.
Cheers
Good to see you back.
Great jobs report! Looks like the drop will be next week or maybe Andy’s dates weren’t correct this time.
Lets see how the rest of today shapes up. Might start dropping towards the end of the day and carry over into Monday.
I think we’re morphed into an ending expanding diagonal rather than the converging one.
Looks like we have 2120 coming on SPX. Could we see it heading for final destination early with next stop in the 2130-50 range? Can’t wait for your premium service. I want to dive deeper with EW.
If this is the C wave (chart coming shortly), we should hit 2114, before turning over.
2124 is also possible.
Sorry, my numbers are in ES.
A new chart of ES is posted.
Thank you! Where do you see this topping now? 2140+?
Peter,
I have a turn today ,it should be a top after that a drop and another turn July 13 after that a strong rise into July 21.
This market is (a year of the monkey) grazymaker
John does not look like it can be down to 2000 in 3 days
It looks more like the blow off top we were all expecting to 2130.
I agree. It looks like the 15th is a top now, and I’m leaning towards the expanding ending diagonal again. That seems to most plausible solution to what this pattern is that’s playing out. It works in SPX, DOW, and could in NYSE (but it has a lot further to go …).
No I don’t think so a set back (July13) and afterwards strong up.
I would not be surprised if we see a blow off top SP 2200 plus..
I’m working through some minor technical issues on the service, so it will be early in the week for a launch. I need some time for testing. Another free weekend coming up.
Peter,
we have constantly change our target is this always the case
No, not typical. I’ve said from the beginning of this pattern, it’s a very unpredictable pattern. In fact, ending diagonals are the most unpredictable of any pattern in Elliott waves. Plus we’re at a major top.
I’ve rather quickly posted an ending expanding diagonal. I mused about this early on when I said this is a triangle of some sort … These are rare, but certainly befitting of a major top.
I suspect this will lead to a top on the 15th. It doesn’t have that far to go. Let’s see how today plays out, but I wanted to alert you as to this option.
On the chart above looks like 2160+ could now be the final destination for the top?
I’ve revised the chart slightly and drawn in two upper trendlines (alternatives). There are very few guidelines as to ending expanding diagonals. However, if I were to measure the subwaves of the wave up from ~1990, then it puts the top at 2132.00 in SPX. The higher trendline would take us higher, but I don’t have measurements to support that at the moment (not to say I won’t once I have more time to look at it).
I expect we’ll do a small 4th wave here in SPX and then a small 5th up to a top. I haven’t had a lot of time to do this properly (why I don’t like doing intraday analysis) but looking around, other than USDJPY, I may change predictions for currencies this weekend. USDJPY is close to bottoming, which fits with what the US market is doing.
Peter
Slowly … slowly … you are getting closer to my targets :-))
If you have a pivot around 15 July , then it means SPX will reach my second target of 2160 .. ( first is 1234 )
Yes … I do remember very well the low in Oct 1987 …. how can I forget it !
Have a nice weekend
AZ
I am probably breaking all kinds of EW rules with my chart, but I wonder, zooming out for a much bigger picture, similar to Purvez’s suggestion, whether May ’15 was only top of W3 of W5, and are we now in an ending diagonal to finish W5 of W5 to a new ATH??
Go ahead…..tell me all the EW rules I have broken….. (that is how i learn)
weekly chart ES
http://invst.ly/205nd
amb,
Not “kinds of EW rules” 🙂 but the main one is that an ending diagonal is a fifth wave and, as such, can’t go below the fourth wave low and still be valid. So, it’s not an ending diagonal.
Hi Peter
I’m looking at your 2nd chart from the top (as at 8th July 19:32 BST). You start your 1 (white) count from what appears to be a mid wave structure.
My understanding of ALL triangles is that (when counting from a 3rd or A wave top) the first wave is always a LOW rather than a high. On that basis I would expect your white 2 to be white 1 and all others to shift one to the right. Which means that we are currently in a white 4 up and then we have to have a white 5 down to complete the blue (4) and then finally a blue (5) up to complete the FULL wave structure.
It is quite possible that I have misunderstood your count and your blue (4) is valid as an expanded flat but it certainly doesn’t fit in (with my world view of expanding triangles).
I would really appreciate your help in understanding where I’ve gone wrong with your count.
Thanks
Purvez
Purvez,
You’re very possibly right on the triangle, although this is a diagonal at the moment that I’m focussed on (diagonals are in numbers, not letters). I’ve done this very quickly in the midst of calls, etc., so I’ll take a closer look tonight. With what I’ve drawn, the fourth wave would have to change, I think. The first wave of a diagonal, of course, is always a high (in a bull market). It’s not an expanded flat, which is a corrective wave and would be pointed in the opposite direction in this case.
If we have one more drop, it will be very large and we have no cycle turns coming up until later in the week.
Aaaah!! My ERROR. You DID keep referring to a ‘diagonal’ rather than an expanding triangle. I apologise for the confusion I caused.
I’m starting to step back further with this ‘wave’ and looking all the way back to the May’15 top….only in the DJIA (since that is what I trade). I know you always look at the bigger ‘all inclusive’ picture but I suspect that although the ‘intermediate’ wave counts for the different indices may differ they ALL come together at the end……which is exactly what you are showing us.
I have a hectic weekend with guests so I’ll try and post a chart of the DJIA with my count in the early part of Monday….hopefully before the world ‘WEST of GMT’ awakes. LOL!!
Many thanks for ALL you do for us.
Purvez,
There’s another configuration of this triangle in SPX which would make this the final wave, but I’ve just noticed it and I need some time to look at all the indices and everything else that’s going on. I have had little time today to spend on this.
Draw a tops trendline from December 29 high through April 20 high and it hit today’s high virtually exactly (S&P cash). Today is 55th day in a cycle pattern and 203 days in cycle pattern. Peter T’s futures number 2124 was hit almost exactly…rally took place on BS news story. Smells like a potential top and a potentially final top in this whole frustrating process. Would be unusual to see a Friday high without next week follow-through but anything is possible…
haha, well no, anything’s not possible, but I understand the sentiment. I think we have the pattern figured out now (still a little early in the game, as the the upper trendline isn’t quite formed yet), but a triangle as of today makes a bit more sense than hanging onto a diagonal. This is a horizontal pattern, so can really only be a triangle now (not a diagonal).
If so, the final waves are straightforward. One down, one up, but again, I’ll go into more detail on the weekend when I have more time.
so peter, in your quick ES chart up top, you are calling for new all time highs??? – and this 4th wave “horizontal” triangle has a time horizon completely out of place with the 2nd wave – the “look” between 2 and 4 seems “off”.
the 4th wave will also be longer in time than the 3rd wave?? hmm..
rich,
Don’t know about the new high …. haven’t got that far. 2 and 4 had better be “off” because this is a corrective wave (abc). As such, it can do anything it likes. There are no rules, other than fib relationships.
Make that Dec 30 high of 2015, not the 29th, although it doesn’t change the angle at all…still a virtually perfect hit at today’s high…
As we end the session, I’ve thrown up a chart of ES showing an expanding triangle (as I had it already partially drawn), which I will expand on this weekend and provide some other charts. Thanks to Purvez for pointing this out!
SPX all time high was 2134.72 on May 20, 2015…what happens to the EW bear count if SPX exceeds that price level?
June 19, 2016…”Here’s a link to a projection for wave three down in the SP500″
https://worldcyclesinstitute.com/forum/long-term-charts/sp500-wave-three-down/#p85
Rotrot nobody is talking about wave 3. Now talk is is spx 2200 to 2300. No correction even
XII (Institutional Index) hit a new all time high today at 947.71…the previous record high was hit in May 2015 at 946.58…
Peter, people are saying all bear counts are out
Next week has lunar weakness (mid phase, apogee, and post equator south declination). Betting on downside using VXX calls. Today (Friday) we had very elevated K index and market had swing up. If K index stays high (solar ham.com) will be looking for nice 3 to 4% fall next week =)
Basically we are down into april 2017. That would be 360 degrees from may 2015 in sqr9 1929. But short term we see some cycles that are still up.
To start with the last one : 8/10-13 is the last serious date to test before we head south. Untill then I expect more consolidation. But with every passing week support grows weaker. 7/11 is a major date. Arguments :
– vedic squaring out,
– Bayer rules 17/38/32
-Saturn retro mp
-Mercury 80 years ago change in sign.
– HC mars 90 degrees Jupiter. (12/1/15 was conjunct)
To name just a few.
However; 7/15-17 is important and must be a high. So a low on Wednesday is to be expected.
After 7/15 the next major date will be 7/31-8/1. So I expect ABC up from mid july into the end of july.
After this there is one last test : august 10-13. Vedic Jupiter will leave Leo 8/10. Another Jupiter cycle targets 8/13; based on declination and velocity. And we will have Mercury max east 8/16. The last time Mercury was there was 4/18 and caused the major 4/20 high.
The sunspot forecast is down and recently we have seen a spotless sun. This is a strong indication the sun will be quiet for the next few years. The last short term peak was in february. Sunspots down is market down.
The fact that everyone is bullish (not me) confirms this analysis. Cycles explain everything the market does. And cycles never turn at the same time. First comes the long term cycle, next a shorter one. And so on. Until we have run out of cycles. The longest cycles turned in 2015; all multiyear!
So I don’t think we will make it into September. The vix is deeply oversold en will start to rise shortly. The 6/23 high a very significant event. Had the British done the referendum a week earlier, they would have stayed. How they managed to pick this date is beyond me. But this date was programmed to cause a decline.
Maybe tomorrow some more on 2021. For now : enjoy the weekend.
André
Andre, please think about putting your long term forecast in the forum…
Will do.
David McMinn (http://www.davidmcminn.com/) researched stockmarket crashes and is convinced they can be explained by sun/moon cycles. He says the angle between Apogee and the North node times the crashes. More specifically : when we see a trine the market will crash.
It’s easy to see the next trine will come in 2017. This fits nicely with the 2021 timing. I think wave 3 will start in the second half of 2017. Want a date? Try 9/21/17.
I am not the EW specialist here but could it be we are in w1 now, with w2 in 2017, w3 down september 17, a low 2018/19, w4 up into 2020 (Jupiter/Saturn conjunct) en w5 down into 2021? Just a suggestion, but maybe our host has some ideas on this 😉
p.s. For the sceptics; 6/23 the Apogee/Node angle was 45 degrees; exactly on this date! So maybe it’s wise to keep track of where this angle is going.
Hello andre,
what please is the Apogee/Node angle?
Or anybody else who knows,
would very much appreciate an explanation.
Thanks, Richard
The moon has an eliptical orbit around earth. The axis of this elipse makes an angle with the node. As you won’t find apogee in the ephemeris you should use lillith or black moon. This is an imaginary point on the axis.
If you use the nodal/draconic chart, the angle I meant can be seen directly.
Hope this helps.
André
Andre’
thank you 🙂
joe
mercury retrograde cycles 2016
January 5 – January 25, 2016 First in air Aquarius, then in
earth sign Capricorn
April 28 – May 22, 2016 in earth sign Taurus
August 30 – September 22, 2016 in earth sign Virgo
December 19 2016 – January 8, 2017 in earth Capricorn, back
into fire sign Sagittarius
Fibo fun.
From 5/20/15 until 9/21/17 is 855 days (856 is cardinal!). An 1.618 extension on this number gives 1381. Add this to 5/20 and we get 3/3/19. Could this be the 18/19 low I wrote about above?
The 2.618 extension gives 7/5/21. 6/14/21 we have Saturn square Uranus.
The time price vector on the Eurostoxx 2011-2015 cycle gives 5/26/21.
3 different techniques give a range of 6 weeks on a 5 year forecast. Nice.
3/3/19 would be a 10 year aniversary of the 6/3/2009 low. Coincidence?
make that 3/6; damn american notation 😉
Last mail today. I read a book on cycles by Bob Garrett. I have the E-book and if I knew how to upload it I would as I think it is a great book.
Anyway; Garrett says 221 and 78 weeks are major cycles. From the 2009 low counting 1,5 221 week cycles (half up, half down, half up); we get the 7/21/15 high. This was the end of the consolidation and caused the August decline. 4 times 78 weeks from this date gives 7/20/21. As shorter cycles tend to bottom when larger cycles peak 7/21/15 was a 38 week low. Hence, 4 complete cycles from low to low.
p.s. That 221 was up and 78 down is perfectly possible and gave a consoldiating market from mid 2014.
Read this book! It resonates with me as he begins by analyzing the harmonic structure in musical tones. This is very Pythagoras, very Gann and very vibrational.
André, you could easily upload the book to the forum.
12 years 3 months to 12 years 8 months from the
march 2000 and Sept 2000 highs called for a low
in Nov 2012 .
Oct 2007 plus 12 years 3 months to 12 years 8 months
is Jan – June 2020 .
15 years low to high is another rough way to look for tops
7 years low to low followed by 8 years low to high another .
2002 plus 7 = 2009 plus 8 = 2017 high
2002 plus 15 years is 2017 .
gann has the 10 year pattern of 10 years high to high
or 10 years low to low .
also 5 years high to low .
1987 high 1997 high 2007 high ( 2017 high ?)
1987 plus 5 1992 low ?
1997 plus 5 2002 low
2007 plus 5 2012 was A low
2017 plus 5 2022 low ?
1987 plus 15 equals 2002 plus 15 equals 2017
watch Oct 2017
Just a thought
Joe
This website is for educational purposes relating to Elliott Wave, natural cycles, and the Quantum Revolution (Great Awakening). I welcome questions or comments about any of these subjects. Due to a heavy schedule, I may not have the time to answer questions that relate to my area of expertise.
I reserve the right to remove any comment that is deemed negative, is unhelpful, or off-topic. Such comments may be removed.
Want to comment? You need to be logged in to comment. You can register here.