Best of the season to all of you!
I hope you have a chance to connect and relax with family and friends over the holidays. Enjoy the relative peace we’re having over this year-end stretch, as my fear is that the New Year is going to be anything but peaceful, socially and economically.
If you’ve been following my posts, both related to the market and what history tells us is in our future, then you’re well aware of some of the challenges ahead of us. In next week’s blog post (year end), I’ll list some of my predictions for the coming few years.
Today’s “free” blogpost is a copy of my Trader’s Gold Premium Service blog, to give you an idea of what goes on there. Next week, I’ll be unveiling a two week trial for anyone interested in trying it out (this will be an ongoing offer, but I’ll formally announce it next weekend).
All the Same Market
The big picture to keep in mind is that the pending top of this market on an international scale is based upon the deleveraging of debt. You can look at the DAX, the DOW, the GDOW, or currencies and you’ll find they’re moving more or less together as they prepare to top at much the same time. That’s one of the reasons I expect the drop, when it comes, to be so dramatic. Virtually every asset class will start to implode. It’s not that far away: It’s a matter of weeks rather than months, in my estimation.
There are some minor anomalies, which often happen at major tops and bottoms. For example, not all the US currency pairs have been in sync over the past week or so (ever since the Yellen interest rate announcement of Dec. 14). You’ll see from my report today that the EURUSD pair is out-of-sync with GBP, CAD, and AUD. However, I’m expecting them to get back into sync for the final move to their corrective targets.
As I’ve been saying for the past few weeks, this is a very dangerous market. If there are surprises, they will be to the downside, as we’re so close to a top. Even so, I don’t expect an Elliott wave “truncation”; I expect all the patterns to play out and reach their final conclusions as per the wave principle, before the final turn.
Based upon the current patterns evolving in the markets, we should get adequate warning of the turn. However, the trading “herd” will be focused on a continuation of what they currently believe is the start of a secular bull market. It definitely is not.
“Thank you!” to all of my followers.
Today’s sharing of the Trader’s Gold Blog Post on the market is a “Thank you” to all of you who’ve been following along since I started regularly blogging and sharing my market analysis (about a year and a half ago), whether you’ve offered a comment or not. My overall goal is to help pass along the information I have on where the economy is headed and why, so that as many as possible can benefit from this knowledge not only in the short term, but for many years to come.
The Current Ending Diagonal in the US Indices
This particular ending diagonal is extremely rare. In fact, nobody to my knowledge has ever seen one at cycle degree or higher at the end of a corrective wave (at least, in a bull market).
Ending Diagonals
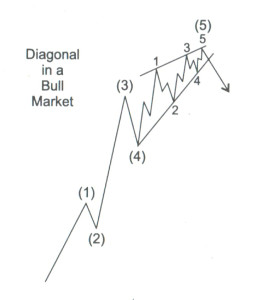 We continue to work our way through the ending diagonal.
Ending diagonals are rare at cycle degree. Wherever they trace out, they suggest a market that is extremely weak and barely able to achieve a new high. Although ending diagonals usually fall under the banner of a motive wave, they have properties more aligned with corrective waves. Ralph Elliott described an ending diagonal as occupying the fifth wave position of a motive wave when the preceding move has gone “too far too fast.” He maintained that it indicates “exhaustion of the larger movement.”
This particular version of an ending diagonal is extremely rare. That’s because it’s at the end of a corrective wave. And that, I believe, is primarily due to the fact that the rise from 2009 has a large central banker component—an “unnatural” element to it. It has fuelled the bullishness of the herd, but not in a sufficient way to effect a truly “motive” market. We’re barely making it to the top.
You can see in the diagram above that the first wave of the ending diagonal (wave 1) starting from (4) is in three waves. This is the usual structure of a motive wave—all waves must be zigzags, starting from the fourth wave of one degree higher. Usually, they begin after the fourth wave of a motive five wave pattern.
However, in the chart below, you can see that from the red (4) to the red wave 1 of the ending diagonal, there are only three waves (blue ABC). In fact, the three waves are a zigzag and actually make up the whole of the first wave of the ending diagonal. That’s because the wave from blue B to red wave 1 is in five waves (it is NOT a zigzag; it’s just a “zag”). This gets down really deep into the intricacies of Elliott waves—and supports it as a science.
Projection for a Top
Based on the ending diagonal we’re currently in (which is the pattern playing out in all the major US indices), I’m still projecting a final top to our five hundred year set of Supercycle waves sometime in January. However, the market has such small volume that it’s moving very slowly to its conclusion, so my timing projections have continued to slide. Ultimately, Mr. Elliott’s waves will forecast the end and give us adequate warning of the turn.
______________________________
Here’s the latest daily chart of ES (emini futures):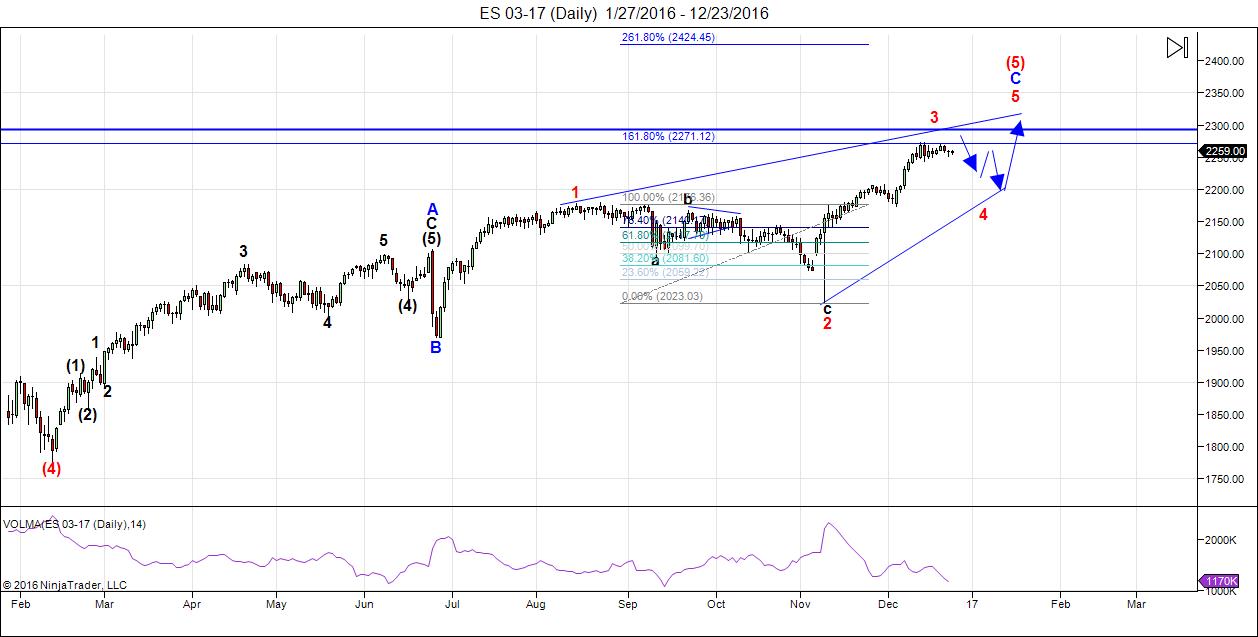
Through fibonacci ratios, I’m projecting a possible top for the third wave of the ending diagonal for ES of 2292-2294. By extension, it projects a top for the third wave for the SP500 of about 2294.
Here are the rules going forward:
- Wave 3 must be shorter than wave 1 and reach a new high.
- Wave 5 must be shorter than wave 3 and reach a new high (usually it does a “throw-over”—extends above the upper trendline defined by the tops of wave 1 and 3, but it is not necessary.
- Wave 4 must be shorter than wave 2 and must drop into the area of wave 1.
- All waves must be in 3’s (zigzags).
- The trendlines of the ending diagonal must converge.
Summary: We are completing the third wave of the ending diagonal before zigzagging to the top of the largest bubble in history. The long awaited bear market is getting closer.
_______________________
Here’s the latest HOURLY chart of ES (emini futures):
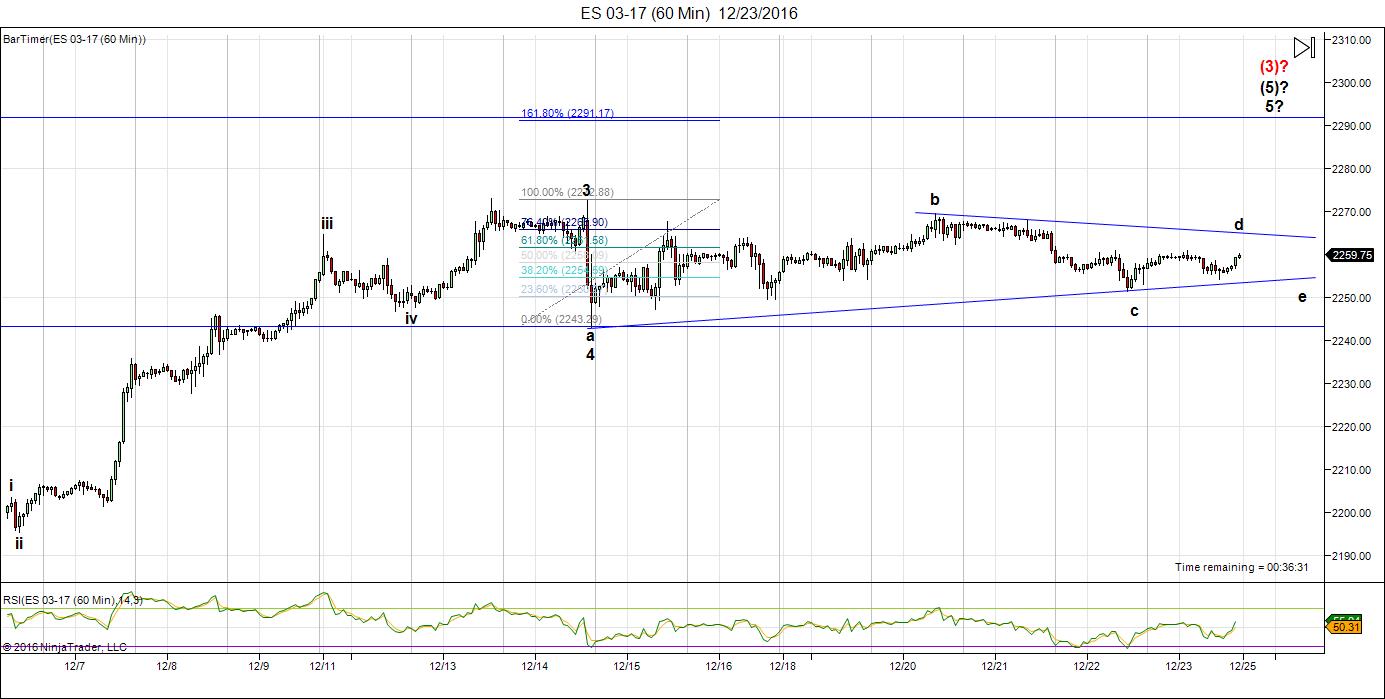
Above is the 60 minute chart of ES showing our progress to the end of the day on Friday.
We’re in a tightly wound fourth wave triangle of the C wave of the third wave of the ending diagonal. We need to complete the d and e legs before continuing up in a final wave to the target. My target is about 2292.
That should lead to a turn down into the 4th wave and then a final 5th wave of the ending diagonal up to a new and final high.
_____________________________
Some housekeeping:
Andy Pancholi Turn Dates (remaining – December)
- SP500: 28
- EURUSD: none left
* Denotes major turn date
The free blog post has a copy of this post this weekend.
The Chart Show sign up is live for December 29. You can sign up now in the usual spot: Webinars
________________________
Here’s a video overview of the market for Tuesday, December 27, 2016:
_______________________________
The Charts Going into Monday
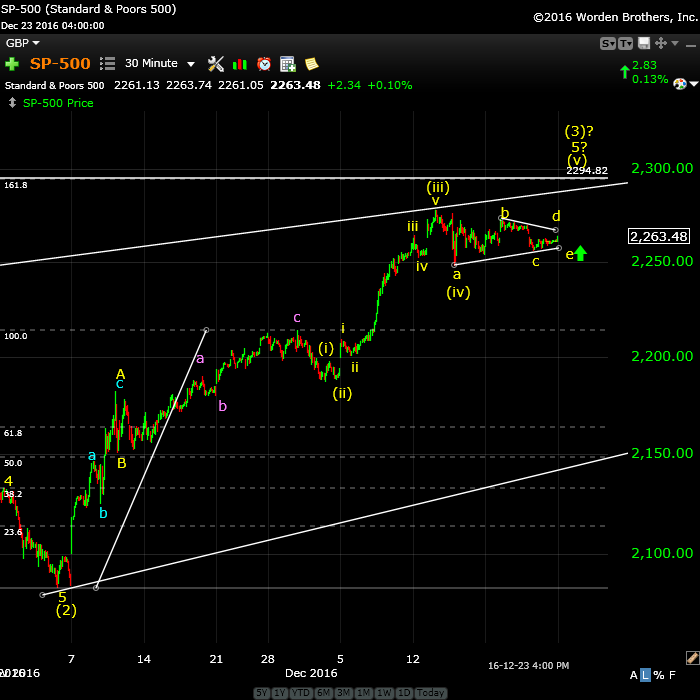
Above is the 30 minute chart of SP500 showing the same ending diagonal we’re seeing in ES futures. My prognosis mirrors ES almost exactly because there’s little difference in the levels between the two (2 points now). I put us in the fourth wave of the C wave of wave 3 of the ending diagonal (same as ES). Look for a turn down into the larger fourth wave (may be a sharp drop) sometime this coming week.
The most likely target for me for the top of wave 3 is about 2294-2296. That’s due to treating the wave up to about 2214 as the A wave and then targeting the 1.618 extension of that wave.
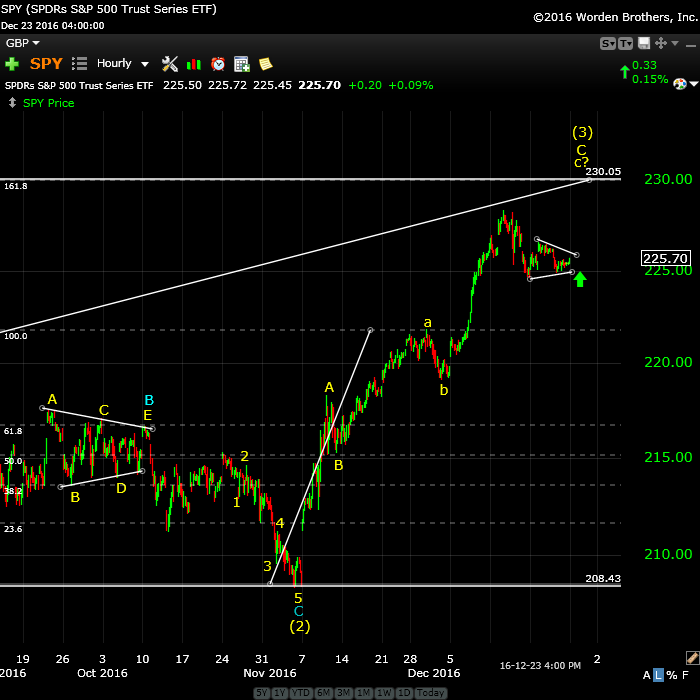
Above is the hourly chart of SPY showing the same ending diagonal configuration as in ES futures, and the NYSE (chart below).
The extension of wave a (as shown) would give a target of ~230.00. There are other possible fibonacci ratios which could give slightly different targets.
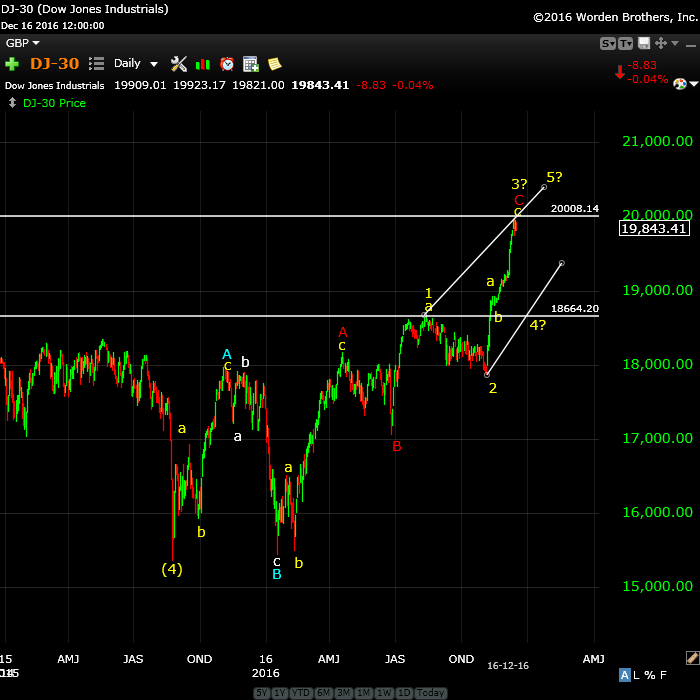
Above is the daily chart of the DOW. Wave three of the ending diagonal has gone straight up for this index.
I’m taking a measurement off the first ‘a’ wave here for the entire wave. I don’t know if this will be the third wave top or the fifth wave top, but I think 20,000 more than likely for one of them (I suspect the latter the better bet), as it’s a nice round number, which is usually a target in these situations.
Wave 4/5 will possibly be quite rapid compared to the rest of the wave so far. A sharp drop here to below about 18664 (the previous 4th wave could still make this ending diagonal work as shown. The diagonal trendlines have to converge. If they don’t then some other pattern is tracing out here.
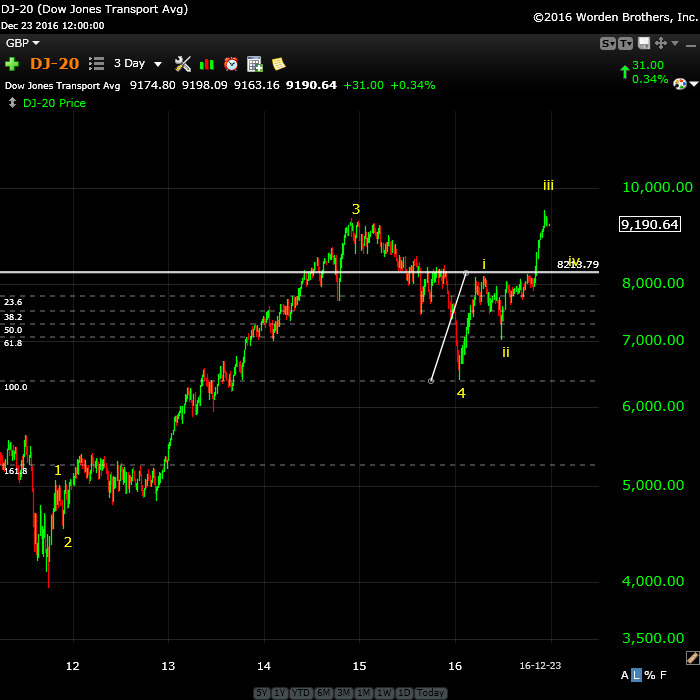
Above is 3 day chart of the DOW Transports (DJ20) showing the impulsive wave structure heading to a final top. In 2007, the transports also traced out a new high. The index is completing an implusive ending wave in 5 waves.
Expect another small leg up to complete wave 3, then a retrace in wave 4, before a final ending wave 5 to a final high.
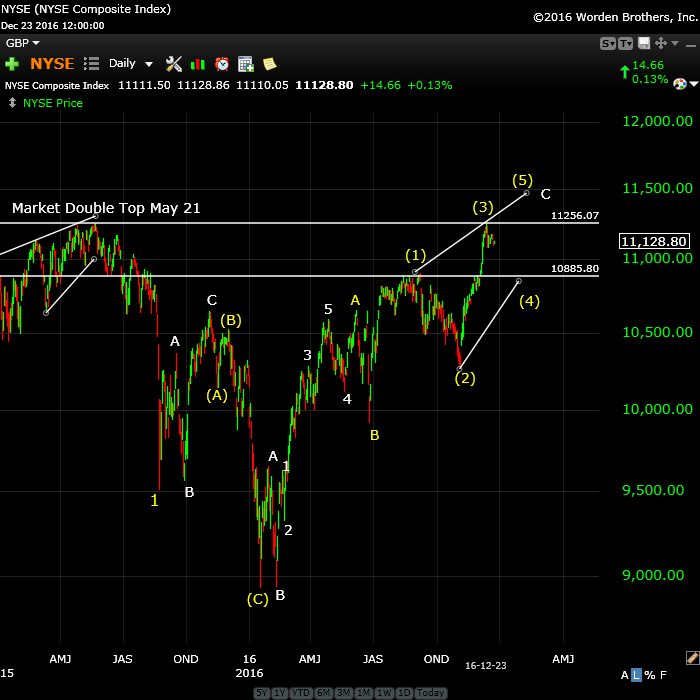
Above is the daily chart of NYSE. As I’ve been saying for some time, because all the other US indices have reached new all time highs, it will be important for this index to also reach that same level before before ending the final wave up. Based up the configuration shown above it appears to be lining up to do exactly that. The previous high is at about 11,253. I’m looking at this level (at least) in this index as being a final target for a top.
On a near term timeline, wave 3 has shot up, which along with the other indices, makes the wave 4/5 combination (still to come) look like it will be relatively short time-wise.
As I’ve said many times before, if one US index reaches a an all time new high, all the remaining US indices must also reach a new high.
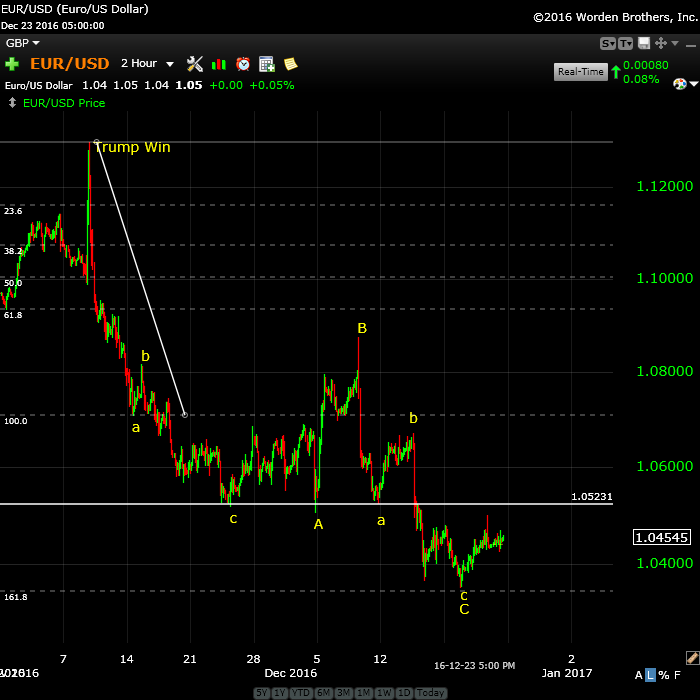
Above is the two hour chart of EURUSD. This wave down has been a difficult one to call the bottom of, due to the fact that the to of the wave came down so quickly that there simply aren’t any waves at high levels from measure from (or even count). However, I think we have bottomed now. I’ve actually re-labelled the chart slightly to create at yellow a wave down from the top that is a fibonacci ratio to the bottom of the wave. Keep tight stops as there is still a possibility of a drop a double bottom here.
As this entire wave down from 1.13 (approx.) is in three waves, I’m expecting a full retracement back to the top. When it reaches the top, it will be a very lucrative short as it will drop like a stone.
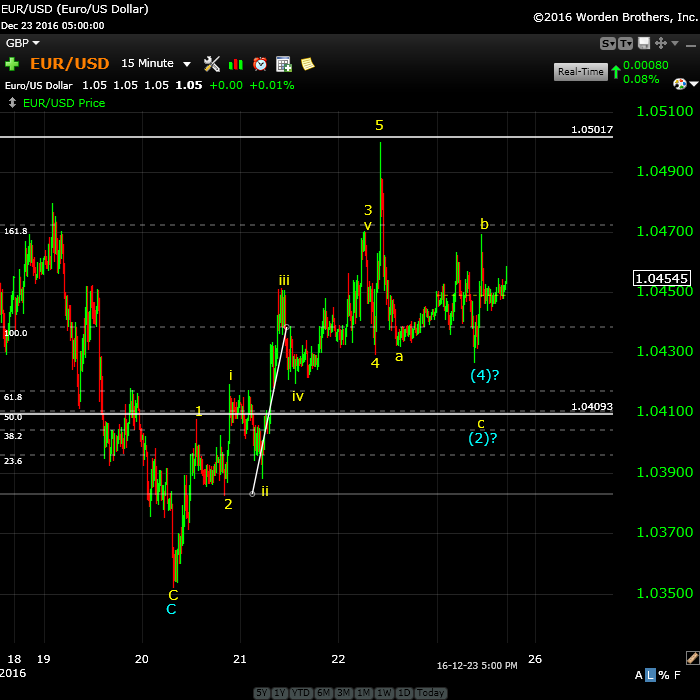
Above is the 15 minute chart of EURUSD. I had expected a double bottom on this wave but we didn’t get one. It’s also out-of-sync with the other USD currency pairs, which has made confirming counts between the four pairs (EUR, GBP, AUD, and CAD), problematic. I urge caution if you’re going to attempt to trade any of these currency pairs.
I can offer two counts on this wave, but the one I’ve posted is what I feel is the most probable. That’s because wave 3 in this count is exactly 1.618 X wave 1 (shown by the fibonacci measurement on the screen). I’m expecting a blue wave (2) retrace to the 62% level, or about 1.041.
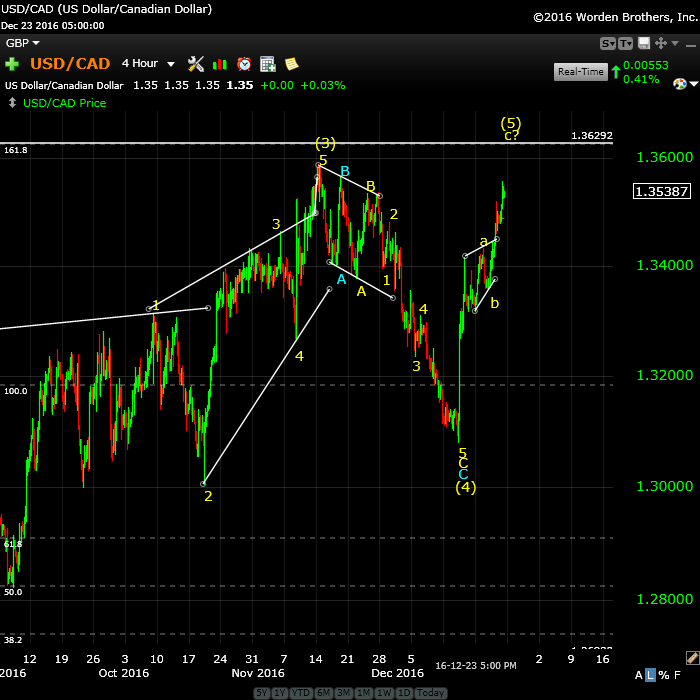
Above is the 4 hour chart of USDCAD. It’s clean now that the current wave will retrace to the top or slightly above (possibly to 1.363) to complete a 5th wave of a corrective pattern, with when done will be a larger B wave and signal a turn down to a very large C wave.
This parallels probable moves in EURUSD (2nd wave), AUDUSD, GBPUSD, and USDCAD.
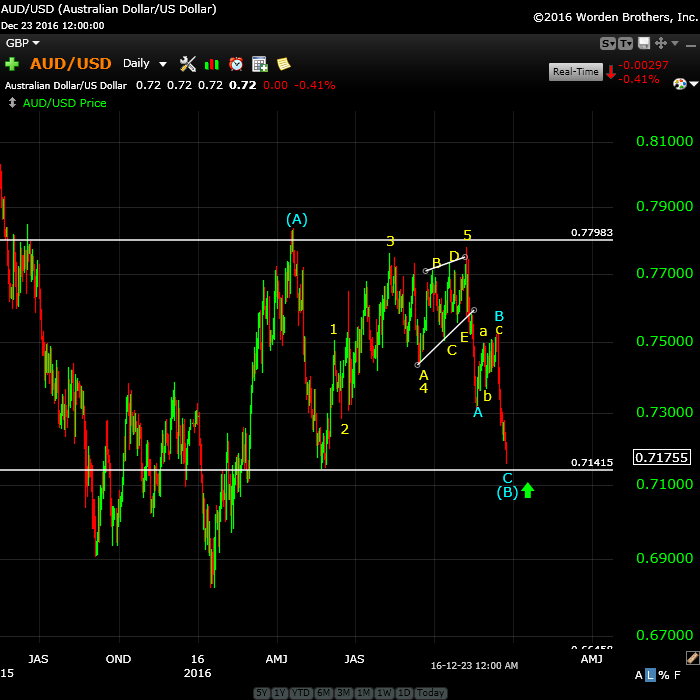
Above is the daily chart of the AUDUSD. We came down to a new low at the end of the week, but I still expect a turn up to the target. We haven’t quite bottomed and a possible turn now is at the low of ~.71415. However, be careful, as I can find fibonacci ratios that suggest we might have a bit further down to go. The safest route is to wait for a turn, then 5 waves up and three waves down 62%. That would be the least risky entry point.
I’ve an eventual target of .8435 for this pair, which is the 38% retracement level of the entire larger wave down (from the year 2011), which would make this wave 4.
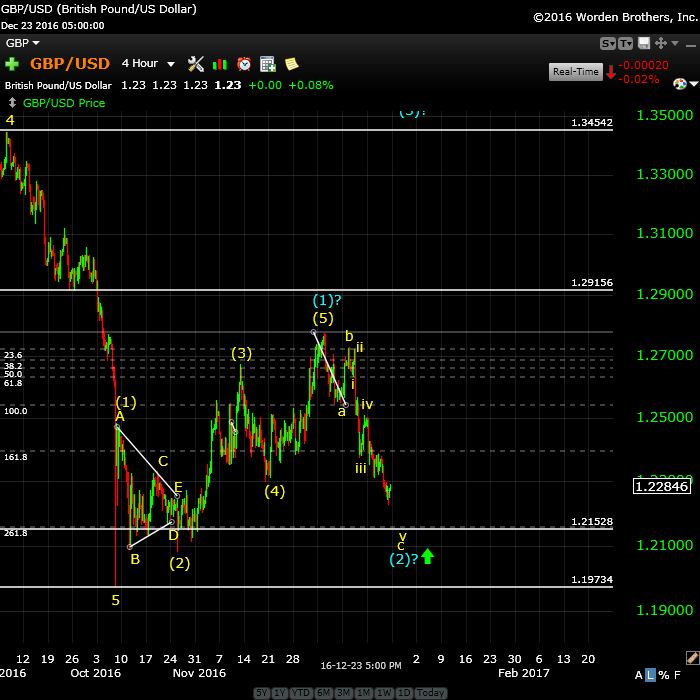
Above is the 4 hour chart of the GPBUSD. Wave 3 just can’t seem to get going. I’m expecting a bit further downside to a double bottom at about 1.215 before a turn up into the third wave. The target for this A wave is still ~1.34542. I would wait to see a strong turn up with 5 waves up and then 3 waves down. All these USD currency pairs are very week, and as I’ve said, surprises will be to the downside and they can be sharp.
It will not be a straight trip to that higher target, so don’t get too aggressive. Once we reach it, I expect to see a large B wave.
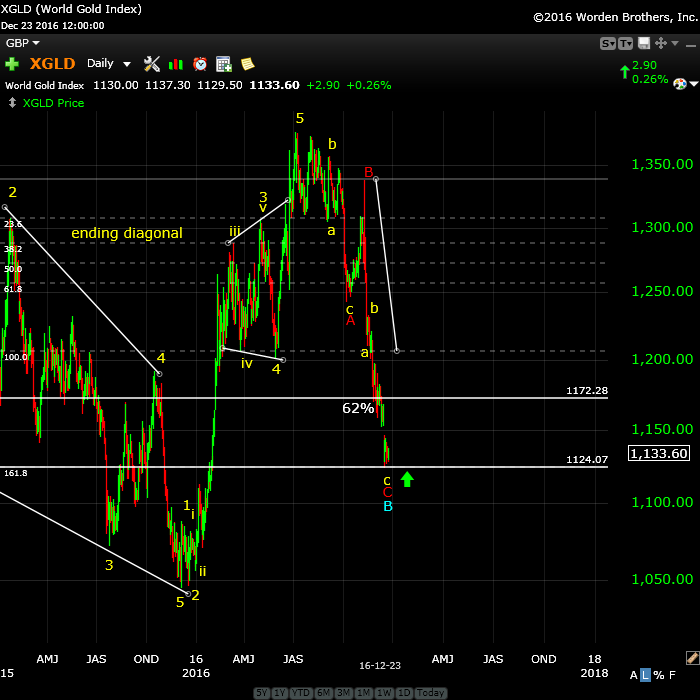
Above is the daily chart of gold. The challenge is trying to find an entry point. I talk about this in the video.We look to be forming a bottom finally. My preference for an entry would be to watch for 5 waves up to about 1198 and then a 62% retrace down from there, with a turn to the upside. That would be the entry point.
The final upside target is around 1585.
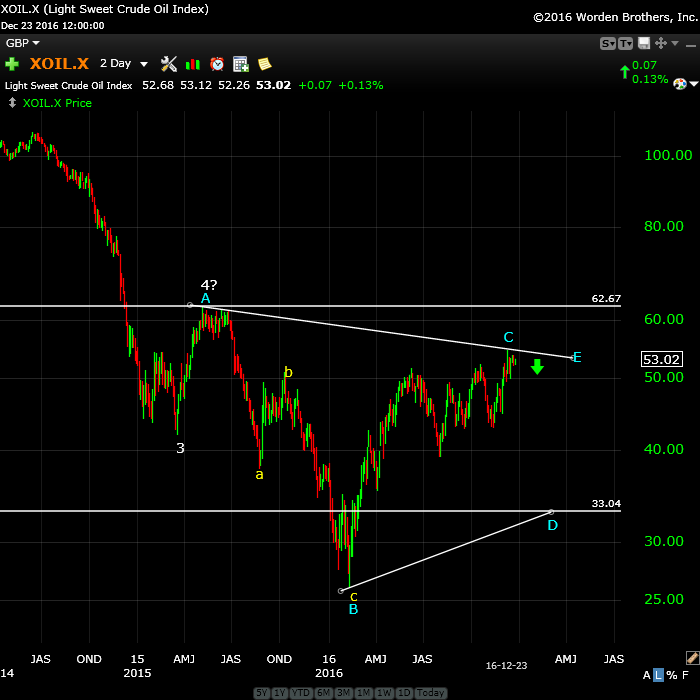
Above is the daily chart of oil. We look to be completing a topping process. I talk about this in today’s video.
The subwaves on Friday are suggesting we’ve seen 5 waves down and have retraced back to somewhere around 62% (about 53.70). My projection has not changed. We should head down in 3 waves to about 33.00. Once we have a larger A wave down in place, I’ll be able to project a more accurate target (or perhaps a more firm target, based on two different measurements).
Finally, we should get an E wave up to the upper trendline to complete the larger pattern. That would be followed by a final 5th wave down to a new all time low.
Good trading!
___________________________
Sign up for: The Chart Show
Thursday, December 29 at 2:00 pm EST (US market time)

The Chart Show is a one hour webinar in which Peter Temple provides the Elliott Wave analysis in real time for the US market, gold, silver, oil, and major USD currency pairs.
Get caught up on the market from an Elliott Wave perspective. You’ll also get Andy Pancholi turn dates for the balance of the current month. There’ll be a Q&A session during and at the end of the webinar and the possibility (depending on time) of taking requests.
All registrants will receive the video playback of the webinar, so even if you miss it, you’ll be sent the full video replay within about an hour of its conclusion. For more information and to sign up, click here.


Thanks for this analysis. I found another analysis (not my own) that I’d like to share.
The all time low in NYSE was 347,77. (1974). We take the natural log to get 5,85154 and add that to 347,77. Now we get 9,328. The anti log gives 11254. 12/13 NYSE gave an intraday high 11256, closed lower and stayed lower. 12/12 the angles were at 180 degrees.
This tells me 12/13 was not just a high. Nasdaq gave a squaring out 11/14 (price angle = time angle). And one lunation further (29 days) we have 12/13.
Nasdaq closed 12/23 at 90 degrees. This is a hard angle. 12/15 also 90 degrees. This is a major warning sign; Nadaq is testing 90 degrees.
Squaring out of time and price is one of the most advanced Gann techniques. As I have all angles, shadow dates and shadow prices on all indices I follow, this analysis as now very simple.
8/19/15 SPX squared out. 8/24 we saw a major low. So a few days off won’t change the outcome.
I keep seeing new things. This analysis confirms what Peter said; this is a dangerous market.
Tomorrow some more details
A well known Gann technique is to use the square root of price and add that to the turndate to get a new date. The real price and the shadow date give an equilibrium point. Using the technique we see a monthly peak 12/13.
The 3rd highest reading of the month comes 12/29.
The other equilibrium point is about the real date and the shadow price. Doing the same analysis as above, the monthly peak comes 12/29.
This is the power of equilibrium timing. Only in this theater 😉
Gosh last week turned into a flurry of activity for me!!
I’m here really just to wish EVERYONE and specially our very generous and affable Host Peter a Very Merry Christmas…..and whilst I’m at it a Happy, Healthy and Prosperous New Year.
I still have a ton of catching up to do on the comments in the previous post as well as read Peter’s ‘Golden’ Analysis for this week. Thanks very much Peter that is incredibly generous of you. But we knew that already!!
Cheers to ALL.
“I’m here really just to wish EVERYONE and specially our very generous and affable Host Peter a Very Merry Christmas…..and whilst I’m at it a Happy, Healthy and Prosperous New Year.”
AMEN.
The best you in the New Year and to all of you!
Thank you, Purvez,
the best to you in the coming year.
Thank you Peter
wishing everyone a merry Christmas
Joe, you asked Andre’ about his “April turn date”…my recollection is that it was actually a March 27th “turn date!” Hopefully, Andre’ will clear that up!
Venus’ velocity will be at an extreme 3/25/17. So something is likely to happen then.
Seems likely, Andre’ to have sell off mid March. I am expecting rally until then before the sell off.
One file I use is a list with the most significant turns of the last century; obviously on Dow Jones. And one of the indicators I use is the Delta system.
This shows the following:
12/27 High and low
12/28 high (= 1929 high)
12/29 strong high
12/30 strong low
12/31 very strong high.
This system uses cumulative SME degrees and not days- as some do. The question is if the 1929 high gives more energy (one ring to rule them all?) In that case 12/28 would be a very significant high. The alternative is that it is carried over the weekend to plunge next year.
Tuesday will be consolidating. 28/29 will produce a high as will 12/31, Other systems seems to implicate 28/29 is the strongest. But delta says 31 is the strongest of the month.
A low in March? I now see 5/3/17 as a strong date, but I have to do some more analysis on this
Gann said that if a 3 month timing is confirmed by a 4 month timing we have a change in trend.
Using the Historical DJ table we see 12/27 and 12/31 are the strongest dates this month. In cauda venenum?
Anyway; 12/29 is the midpoint and the market has a habit of testing midpoints.
Combined with the above chances grow the most significant turn will be midweek. This aligns with Andy’s date Peter gave us.
Numerology
8 is the number of infinity. 6,7,8,9 are the numbers of the outer planets. 6X7X8X9=378. 378 times 8 from 8/8/2008 is 11/18/16. That was an Andy date.
Add 5 times 8 and we have 12/28; an Andy date!. 40 days is a biblical number as Jesus fasted for 40 days in the judaean desert after being baptized. Gann said we should study the bible.
Nice thought at Christmas!
little error. 6x7x8x9=3024 or 8 times 324.
Doesn’t change my analysis; 11/18 was a major date. and 40 days later is next week.
Jim welsh on marketviews.tv made an interesting observation. He said that the sentiment for the major averages and for us dollar are both above 90 percent. The sentiment toward t bonds and gold are both 10 percent. To have all four at such extremes is quite unusual. Potential reversals anyone???
According to the 12/26 issue of Barron’s, a “Wells Fargo/Gallup survey shows investors at their most optimistic in nine years. The CBOE Volatility index, or VIX, last week plumbed its lowest depth in 2.5 years.” It also says that “the S&P 500 recently traded at 22.3 times what its companies had earned in the preceding four quarters, higher than 92% of readings since 1929.”
Hi Peter
I am Beginning to think this may be a B wave Triangle ?
if so the march Dow futures will not break above 19890.
I m Long yet a break of 19862 id guess send the
march Dow down towards 19800.
food for thought is all and it kind of fits your initial wave
http://imgur.com/gBQjool
The same triangle at the SPX. 4th wave.
Not a triangle anymore. At least not NQ.
BAD TICK $NYA
Weird
Odd thoughts
something i noticed with apple was that its 5th wave up
was a move more in points than all of its previous moves.
Dow
Oct 1974 570.01
Jan 2000 11,750.28
Oct 2002 7197.49
Oct 2007 14198.10
14198.10 – 570.01 =13628.09 pts
6469.95 + 13628.09 =20098.04 <—
What that means i don't know yet its number
6469.95 *2=12939.9 pts ( 6469.95 + = 19409.95 ) Dow is above.
14198.10-6469.95 =7728.15 pts
7728.15 *2=15456.3 pts
6469.95 +15456.3 =21926.25
next would be the 2000 high minus 1974 low *1.618
also the 1974 low minus the 2007 high *1.618
above 20098.04-21926.25 would give a higher
level of the 25287-28520 range .
Just posting for reference i have no idea if the dow
gets up that high
Mar 2009 6469.95
A case can be made that the NQ completed a 4th was triangle
and the thrust up yesterday was a 5th wave thrust .
if so the NQ would fail and turn down breaking below yesterdays
late day low .
The more bullish case labels yesterdays move and a 1-2 set up
the Russel 2 k ( TF futures ) still can be in a Wave D
1257 on march ES would be support for a wave D ?
MIxed Picture
Out of spec long positions
shutting off computer
books closed for the year
Leaving the market alone for the rest of the week
unless i see 1257 in ES which i doubt yet
another drop cant be ruled out .
Joe
The expanding triangles E wave on all 4 indices looks to be completed..
S&P 2277 – Dow 19987 still holding as ATH.
$35 Billion in pension redemption will flow out of stocks and into bonds Friday I believe..
My position is still the same we have seen the top.
If we continue to weaken into tomorrow and Friday it will continue to build confidence that Dow 20k will not be reached.
jody – i am behind you on your call!! the RUT completed pattern is my basis for my support…..
hey this is from some cycle people – MMA [Merriman Market Analyst]??? i will cut and paste for those of you who have yet to read………..
This is our last column of the year, and what a year it has been for the world and for the nation. We would be happy to review it, but we did much of that that in this year’s Forecast 2017 Book. To Financial Astrologers, it will forever more be known as the Saturn/Neptune waning square year, which correlated with 1) the nastiest USA presidential election in our lifetime, offering two candidates who had higher disapproval ratings than approval ratings, thus making it an election against a candidate more than for a candidate, 2) interest rates bottomed, and 3) crude oil prices bottomed.
In the last week before the holidays, several stock market indices soared to new all-time highs or at least multi-month highs, including the Dow Jones Industrial Average, which came close to 20,000, but stopped a little short at 19,987 on December 20. That is still within the time band for a primary or half-primary cycle crest as outlined in our Special Report sent out last week, related to the Jupiter/Uranus opposition taking place on Monday, December 26.
In fact, this period surrounding Jupiter in opposition to Uranus is important for all markets, including precious metals, crude oil, currencies, and treasuries. It is interesting to note that as the DJIA made a new all-time high last week, the S&P futures did not, for a case of intermarket bearish divergence. Likewise, Silver dropped to 15.67 on the same day, December 20, its lowest level since April 11, but Gold held above its multi-month low of 1124.30 made the week before. This is a case of intermarket bullish divergence. However, given this is a holiday season market, and Mercury is retrograde (December 19-January 8), these signals may not prove to be reliable. We will have to wait and see what it looks like in the first week of January.
SHORT-TERM GEOCOSMICS AND LONGER-TERM THOUGHTS
If the markets don’t move much during the next week or two it won’t be due to a lack of geocosmic signatures. If they do make substantial moves, it will be in accordance with the abundance of 12 geocosmic signatures that are in force, December 19-January 12. This is a time when traders tend to go on vacation, volume is light, and price activity tends to be subdued. However, this is also a time of intense geocosmic activity that – in normal markets – would have a high correspondence to major reversals of trends, as well as unexpected and possibly disruptive conditions in the natural and/or geopolitical world.
We are already witnessing another bout of increased terrorist activity related to these signatures, most notable the Jupiter/Uranus opposition, combined with the change of direction of Uranus in Aries, as it moves from its retrograde to direct motion on December 29, with an orb of influence up to 12 days either side. Uranus in Aries can be dangerous. It can also be very exciting and filled with new ideas, new hopes, and new visions for the future. The ideas may be radical, but they can also be brilliant.
Thus, we enter 2017 with a sense of both excitement and trepidation about “What will happen next?” With a cardinal T-square now in effect late November through January 12, and then again February 22-April 21, we need to get used to the idea that it is impossible to get used to anything. These are signatures suggesting a very unknown quality is afoot. We can have hope, and we can expect changes and surprising events, but we don’t know the form these changes or surprising events will take. The whole world will be in a heightened state of vigilance, watching for something new, as well as something amiss. The vigilance will focus upon liberties and freedoms, key terms related to Uranus. Will they be expanded, or will they be trampled upon? And if the latter, who will have the courage (Aries) to speak up?
One of the wonderful things about my life is that I get to know some very unusual and brilliant thinkers about the world, the world economy, and the world of finances. One of those profound thinkers – Ted Lee Fisher – gave me a call this week, and we had a conversation that helped me to a much clearer idea of what to anticipate in the next 1-3 years, given my knowledge of rhythmic and geocosmic cycles. Ted will be our featured guest at the forthcoming MMA Investment Retreat in San Diego, March 9-13, and for those who attend, this will be a rare treat, as Ted lives in Phuket, Thailand now. You will not see him doing many public presentations or interviews, and to have this legend in commodities trading with us for four days is – for me – an honor.
So, what did Ted and I discuss that cleared my head about the next year? You can get an idea from this web site I found at http://www.gold-eagle.com/article/gold-trump-will-make-gold-great-again, combined with the ideas I discuss in Forecast 2017 (now out). It is a big subject – too big for this column, but let’s just say it has to the do with the Saturn/Pluto balsamic phase (2016-2020) and the “Great Reset,” which I think will fully get under way following the Sun/Saturn ingress (together, conjunct) in Capricorn on December 21, 2017. It will also be on the Fed’s solar return that year (next year, 2017). It is a subject I will discuss January 13, 2017, in Zurich, Switzerland (see Events). I think a great political, governmental, and financial reset is being conceived as we enter the “dark stages” of Saturn/Pluto cycle, just before the birth of a New Era in 2020 +/- 1 year. It is a great time to be alive, especially if you understand the cosmic play.
Terrific insight into that call for a “top”!!! I am still with you on that!
the top in the Dow on dec 13th on an hourly chart to the top of yesterdays high
is equal to the low of the Dow 14th to today’s low .
If this is still a triangle of sorts then today’s lows would be labeled wave C
which implies yesterdays move a B wave .
Took My morning Nap and glad i questioned the market and exited.
Todays low on the ES was 2.2 times the 1-2 or AB move from
yesterdays high to the late day low to this mornings high.
its not a fib number yet i have seen that work to many times
not to mention it.
where we go from here ? If its still a triangle then waves D and E
which leaves the triangle in the TF futures up for debate.
Joe
sitting out the rest of the week.
Looks like C wave and i don’t see any minor wave 4 within
this last leg from yesterdays high . TF futures made a new low
with negated the triangle i was watching .
The Pension re-balancing is a re-balance of its entire portfolio
and that would imply selling of portfolio which has gone outside
its % balance and buying where sectors are below its % balance .
Its not all out of stocks and into bonds.
Tech has outperformed NYA for example .
19409.95 on the dow should be touched .
its a long term price number so it should
be seen as a pivot .
19260.30 is where i start watching the Dow from
a long term point of view .
Next Week would have to be a low of sorts
yet Jan 20th is still the cycle low .
we had combination of the moon , mercury retrograde which
i give a 10 day lag Dec 29 is tomorrow .
Mars Uranus calls Jan 20th yet the conjunction
is not until march 2nd .
This is typically a very bearish signal and yet
the market has been rising .
early March under what has been going on would
be a high not a low .
combining mercury retrograde now into its
panic portion of the cycle .
The market will decide
The Odds Favor a steeper than normal decline !
And im the bullish one in the room
🙂
Old Notes
6469.95 + 13628.09 =20098.04 <—
What that means i don't know yet its number
6469.95 *2=12939.9 pts ( 6469.95 + = 19409.95 ) Dow is above
Dow is up 8.15% since Election Day, on pace for best performance from Election Day to year end since Herbert Hoover was elected 1928
2017 is year of Rooster. Of the 12 years, Rooster years are the second best performer last hundred years, second only to Pig which is 2019. Previous Rooster years were 2005, 1993, 1981, 1969, 1957, 1945, 1933, 1921. Overall these were very bullish years. Year cycle is based upon Jupiter’s position around the sun.
Week 8 up in a row for the DOW? History suggest no
4 of last 5 years have lower closes in final week
also
6 of last 10 have closed lower
I think a sharp decline is around the corner, euro /dollar will reverse sharply and that will be trigger.
It will happen now till Jan 4/5 or after ..
Goodluck to all.
5 waves down within wave C as i see it .
Thursdays lows now key support .
Looking for the market to turn back to the upside.
No trading until next week ( will be hard for me )
My year is over on spec trades .
Stocks as of today overall plus 25.31 % ( includes good and bad )
specs very very slight down on year .
Next week is an important week as i see it .
if wave C down is now complete then no where to go
but higher .
i want proof before putting spec money at risk
Joe
25% is VERY GOOD in such a tough market. I wish you the best in the New Year, Joe.
I group 5 stocks per sector
when a stock pays for itself or close
i sell 1/3 and look to put that in another sector.
at some point each sector is paid for
then sit back and look for new developments.
i use vector vest to evaluate stocks before i buy .
i use fundamentals to pick stocks yet use cycles
to purchase or sell .
very short term ,
not explanation yet its cycles 🙂
http://imgur.com/G1eopnQ
Jan 8 mercury turns direct. Other indicators point the same direction.
Possibly one more week of consolidation, but after that it should be over.
Wishing everone the best for 2017.
All the best for 2017 everyone!!!
Cheers,
W
Ah! The fix is in … more debt! That’ll do it. Just what we need.
http://www.zerohedge.com/news/2016-12-30/italys-insolvent-monte-paschi-issue-€15-billion-debt
Not going to be surprised if /ES hits 12/8 pre-mkt low 2232.5 today.
Watching for a break of S&P 2237, if that happens 2208 would be the next possible support.
35 Billion in stocks up for sale today.. YAY!
Happy New Year Everyone!
The US markets gave a high on the significant 13/12 date. But the shadowdate on the Stoxx600 12/13 high is 1/7/17,
So Europe is aiming for the equilibrium date.
Us wants down, Europa wants up so the market is flat. Next week last leg and then I expect some more volatility,
Make that 12/13
Andre’,
Just trying to understand what you are saying…
Top or High was made on 12/13/2016…
You have pushed your expected “low” out in April 2017…
That April low could perhaps just be an interim low in what could be an ongoing Bear Market!
Thank You for your insight!
( Markets discipline those who refuse to discipline themselves)
I have three batches of shorts. 3 X shorts EtFs. I will be selling one batch very shortly. I hope to buy back early in the new year before we get that surprised drop, to the Possibility of a 1875 – 1900 sp The sp as of now is at the 2233 level Good luck to all.
Sold 1/3 batch for a nice bottle of Merlot. ES 2230 Will re buy hopefully early next week. Good luck to all.
Congratulations Dave,
Something is brewing:
https://astrologyforganntraders.wordpress.com/2016/12/31/planetary-energy-january-2017/
Stay with the gut feeling and keep on posting.
Happy New Year to all.
Thanks for all the interesting posts..
And Peter Thanks for this beautifull site..
My best guess,the market will bottom today or Monday,we wil see a little push upwards.
The end days of Mercury retograde will be the trouble maker.
Wednesday or Thursday we will fall down hard till Friday 13 (near full moon).
Watch euro/dollar and dollarindex!!!
Good luck everybody.
Why 12/29 was such a significant date.
12/29 was 90 metonic years (=90 degrees) from the 1929 high. That is, if you use cumulative degrees in the sun-moon elongation. This can not be done in time. I agree that 4 lunations is 118 days. but on longer periods the error runs into many days.
Also we saw that the rate of change in HC Jupiter lattitude was 0 (zero). BR15 uses this technique on Venus but I use it on every planet. Jupiter gave 12/29.
Both cycle are independent and very long term. So a few days either side is allowed. But this is very significant.
Metonic timing is very important. Carolans spiral calendar uses the same principle. But Carolan makes the mistake to count in days.
I now created a spiral calendar that uses 360 sme degrees instead of 29.53-something days.
This difference between time and degrees is remarkable. 12/28 (a high) was a spiral date on 8/15 (in my system). The significant 12-13 date was a spiral date on the may 15 high. The 2/11 low was an august 24 2015 date. 1/8 is a date on the 1/20 low.
For January I see 2 peaks : 1/8 and 1/28. A lower extreme is 1/20.
Tomorrow some more details. Have a nice and safe yearly transition.
The crash angle is calculated using the birthdate and the turn date. For this too we have an option to use SME degrees,
I created a crashangle on the 1792-1929 period; using sme degrees.
12/28/16 was a date (22,5 degrees). This gave the high in SPX. Next date 10/2.
make that 2/10
The asteroid SAPPHO is the astrological ruler of
EXTREME NEUROTIC BEHAVIOR,
Including intense FEAR.
Because fear creates bear markets in stocks,
Sappho is the strongest astrological cause of stock market crashes.
http://www.magiastrology.com/WhyStockMarketsChangeDirection/sappho_financial_catalyst.php
I am not a astrol expert, perhaps some of you who are can further elaborate on the above.
I thought id post something for those who
may or may not be interested in furthering the use
of Elliott wave theory and managing their spending
habits.
In 2004 i switched jobs and took a pay cut in order to
make the change , while my income is back up now
to previous levels at the time it forced me to change my habits.
in 2009 i began a huge remodel project on a house i purchased
where part of the structure appraised at zero . ( 0 )
so i decided to use a pay as i go approach to this remodel
and i used my credit cards for payment purposes .
i have always paid the balances back to 0 at some point each
year . What i have noticed is Elliott wave formations in my own
spending habits . I realize tracking your spending is a bit of a pain
yet i think its worth the effort .
the charts attached are only credit card uses , its based on
amounts monthly spent.
The reason for this post ?
If we are entering a top of importance then getting your personal
spending habits in order will be crucial going forward.
Credit cards are easier to track then cash ( the good or bad of this you decide)
Food for thought is all .
The point of this for me is about keeping track of my habits
and as best i can manipulate the wave count in the way id like
it to become. we can let our debts run out of control or we
can monitor them and keep control over it .
Using Elliott wave theory is extremely helpful to help you
understand your spending habits.
Joe
http://imgur.com/bE5412X
http://imgur.com/HipNhX5
Andre
Good work 🙂
I see the jan 20th date is showing up in your work .
I also realize you have had your april date for a low
for a long time .
Does may 19th fit into your work as a low ? ( higher low ?)
Joe
Joe,
Strong indication for a low by the end of april. I already gave 5/3 and now the spiral system gives a low 4/30. This may be the end of the first leg before a retrace into the fall of 2017.
Will give some details when I finish my analysis.
Joe,
5/19 is a spiral date on the may 2015 high. So the date is strong. But I think it will be a high.
Spiral dates were 8/13, 12/13, 5/19; all highs.The midpoint; 3/1 should be a low.
This spiral system is new so I need some more time to analyze it. But I have seen some stunning things. combining this with shadow date time should create a new timing system.
Bayer rule 32 gives a high 1/2. We see another high 1/11 and one end of month. So we need lows in between. Think 1/8 will be the strongest date.
The most significant events this week are the earth at aphelion 1/4 and the lunar first quarter (1/5). This wil be an intermediate high. So 1/2 high 1/3-4 low, 5/6 high, 8 low, 11 high, 20 low and 1/29 high before 2/8-9 low.
Thanks Andre,
I have a good feeling for this one..
Nice work Andre. As mentioned before, I have my eye on some kind of a bottom for Jan 20th. Jan 8th as a high than down significantly into the 20th
Europe is still climbing the stairs,I have my bearcards ready for Jan 5 till Jan 16.
Since 1885 the Dow Jones Industrial Average (DJIA) has been up 63% of the time in January with an average
gain of 0.8%. During the 1st year of the Presidential Cycle the DJIA has been up 66% of the time in January
with an average gain of 0.7%. The best January ever for the DJIA, 1976 (+14.4%), the worst 2009 (-8.8%).
Over $2,000,000,000,000 in proceeds of corruption moved from China to US, Canada, AUS, Netherlands. My Q&A. #vanRE http://www.antimoneylaunderinglaw.com/2017/01/qa-on-the-2-trillion-in-proceeds-of-corruption-removed-from-china-and-taken-to-us-australia-canada-and-netherlands.html …
Everybody,
There is an amazing ‘daily’ market blog you must read. It is insightful, and witty, and filled with charts, and above all – is written by a Canadian!! [Peter, i think a Canadian’s perspective is the best kind of different! thinking that there is!}
so read him daily – http://ponziworld.blogspot.ca/
you[s] can all thank me later by filling an Olympic sized pool with homemade “BUTTER TARTS” and then forcibly throwing me into said pool to drown!!!! ………… this “IS” the very best way to die. For the record, i am unable to swim!!! …but i can eat butter tarts though!!!! yummy…….[slurrrrp]!!!!
I always appreciate in reading different points of views. The Author above is some what a Doom and Gloomer for all of 2016. Yes, eventually he will be correct, just as a broken down clock is correct twice a day. How many investors got wiped out trying to top pick by shorting the market in 2016 ? I remember in 2008 – 2009 close to the bottom of the markets where many investors were shorting the markets as the markets went significantly higher from the bottom. Again many investors got wiped out. This is why we need people like Joe and valley with their Balanced points of views. Joe has done tremendously well being long the markets in the last two years with his unique perspective on the markets. I my self have made more money by being long than short. I have two main accounts. One for long term, 6 months or longer and a short term account. I usually buy in three batches for my short term account. I will sell out one batch at a time when I am in a positive position regardless what my view is on the market. ( Trading Discipline # 101 ) Yes at his time, I do see a possibility of the Sp coming down to the 1875 – 1900 But I also have escape route if I am wrong. In other words, I will divest my short if I do see the Dow plow thru the 20039 level. Take my SMALL LOSS and step a way from the computer and go for a walk in the forest to clear my head. What works for me, does not necessarily work for every one. Some of the very good traders, have only a 40% winning trades. They cut their losses very quickly and let their winning trades run. Their have been some very good gems of knowledge that have been brought forth on this blog. ( Joe, Valley, Peter ect ) Remember the definition of insanity ? Doing the same thing over and over again, and expecting a different result.
I encourage all the new traders to implement new trading strategies for the new year. All the best every one. May it be the best trading year ever !!
One other note. Before I buy ( long or short ) I look at the put/call ratio. I than look at other blog comments to see if their bearish or bullish. I always do the opposite of what the majority are doing. Just like real estate. When every one is buying, I sell. When no on wants to buy, I step up. I do the opposite.
Thanks Dave. that is a lot of free advice,
I also follow Mahendra :
Longterm he made great predictions and since the elections he turned bearish because the horoscope of Trump is very bad for the comming 5 years.
He predicted the big surge till the end of this year but a big fall will come in the markets and we will face a longer term bearmarket.
SP500 can come down to 1.500 or lower.
Thanks John, that was not meant to be advice. Only suggestions to entertain, in how one trades. As for Mahendra, his 1500 sp is hard to swallow at this point. I will wait to see if the 1875 – 1900 sp level is breached first. I would not be surprised to see it come down hard in the very near future ( Jan Feb ) If not, perhaps Joe and Andre March April time frame. We are indeed, in for a very interesting time frame for the markets. As well socially, politically, environmentally ect for 2017 It will be a year of extremes in all areas of the world. Exciting times are upon us.
The Author above is some what a Doom and Gloomer for all of 2016.
Just to be clear, The Author above, meant for Ponzi world blog. NOT Luri.
Andre dates.
The most significant events this week are the earth at aphelion 1/4 and the lunar first quarter (1/5). This wil be an intermediate high. So 1/2 high 1/3-4 low, 5/6 high, 8 low, 11 high, 20 low and 1/29 high before 2/8-9 low.
Andre
thanks for that note that i re posted above this comment.
My issue was overlooking my own indicators which is my mistake.
i have posted for a long time i had a Jan 20th low due date which fits
yours . i have recently put a few other charts together which happen
to fit your dates above .
my guess is that the Jan 20th-feb 11th time frame may be a repeat of
what happened in Jan Feb 2016.
the 19410 area on the cash Dow is where i start looking at the market more
for a cyclical low . then for me its a July August peak , then an Oct low .
This should be an interesting year
Joe
PALS until Friday:
Phase: bearish
Distance: bullish
Declination: bullish
Seasonals: bullish
Summary: looking for rapid ascent this week, that continues into second week of January. Shorting opportunity later in month post Full Moon when other PALS factors flip negative.
A new post is live at https://worldcyclesinstitute.com/the-disruption-has-just-begun/
This website is for educational purposes relating to Elliott Wave, natural cycles, and the Quantum Revolution (Great Awakening). I welcome questions or comments about any of these subjects. Due to a heavy schedule, I may not have the time to answer questions that relate to my area of expertise.
I reserve the right to remove any comment that is deemed negative, is unhelpful, or off-topic. Such comments may be removed.
Want to comment? You need to be logged in to comment. You can register here.