
 Corrective Waves
I’m often amazed at the skepticism that sometimes arises as to my calls regarding corrective abc waves vs motive (impulsive) waves. And then, upon reflection, I realize that, in terms of Elliott Wave, it was probably the most difficult aspect of EW analysis to feel totally comfortable with.
It probably took me a couple of years to ascertain that every corrective wave completely retraces (except for specific exceptions I cite below).
There are three parts to becoming a believer:
- being able to confidently identify a three wave corrective wave (as opposed to a simple five-waver) and
- believing that they ALWAYS completely retrace
- understanding what the exceptions are, as well as being able to identify them in real time.
Unfortunately, the only way to become an expert on identifying three wave moves is to spend the time in the market, doing post-analysis on anything that you identify improperly as corrective.
It takes time, but it’s the most valuable skill you can develop as an Elliott Wave trader. All the rest is “advanced” — the patterns, fibonacci lengths, etc. You can be profitable just being able to identify motive vs. corrective waves.
There are two types of 5 wavers — impulsive (motive) and “simple.” Simple five-wavers don’t need to have 5 waves with each of the impulsive sub-waves (ie — waves, 1, 3, and 5). Since we’re looking for a C wave down (as part of an expanding flat), the waves will have to start as impulsive-looking waves. Anything else will most likely be corrective and retrace back up to the top.
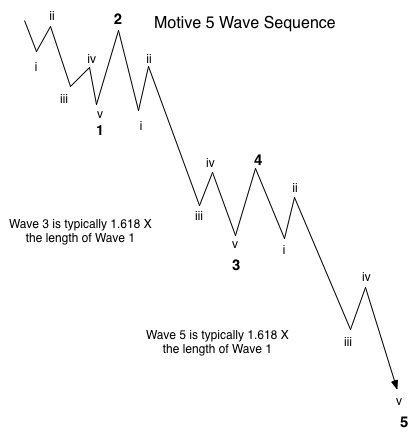
The diagram above shows an impulsive, bearish wave to the downside. This is the kind of wave we’re looking for to wake us up that a top is probably in place. The final confirmation is a 62% retrace (in three waves—an abc correction), which becomes the second wave. The second wave must retrace at least 62% and typically does not rise above the 76% level.
There’s an alternative first wave pattern that’s similar to the pattern above—it’s a variation in that the first wave extends and becomes as long itself as the first three waves down. You can find that pattern here.
If the wave down doesn’t match either one of these patterns, the probability is high that it’s corrective and will fully retrace. Corrective waves always completely retrace unless they’re within a pattern, such as a triangle, flat, zigzag, or diagonal.
You can trust that to happen at any degree of trend, in any asset class or exchange anywhere in the world, since the market was first accurately tracked.
Know the Past. See the Future.
____________________________
Elliott Wave Basics
Here is a page dedicated to a relatively basic description of the Elliott Wave Principle. You’ll also find a link to the book by Bob Prechter and A. J. Frost.
______________________________
Get an upper hand … JC 2
Get an upper hand in trading …Seeing all the different currency pairs and the wave structures and hearing you explain why this has to do that on a nightly bases gives one a upper hand when trading. Elliott Wave applies to all stock and indices and can be applied to any candlestick chart. If someone ask what you want for Christmas – Tell them a membership to Peter’s “Traders Gold!”—JC |
The best of them JL 2
The best of them …Last couple of years, I subscribed to several ‘market traders’. You are by far the best of them and the personal contact is awesome. Daily and daily updates are very well written! Besides your expertise in EW, I also like your cycles analysis. Best investment I ever made! —JL |
Have not had a losing week RW 2
Have not had a losing week …I have been with Peter almost a year. The only thing that matters is have I made money with his service. I think I have finally turned the corner using Peter’s EW. I have not had a losing week in the last 5 months. Thanks Peter, for your amazing amount of hard work. —RW |
Tops in your field DZ 2
Tops in your field …You are tops in your field. Tried to follow Elliot Wave international for years. They were always behind the market. After discovering you, I perceive that you are an expert in reading the waves, which puts you way ahead of the rest of your peers. And you can read the Waves like you are reading tomorrow’s financial section. I pray you stay healthy. —DZ |
Couldn’t be happier … KK 2
Couldn’t be happier …The analysis and insight you provide is simply amazing! I’ve been trading the futures and equity markets for well over thirty years and usually average around 5% monthly. Since joining your Traders Gold Service two months ago, that number has better than doubled. I couldn’t be happier.—KK |
Rise above the rest … SM 2
Rise above the rest …I have only ever met a few people who, in their chosen fields (astrology, medicine, music, martial arts, technical analysis), rise above all the rest and you are one of them…you have ‘the gift’…and that’s why I’m a Trader’s Gold member. —SM |
the real deal SM 2
The real deal …‘Educational, insightful and thorough market analysis for all levels of traders. It’s Elliott Wave at its best….Peter Temple is the real deal’ —SM |
A true expert in Elliott Wave FL 2
A true expert in Elliott Wave …You are a true expert in EW analysis. What you provide is not available anywhere and is priceless. Subscription on your services is the best thing I have ever done. Many thanks for your effort to make me a better investor. I now have more trust in my investment decisions. I hope you will continue the excellent work! —FL |
US Market Snapshot (based on end-of-week wave structure)
This chart is posted to provide a prediction of future market direction. DO NOT trade based upon the information presented here (certainly NOT from a daily chart).
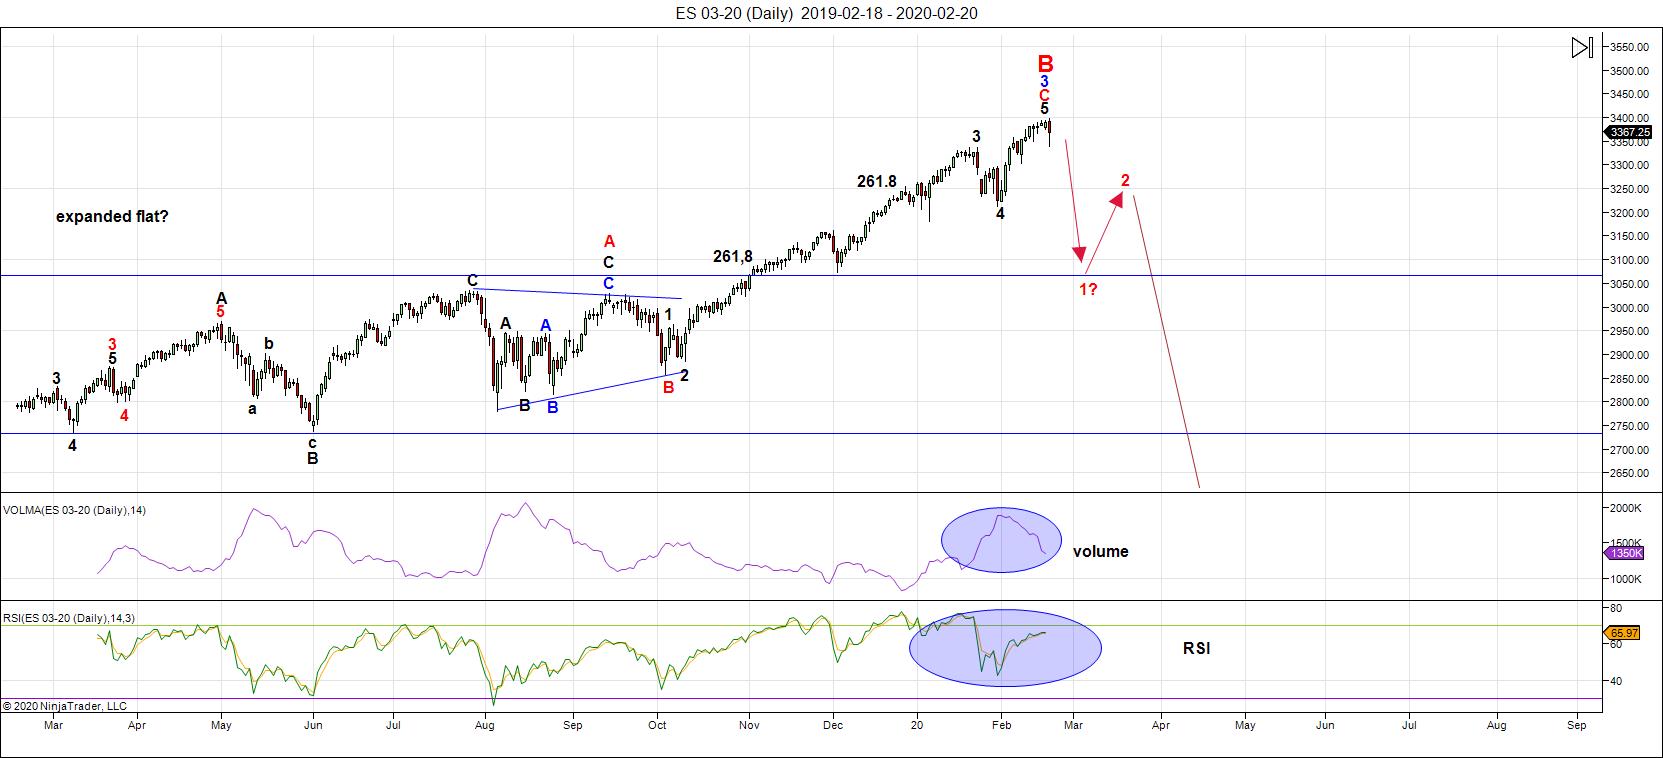
Above is the daily chart of ES (click to enlarge, as with any of my charts).
We've now gone sideways in ES for two and a half weeks. In fact, we're in exactly the same place we were on February 5, 2020.
Since the Elliott Wave Principle doesn't include a reliable time component, identifying the date of the top is a fool's errand. I can tell you the top price (although it's proprietary information reserved for my Trader's Gold clients), I can't tell what day we'll reach it. I can tell you it's only a few points above the current all-time high.
You can also get the info on the projected top tick by signing up for the Chart Show below (which happens every Wednesday an hour after the US market closes).
I still get unsolicited emails from people who simply cannot understand that concept, and obviously don't read what I write. So be it. I can't change it, so I don't worry about it.
But, as I've been saying on this page for many months, all the US indices must reach new highs before the market turns down. The US Dollar also has to get to its target, along with oil, silver, and gold. Then we'll get the turn.
The message here is that (again, as I've been saying for many months), all asset classes (even international exchanges, like TSE, ASX, DAX, etc.) I cover are going to turn at the same time. They must all end up at their individual pre-identified targets at the same time. It's like herding cats.
But, every week, they all get a little bit closer, as SPX keeps going sideways. It's will all end very soon, but the top will be seen on hourly charts, not dailies, because we're that close.
So, the next high by all the players I've mentioned here will result in a thousand dollar drop in ES, and similar plunges in related US indices (and many international exchanges).
___________________________
Summary: The current B wave up is most probably the B wave of an expanded flat. The A wave ended on Jan. 26, 2018. The B wave rally has all but ended, as other asset classes I cover have turned, or are about to turn after the current sub-wave completes.
We're going to drop from here into a large fourth wave. Look for the ultimate bottom to be somewhere under 2300 in ES.
Once we've completed the fourth wave down, we'll have a long climb to a final slight new high in a fifth wave of this 500 year cycle top.
_________________________________
Trader's Gold Subscribers get a comprehensive view of the market, including hourly (and even smaller timeframes, when appropriate) on a daily basis. They also receive updates through the comments area. I provide only the daily timeframe for the free blog, as a "snapshot" of where the market currently trades and the next move on a weekly basis.
I do a nightly video on the US indices, USD Index (and related currency pairs), gold, silver, and oil) right down to hourly charts (and even 5 minutes, when required).
______________________________________
Sign up for: The Chart Show
Next Date: Wednesday, March 4 at 5:00 pm EST (US market time)

The Chart Show is a one hour webinar in which Peter Temple provides the Elliott Wave analysis in real time for the US market, gold, silver, oil, major USD currency pairs, and more. You won't find a more accurate or comprehensive market prediction anywhere for this price.
Get caught up on the market from an Elliott Wave perspective. There’ll be a Q&A session during and at the end of the webinar and the possibility (depending on time) of taking requests.
For more information and to sign up, click here.
| "I think you are the only Elliot Wave technician on the planet who knows what he's doing.” |
| m.d. (professional trader) |
All registrants will receive the video playback of the webinar, so even if you miss it, you’ll be sent the full video replay within about an hour of its conclusion.


