
 The Calm Before a Storm
While the market was frustrating last week, it seems to have become even more so this week.
ES has now gone sideways for 8 full days in a set of waves that is very difficult to decipher.
Friday was somewhat of a “fake-out” and while we did get a wave down (I had called for weakness), the wave down did not break to a new low at the end of the day. It stopped and appeared to reverse as soon as it hit the previous low.
While we saw this weakness in ES and NQ, it wasn’t necessarily the case in other indices. As a result, my review this weekend suggests that we have not seen the top of the scrawling, sideways B wave. I’ve never seen a market like this before, but it’s obvious it requires an extreme level of caution and a whole lot of patience.
So, we wait.
What I’m looking for now is a test of the B wave high in ES and NQ before we get the long-awaited C wave down. However, if I’m wrong and ES breaks below the triple bottom we have now at 3542, then I’d expect to keep on heading down.
Ultimate Greed (and Evil)
Here’s another exposé video (this is the short promo) which tells the whole story of the supposed pandemic that I flagged as questionable way back in April of this year, because of my work in cycles. It made no sense based on when it happened within the current cycle. It appeared at a cycle high, which no other natural SARS (or other virus has appeared at).
The above 7 minute video is a promo to a one and a half hour video that gives you the background to the “Plandemic,” which was originally “outed” by Judy Mikovits and Robert Kennedy Jr. It’s an eye-opener, if you’re unaware of the background story. The link to the longer-length video is within the promo. It’s free; all you have to do is input your email address to register.
There’s much more to this and it centers around the 2018 executive order by Donald Trump that has, in effect, trapped all these evil-doers. I’ll be covering off more of the background on thetruthsage.com. The next month is going to be dramatic in terms of the developments you’re going to see. I’ll leave it at that, for now.
“May you always live in interesting times.” — Anonymous
___________________________
NYSE – Ending Diagonal
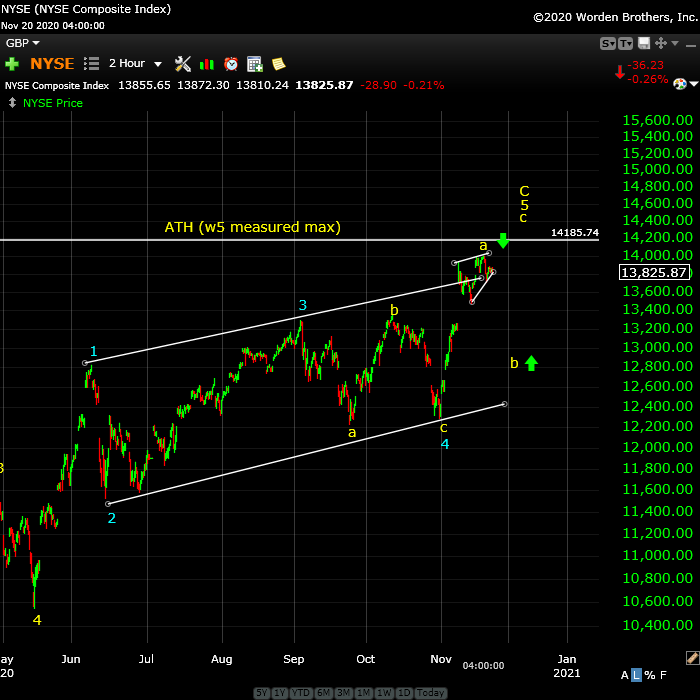
Above is 2 hour chart of NYSE showing us a very large ending diagonal.
The entire wave up from March, 2020 is corrective, telling us it must completely retrace to the bottom. It also means all the waves up in the sub-indices are also corrective.
In the above chart, you’re seeing the top of the wave up from March which has traded out an ending pattern, an ending diagonal. When this pattern in complete, the trend will change to the downside.
As of this weekend, it looks like we might be tracing out a smaller ending diagonal right at the top of the labelled “a” wave, but it’s a little early to be absolutely certain. If so, we have another small wave up to the 14,000 level before a large wave down, a “b” wave.
There are no real rules within ending diagonals, other than the subwaves are zigzags, which are corrective three-wave patterns. Fibonacci measurements don’t necessarily work, so it’s impossible to know how long the waves will be. However, with the fifth wave, you know (in this case) that it needs to at least reach the upper trendline and may do what we call a “throw-over” (reaching even higher). There’s a “cap” on the throw-over since the fifth wave cannot be longer than the third wave.
We’re currently near the top of the “a” wave of the final fifth wave, which has to be in three waves. We’re expecting a “b” wave down (a partial retrace of the wave up) and then a final “c” wave to the final high.
The time factor is the questionable element. Elliott wave does not have a timing component to it. I’m expecting an all time new high which could go as high as the 14,185 level. That final wave will end the rally up from March.
Know the Past. See the Future
_____________________________
Free Webinar Playback: Elliott Wave Basics
 If you’re new to the Elliott Wave Principle, or even fairly comfortable with it, this webinar will give you a solid introduction and comprehensive understanding of the difference between trending and counter-trend waves, the various patterns for both types of wave patterns, and a good overview of how fibonacci ratios determine trade targets.
This is link to the YouTube playback video, allowing you to review, stop and start, etc.
____________________________
Want some truth?
My new site now has several extensive newsletters in place. Videos now explain the banking system and deflation, and I’ve provided lists of what to do and what the start collecting in preparation for the eventual downturn, which will last for decades. The focus of my new site is now to retain your wealth, plan for deflationary times, and stay healthy in the process. I’m also debunk a lot of the propaganda out there. It’s important to know what’s REALLY happening in the world today. This has all been predicted and we know how it’s going to play out. Getting to the real truth, based on history, is what I do, inside the market and out.
To sign up, visit my new site here.
All the Same Market.
I’ve been mentioning for months now that the entire market is moving as one entity, the “all the same market” scenario, a phrase that Robert Prechter coined many years ago, when he projected the upcoming crash.
We’re in the midst of deleveraging the enormous debt around the world. Central banks are losing the control they had and we’re slowly sinking into deflation world-wide, with Europe in the lead.
The US dollar is fully in charge of both the equities and currencies markets. They’re all moving in tandem, as I’ve been saying since September of 2017. Over the past three years, their movements have been moving closer and closer together and one, and now they’re in lock-step, with the major turns happening at about the same time.
it’s challenging because often times currency pairs are waiting for equities to turn, and other times, it’s the opposite. The other frustrating thing is that in between the major turns, there are no major trades; they’re all, for the most part day-trades. That’s certainly the case in corrections, where you very often have several possible targets for the end of the correction.
We’re now close to a turn in the US indices, currency pairs, oil, and even gold. Elliott wave does not have a reliable timing aspect, but it looks like we should see a top very soon.
_________________________________
Couldn’t be happier … KK 2
Couldn’t be happier …The analysis and insight you provide is simply amazing! I’ve been trading the futures and equity markets for well over thirty years and usually average around 5% monthly. Since joining your Traders Gold Service two months ago, that number has better than doubled. I couldn’t be happier.—KK |
the real deal SM 2
The real deal …‘Educational, insightful and thorough market analysis for all levels of traders. It’s Elliott Wave at its best….Peter Temple is the real deal’ —SM |
The best of them JL 2
The best of them …Last couple of years, I subscribed to several ‘market traders’. You are by far the best of them and the personal contact is awesome. Daily and daily updates are very well written! Besides your expertise in EW, I also like your cycles analysis. Best investment I ever made! —JL |
Have not had a losing week RW 2
Have not had a losing week …I have been with Peter almost a year. The only thing that matters is have I made money with his service. I think I have finally turned the corner using Peter’s EW. I have not had a losing week in the last 5 months. Thanks Peter, for your amazing amount of hard work. —RW |
A true expert in Elliott Wave FL 2
A true expert in Elliott Wave …You are a true expert in EW analysis. What you provide is not available anywhere and is priceless. Subscription on your services is the best thing I have ever done. Many thanks for your effort to make me a better investor. I now have more trust in my investment decisions. I hope you will continue the excellent work! —FL |
Rise above the rest … SM 2
Rise above the rest …I have only ever met a few people who, in their chosen fields (astrology, medicine, music, martial arts, technical analysis), rise above all the rest and you are one of them…you have ‘the gift’…and that’s why I’m a Trader’s Gold member. —SM |
Get an upper hand … JC 2
Get an upper hand in trading …Seeing all the different currency pairs and the wave structures and hearing you explain why this has to do that on a nightly bases gives one a upper hand when trading. Elliott Wave applies to all stock and indices and can be applied to any candlestick chart. If someone ask what you want for Christmas – Tell them a membership to Peter’s “Traders Gold!”—JC |
Tops in your field DZ 2
Tops in your field …You are tops in your field. Tried to follow Elliot Wave international for years. They were always behind the market. After discovering you, I perceive that you are an expert in reading the waves, which puts you way ahead of the rest of your peers. And you can read the Waves like you are reading tomorrow’s financial section. I pray you stay healthy. —DZ |
US Market Snapshot (based on end-of-week wave structure)
This chart is posted to provide a prediction of future market direction. DO NOT trade based upon the information presented here (certainly NOT from a daily chart).
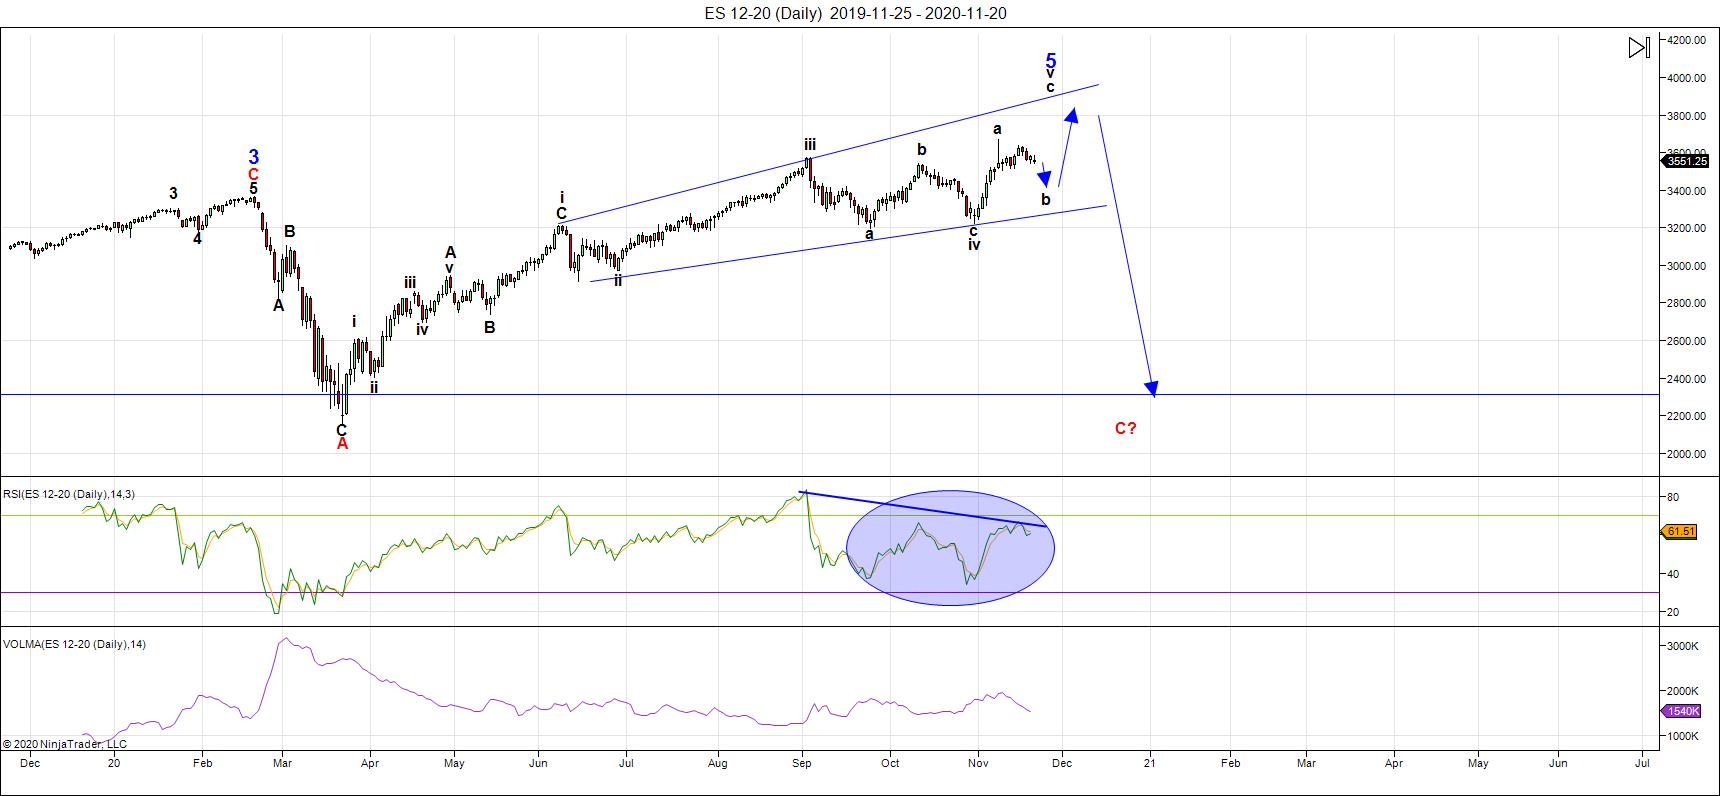
Above is the daily chart of ES (click to enlarge, as with any of my charts).
ES, the SP500, and the DOW are all tracing out ending expanding diagonals. You can see regular ending diagonal patterns in NYSE, and the Russell 2000. NQ is in a final contracting triangle.
This weekend, we appear to be moving sideways (it's been 8 days of sideways) in a B wave, waiting for the start of a large C wave to the downside, which will complete what would become a larger B wave of an ABC wave to a final high.
Without question, it's the most difficult market I've ever seen because all the waves inside these patterns are corrective — in other words, corrective waves, both up and down. It's a quagmire. To top things off, virtually every index and exchange is in a similar type of ending pattern.
While the indices are difficult to decipher, DXY (the US Dollar Index, which everything is moving in alignment with, has been going sideways for five months.
While events don't change patterns, they can dictate turns and it seems that we're at the mercy of the ups and downs of the US election to determine the timing of the next turn.
___________________________
Summary: It's an incredibly difficult, exhausted market getting close to a top, which I now think will happen sometime within the next month (or two). The market may top with the announcement of the winner of the US election but it's difficult to say when that will be.
The SP500 is in an ending expanding diagonal. Other US market indices have similar patterns. Diagonals are ending patterns and warn of an impending, dramatic trend change after they're complete. This puts us in the final stages of this rally up from March of this year.
The resulting trend change will target an area under 2100 in SPX, and will likely be a combination pattern and, as such, may contain zigzags, flats, and possibly a triangle or ending diagonal at the bottom. However, I'm leaning towards a series of zigzags, which are corrective waves, and will likely come down fast.
Once we've completed the fourth wave down, we'll have a long climb to a final slight new high in a fifth wave of this 500 year cycle top.
______________________________________


