
Update Friday, Jan 22, 2016
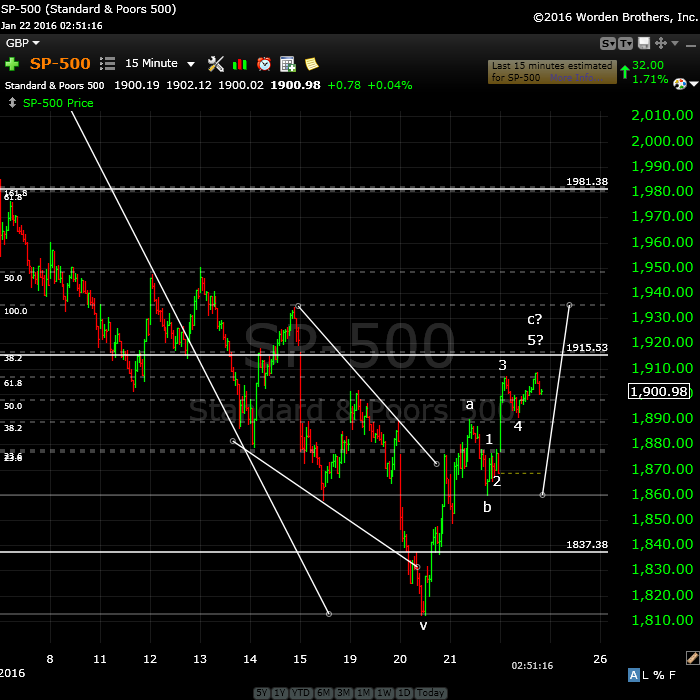
Above is the 15 minute chart of the SP500 as at about 3pm EST. You can see the abc corrective wave taking shape. We could see 1915 as the target as I see wave c up in possibly 5 waves. The ES chart is less clear, but we need to be watchful for a turnover at the top of the next wave if it stops at about 1915.
I will post the ES chart at the end of the day and update this one.
Nothing will happen today, but it’s a head’s up for Monday. I’m not big on the timing as I show the cycle turn for later next week and, of course we have Yellen on Wednesday and we typically head up into the announcement. This wave could easily extend up.
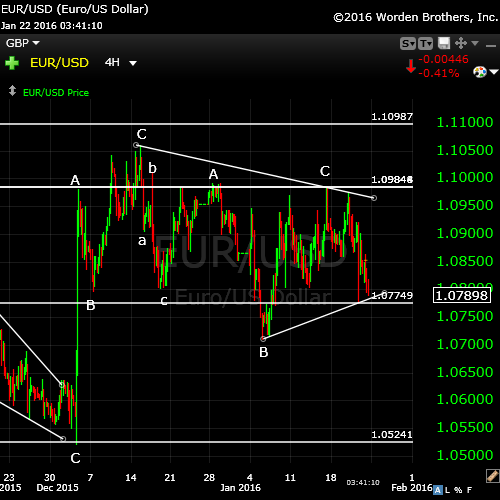
Here’s a chart of the euro/dollar (4 hour) showing the triangle. The euro has been running counter to equities in lock-step pretty much. When it heads down, equities head up. It’s also at an inflection point. I’ve been expecting it to head down to tag the previous low before heading up in tandem with the rest of the us pair currencies, which have now bottomed (except for the euro).
This also brings up a scenario that (since this is not a complete triangle–it would need one more leg up) that maybe equities will do a second wave of the third (since we seem to have completed 5 waves up in the C wave) and then will do a larger C wave up to the 62% level while the euro reverses down to tag the previous low.
Pure speculation, but would give a potential path if we have more upside to go in equities, based on the recent relationship between the euro and equities.

Here’s ES at the end of the day (one hour chart). You can see that we’ve completed the a wave (it was in 5 waves up) and then the b wave, along with 5 move waves up of the C wave. After 5 waves, we need a retrace, so we might see another wave down (could go as low as 62% of the distance to the bottom of the b wave) and then the balance of C up. In other words, a double zig zag).
Hard to say what will happen at this point. Maybe we’ll have some more info on the weekend from the euro and futures …
USDCAD
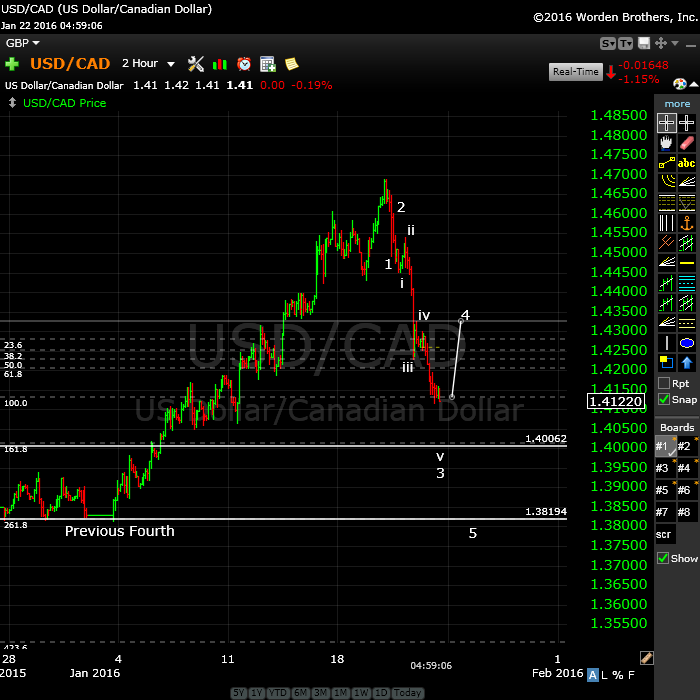
Above is the 2 hour chart of USD/CAD. A lovely motive wave structure, with more still to go. This is how a set of motive waves should look!
Wave 1, as always, sets the tone. Wave i was the same length as wave 1. Wave iii was 1.618 X wave 1 (and i, as they were the same length). Wave v should be 1.618 X wave 1 (or it could extend to 2.618 to meet the previous 4th). Then we’ll have a good sized retrace in wave 4 and finally, wave 5 up to the previous fourth.
Either wave 3 will get us to the previous fourth or wave 5 will–could be either, but you can always tell by the sub-wave structure. Then we’ll have a large retrace 62% (a higher degree wave 2). It’s much more likely wave 5 will get us there.
__________________________________
Update Wednesday, Jan 20, 2016
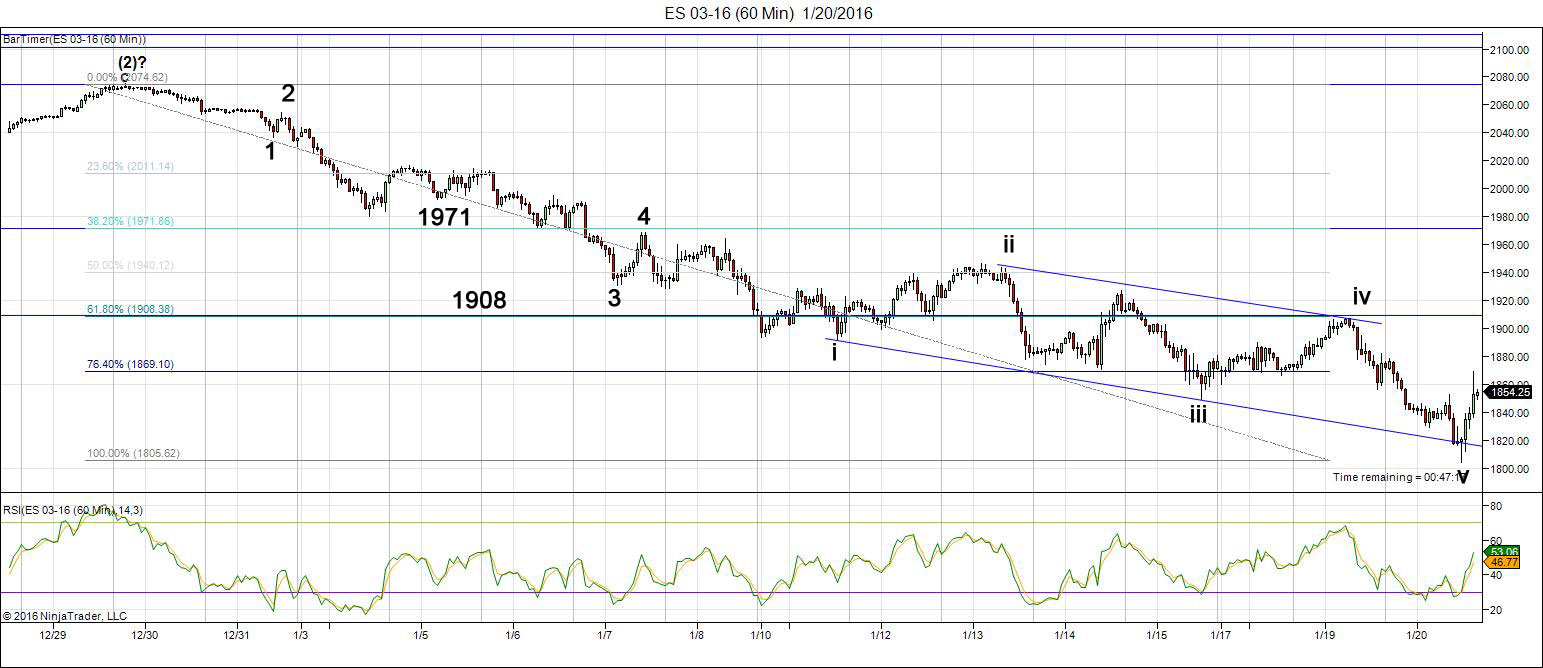
Above is a one hour chart of ES … the rogue wave that’s been driving us all nuts. I’ve placed on it the ending diagonal so you can see how it unfolded. I was able to target 1820 with a throw-over, so a little lower was the call. We hit about 1800 before the bounce. Bounces from ending diagonals are dramatic, as this one has proven. The usually revert to the beginning of the ending diagonal, and because of the shape of the wave, this suggests a 62% retrace.
The wave has a tiny 2 and so it’s not a motive-looking wave—and, of course, it truncated, so that’s been the dilemma. The fifth wave is very long (as a 5th of a typical first wave down is). I’ve put on the two retrace levels for ES, 1908 (38%) and 1971 (62%). We’ll keep close to this, certainly as it affects timing (the Fed meeting and the cycles turn Jan 27-29).
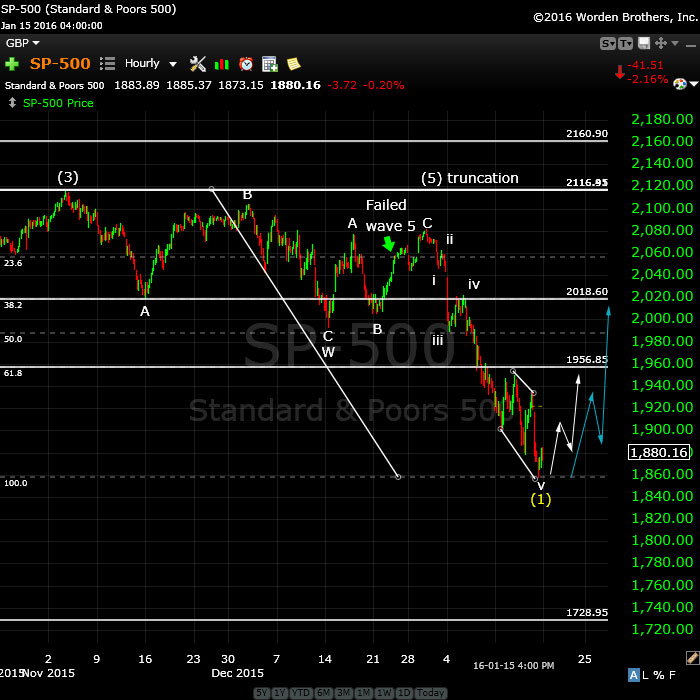
Above is the one hour chart of the SP500. I’m showing a range of possible turn points due to the truncation. A retrace requires at least a 38% retrace, but the market typically turns at the previous fourth wave, if it’s higher. Here I’m showing a fourth wave (lower degree) just about the 38% retrace level.
I’m also showing the higher degree fourth wave about the 62% retrace level. So, these areas are what I feel the most likely turn point ranges. I’m measuring from the top of where wave 1 should have topped. I should be around all this next week so I’ll be able to alert you as to how we’re doing as we climb the wall to the turn point.
_____________________________
Original Post: We’re now into “the big drop” that I’ve been predicting for several years now. I’ve only had this blog up for … well, almost a year–about April (just before I called the May market top). Accuracy has been high, but I’m not beating my own chest when I say this—it’s more about the predictability of the market, and the brilliance of Ralph Elliott in figuring it all out!
Of course, lately we’ve had some question as to where this market is headed short term, but that’s because (I’m absolutely convinced!) we’ve experienced a very low probability event—a truncation (or “truncated fifth”). That’s when the 5th wave of a final sequence does not travel past the top of the previous 3th wave, as is required by the Elliott Wave Principle. It’s only happened a couple of times at a high degree of trend since 1932 and it can be as confusing as heck (as we’ve just seen).
I also rarely trade a first wave of a sequence because it’s always guesswork as to whether it actually is a first wave and whether it will retrace on you. There is eventually a 62% retrace, so you’re trading off 38% of the move for the added certainly of a turn into a much longer third wave.
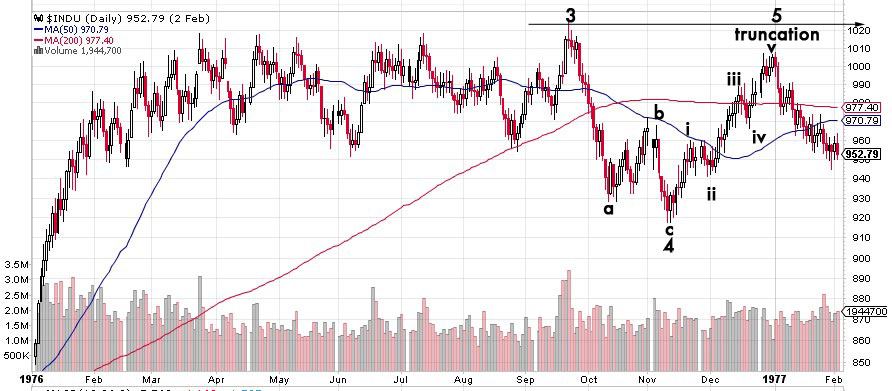
Above is a daily chart of the DOW showing the 1976 truncation. Notice that the timing of this 1976 ending wave truncation was exactly the same as this current truncation (looks like Dec. 31). This structure looks very much like the very top of our current market (May 20, 2015). However, this time the truncation has happened in the second wave position. You can see that the bullish wave count leading to a truncated wave 5. In 99.999 percent of cases, the fifth wave will meet or exceed slightly the third wave top.

Above is a four hour chart of the SP500 as at January 8, 2016. This was the point at which I suggested we could have a bullish triangle forming.
This was the only viable alternative to the crash I’d been expecting. It didn’t mean we weren’t going to crash–it only meant it would be delayed by a few weeks. But the C wave down on this chart has dropped to a point wherein the triangle option is no longer valid on all the indices. It only took a couple of days before that option was taken off the table. So, we only have one option left … down we go. I put us at the end of wave 1 of 3 down (the degree is debatable at the moment). However, we need to do a retrace first.
It’s important to remember that Elliott Wave is all about probabilities. I always go with what I feel is the highest probability based upon the wave structure. I will change my tune if the wave structure at any point tells me to do that. The structure down from here should be much more predictable, because we’re into motive waves now, which are highly accurate in terms of the fibonacci relationships to preceding waves.
Because of the structure of this first wave down, though, there are options for the height of the retrace. Its length will give us a very good idea as the length of the next wave down, and that will tell us where we are in the wave structure. The overall direction is down—a long way down. So strap on your helmets. Here we go.
I’ve put the specifics and options in the video below so you have a head’s up on where I believe we’re going and why.
 |
 |
Make sure you zoom the video to full size with frame expander (arrows) in the bottom right hand corner and also set the quality to as high as your web connection allows. This is an HD quality video so the best viewing is at that level. |
____________________________________
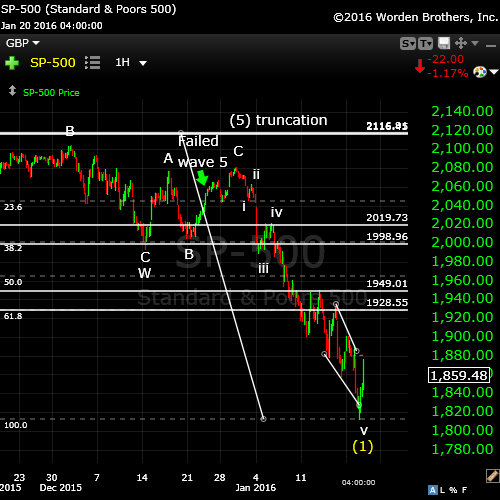
Above is the operative immediate wave structure. This is a one hour chart of the SP500. You can see the top of wave 3 on the top left of the chart. After much thought, I have changed the truncation point. I’ve marked on the chart the wave that I believe is the failed fifth wave. This has created a more likely dwarf wave 1 down. You can see the attempt at a motive wave with the five waves down marked on the chart.
Here is a typical wave one structure.
Because this wave is damaged, I’m going to put two options on the chart in terms of the retrace level. We will either get a 38% retrace (white arrows) or a 62% retrace (blue arrows). The wave up will be in three waves. We will turn over into either a wave 1 extension or a third wave (the degree to be determined). I will update the chart when we get past the turnover to show the expect path down. My preference (not a huge percentage preference) is for a 62% retrace because this wave has come down to the previous larger degree first wave down level.
Obviously, I am still expecting the US dollar to head down during this first portion of the crash (it has not retraced fully from the first wave up) and I’m expecting the eur/usd pair to head up for the same reason.
Emini Futures hours (ES, NQ, YM)
- Sunday, Jan 17 – open 6PM EST – midnight EST
- Monday, Jan 18 – open midnight EST – 1PM EST, open again 6 PM EST into regular schedule
Cycles Turn Date
There is a major cycles turn date January 27-29. The US Federal Reserve meets Jan. 26-27 with the typical announcement at about noon on Wednesday, January 27. With this first wave having taken about two weeks to drop, I would expect the retrace to be about a week or a little more. That brings us to the top of the second wave just at about the time for the release of the FED statement on Wednesday. Expect some market fireworks at the end of January.
The Tell for the Turn Over
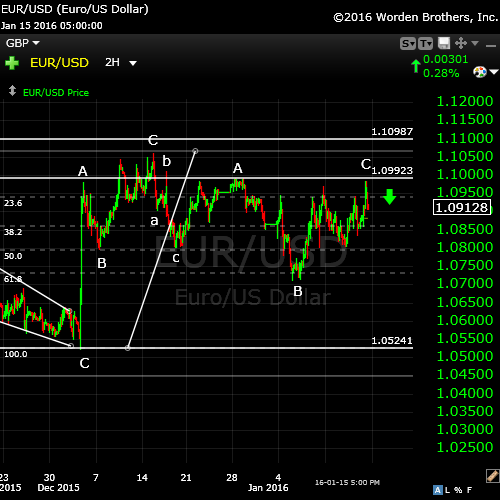
I’ve been mentioning ad nauseum that the eur/usd pair is moving contra to the US equities market. Here is a 2 hour chart of the eur/usd pair.
I have been short off and on, but as the equities have been bottoming, the eur/usd pair has been hitting its head on the ceiling. You can see all the spikes as it tries to go up. However, it still has to bottom (1.05214) or at least get the previous 62% retrace level (the right-most wave B label on the chart). I’m expecting a retrace to the bottom as my preference. On Friday, the C wave on the right made a double top and turned (approx. 1.09923), just as the equities reached their current bottom.
When the US equities reach the appropriate retrace level, I expect the eur/usd pair to turn up.
_______________________________
History: The 1929 crash
I posted the 1929 chart a few months ago and now’s the time to bring it back to the forefront. I would expect a similar path moving forward.
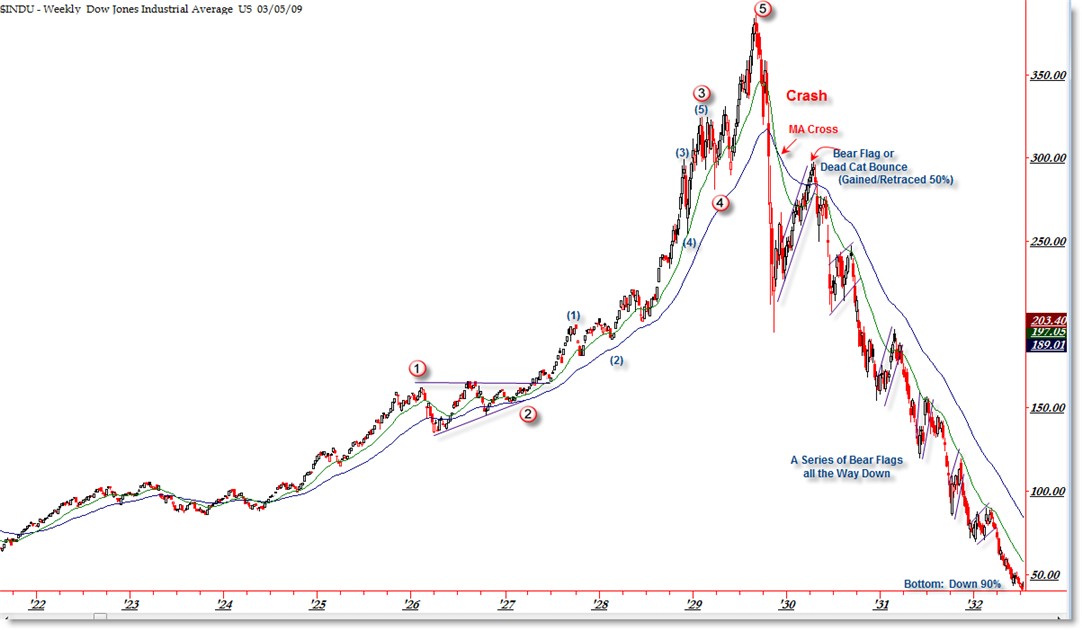
I think it’s important to look at 1929 and the wave structure (above and below), which was the same as 2007—to a point.
The wave structure of the 1929 crash was in 3 waves overall. There were 5 waves down from the top (the A wave) and then a very large B wave retrace. The final C wave down was a stair-step affair and lasted over 2 years.
In our current situation, we’ve had wave one down that’s lasted three months (May, 20, 2015 through Aug. 24). Then we had wave 2 up, which lasted from Aug. 24 through Dec 31, 2015 (approx. 4 months). I would expect the wave 3 sequence down (all the waves—the A wave) to last approx. 3 months. Next is the fourth wave (B wave), which should be at least 6 months, I think and then the final C wave to the bottom, which will likely last a couple of years.
Let’s look a little close at the timing of the 1929 crash because the similarities to today are uncanny.
The market peaked on September 3, 1929 and then it took 2 months for the crash to actually happen (to reach the bottom of wave 5 of the A wave). The larger crash which we always hear about began on October 23, 1929. Then there was that large B wave, which lasted 5 and a half months and finally, the C wave which went on for more than 2 years. This might be the scenario we’re looking at going forward.


Just a fantastic commentary…do you expect to have your book or publication on deflation out before this all takes place. Also, your thoughts on what gold
will do in the intermediate future. I’m a new EW student and appreciate your willingness to share your years of experience with those here.
Thanks, Robert.
The book will likely take another month or two. I may have it in digital before print.
Gold is heading up. It should retrace about 62% from the top and then it will head down to around $750 before taking off again. That’s quite a ways away. Short term, it’s heading up; however, I don’t see five waves up yet, so it may still do a double bottom.
Thanks Peter. Hopefully the electronic will come out first. I will take several for
my unbelieving family and friends.
Yes, isn’t it unfortunate. I have the same situation—a disbelieving brother and sister who risk losing just about everything they’ve worked so hard to acquire. People simply think it can’t happen, even though we’ve had one severe depression every century since the beginning of recorded history. This being a 172 year milestone, it will be one of the most devastating depressions in history because the debt bubble is the largest in history.
Personally, I’ve had to “let it go” in terms of their risk factor. There are some things you simply can’t change.
Lots of folks got bullish because the FANG stocks went to new highs. But, do they remember that the whiskey stocks did the same thing in the spring of 1930??? —-Peter, please check you chart of that era. Am I reading it correctly that nearly all rallies stopped at the 50 day average and not the 200 day????
Peet!
Whay can I say…FABOULOUS piece of writing. I am with you the whole way, know that Peet!
And yes so sad that a lot of hardworking people will go bankrupt…
Cheers,
W
Peet,
Fyi: sold my puts as of Friday and went into call options Feb.
I still believe in my 15 January turndate as the bottom of 3.1. Also, my price level of AEX 397 was almost met (398,xx).
Cheers,
W
I have the same turn date on Jan 15th. when is your next turn date? I’m thinking up to Jan 21 and then back down into end of the month. What are your thoughts on the the next major moves?
Andre, when will you post ?……nick
Peter – i have been reading (and listening to) your last post and studying your charts. Excellent post!
A question – your SPX hourly chart computes the 38% (1956) and 62% (2018) retrace from the top of your labeled W3 (2116). I thought the W1 down would begin at the top of truncated W5 top (2080). Wouldn’t you calculate your Fibo retracement of W1 from the top of presumed W1 (down-2080), rather than the top of W3 (up-2116)?
Perhaps I am missing something, but if I Fibo from 2080, the 38% retrace would be 1943 and the 62% would be 1996 – see my chart
Thanks!
amb
http://invst.ly/y5mx
Great question, amb.
Here’s why I’ve done what I’ve done after some amount of thought.
The market is extremely mathematical, ordered, and precise. It always seems to measure correctly to the appropriate point, taking everything into consideration. Waves down in a motive pattern tend to end at the appropriate fibonacci signpost and you can usually equate these levels of resistance and support with similar ones months in the past. Our first wave down, for example, came down to the previous 4th wave and so far, no further. But the wave is a dwarf. It crunched itself up to get to the point is was supposed to to make the bigger picture work. The top of the wave is the problem, not the bottom.
So, I am treating is as a truncated wave, with the idea that it simply could not reach the top, and because of this, it’s a short wave.
When I measure using my fibonacci tool from the 2116 point, the 62% and 38% lines rest at the appropriate points. The 62% at what I am assessing as the previous 4th (as it should) and the 38% at a lower degree fourth. The lower part of the wave looks to be close to what it should look like had the wave not truncated; the top does not. Using the top of the wave as the starting point the fib levels end up in random spots, which would be unusual.
So, I’m treating the wave as a truncated wave with a dwarf top only, because in the bigger picture, it seems to have hit the appropriate levels from a fibonacci perspective and the wave length has compensated for the part of the top of the wave that is missing.
Not sure that I’ve explained this well ….
amb,
Well, I think my well-thought-out logic is going right out the door with this last wave down. I think I’ll likely provide a small range in terms of the retracement levels.
In ES tonight, I’d say we’ve done 5 waves up (countertrend waves) and that we’re now heading down 62% and may turn there to head back up. Eur/usd is doing exactly the opposite and it heading up to the 62% level from it’s recent previous top, I think.
I have a target for ES (62% retrace of 1870 or so). That would result in a potential C wave to end a little above 2020. We’ve in the B wave at the moment after 5 waves up (A wave).
Wave c down in ES will be the same length as wave a down at 1865, which could also be a turning point.
eur/usd is almost at the 62% retrace level that I cited in the blog, so that tells me ES is very close to a bottom. It will likely bottom when eur/usd touches the retrace level.
That level in eur/usd is 1.0935 approx.
Finding the bottoms of indices’ waves can be a bit of a challenge. The eur/usd worked out perfectly and that’s where I am. I note that ES came down to a point at which the C wave up at 1.618 X wave A comes to the 62% retrace level at about 2009.
Sorry, I “mistyped.” Wave C at 2009 in ES will be 2.168 X wave A. It may go up as a motive wave in 5, although I expect lots of twists and turns along the way.
My Jan 20 th date is here 🙂
The question me now becomes the Jan 23 full moon and
Mercury turning direct Jan 25th . If the produces a pop
This the upside It gives clues that the full moon lunar eclipse
Can be a low in March 8th I believe .
That said th puetz Window opens the first week of February
My assumption at this point is the stock market is in
A bottoming process and if so the downside momentum
Is on the verge of ending .
Joe
Congratulations Joe,
I think this has to be the washout day…. not 100 procent maybe the full moon Jan 25 ..just like 2008 it also was the full moon that ended the bearparty after that we went up till Feb 4… and there was a lot of volatility till march 8 wich produced a slightly lower low…
We’re at a new low in futures. It appears to be the last leg of the ending diagonal, which will hit 1820 ES at least and lower likely with a throw-over the diagonal bottom trendline. Eur/usd is now heading up to tag the previous high at 1.09850 it appears.
We’re now at 1820 ES and the last small wave is in 5, which should mark the end of this wave. I will have to revisit by retrace levels. The eur/usd hit its target, too, overnight and has turned down.
There’s the ending diagonal “snap back.” We’re in the third wave, which should keep going. In ES, either to 1845 or 1866 before a 4th wave retraces 38%.
Peter-
With the assumption that we are in wave 2 of the larger degree wave three, since this corrective wave against the bearish trend has been only two days, do any of your scenarios have this 1915 on the SPX as being the 5th of Wave C of Wave A of Wave 2 or are you thinking this may even just be the 5th of Wave C of Wave 2. I didn’t see it denoted on the screen short that this is wave 2.
Certainly understand we will need to see more to know for sure, but this two day bounce does not seem to be enough to be the entire wave two, when wave 1 was about 3 weeks.
Ted,
I agree wholeheartedly with the timing issue. Yeah, I think we’re short. Certainly for wave 2.
However, if we turn at 1915, then I would consider this wave 4 and that we’re heading into wave 5 down of 1 of 3. That’s really the dilemma. A 38% retrace leads to a long wave 5 (but we’re come down to the previous 4th, so my preference is to call wave 1 complete).
What happens now really tells us everything. If we continue up past 1915, then we’re heading for wave 2 and a 62% retrace. That means wave 3 of 3 down is next.
I didn’t really follow your scenarios (difficult without at chart, but I’ll have the forum up this weekend and you can chart like crazy!) but I hope the dilemma between wave 4 and 2 helps to answer your question (that’s why it’s not on the chart, cause I don’t have enough info yet.
The other issue is the cycles turn date, which is the end of next week. And Yellen, which is the middle of the week. I think we continue up, or we do a small 4th wave down and a 5th wave up to complete C, either at the 38 or 62% level. That’s about all I know. Will have to wait to see what the market thinks …
Hi Peter,
Is wave ( 1 ) finally in ?
Is so what is your target for wave ( 2 ) please .
Regards
AZ
Wave 1 is finally done. The ending diagonal says it all. And we now have a motive snapback.
I’m going to have 2 targets. Either a 38% retrace or 62%. A ways to go for those. I will measure them this afternoon and post as an update. In the SP500, the range for 38% is 1915-1928. I’ll figure out ES and the other indices, as well. It think the turn will also depend on the cycles turn at the end of the month 27-29 and Yellen on the 27th, I think it is. I expect we’ll rise to the Fed meeting and we’ll see where we are then. You definitely don’t want to miss the next wave down.
Thank you Peter for your prompt reply .
I will follow your advice / posts as to when is the best time to get into Wave ( 3).
Regards
AZ
🙂 Now the fun begins. The first wave is always the challenge.
Peter – at about 2:15PM EST I think we are either ending w3 up or in w4. This is wave 3 (or 4) of 1 up? then after there will be 5 of 1 up, then there will be a W2 62% retrace of the full wave 1 up (once it is complete), before w1 of Three up? Am i on track?
amb
Basically, yes. We have to do an abc wave up, but the a wave is typically in 5 and the c wave as well. I would say that wave 1 typically goes to the previous fourth, which in this case would be the start of the ending diagonal, if we’re going to retrace 62%. If it’s only 38%, abc will be shorter, of course. The c wave is typically a fib ratio of the a wave, either 1, 1.6, or 2.6.
Hope this helps a little. Still early.
If I look at ES, I would expect the first wave up to hit the previous small 4th at 1852, then a big retrace and then another turn might be at the larger turnover at 1909 and so on. This being an oddly shaped wave down, the market may have other ideas, but that’s generally my experience.
thx – i targeted end of w1 at about es 1855; pretty close, if it works out that way. Then a retrace down, as an abc, but still 62% retrace of w1?
Yes, but as I say, we have an extended wave. I put us in the middle of 3 … a ways to go. Then we’ll get a big retrace. My guess is tonight.
Oh, I just looked at the time. Maybe this continues tonight and down tomorrow … I don’t see an immediate end to this wave.
Nothing like waking up the bulls …
Peter – Thank You!!!
I was underwater this morning with position I opened yesterday. I closed it about 3:30 EST today for a positive profit. I am content, even if we are only half way thru the wave. I am learning that greed is the downfall of trading; I am very satisfied with this profit.
Perfection is something that we strive for, but rarely achieve. You may not be perfect, but you are tops in my book!!
amb
Impossible to be perfect in trading … haha. Hang around. Wave 3 when it comes will be 1.6 or 2.6 times the length of wave 1 down. It will be something to see … and profit from. I’m not a big fan of playing these countertrend moves. I may get into ES after a second or b wave drop. I have also never really made any money in a first wave down, unless it tops properly, which this one sure didn’t
I’ve never seen such a difficult market, with truncations, etc. Once we get a second wave up with a turn, then that confirms the new trend. We kind of have that with the top of the first, if it weren’t for the truncation, which technically still has to be confirmed.
You see, this is the motive look to a wave that I expected to see in wave 1 down, but we didn’t get it. We will for wave 3.
The caveat I’ll throw in to this wave up is that it looks more like it’s extending and might just blow right past the first marker. After an ending diagonal, the market tends to head relatively quickly to the start of the ending diagonal. Each wave should have 5 waves within it, and so counting waves is a great way of staying ahead of the turns.
Eur/usd has just broken key support so ES should keep going … we’re in the middle of wave on both.
Just to say thanks for comments. Wave 3 should be something to see.
Other site I watch, which you are aware of, The crash has started!
Thanks to everyone.
A “crash” being somewhat of a misnomer, of course, as the waves come down in a predictable pattern … and measurable manner, once the first one sets the length.
So Far this jan 20th turn date is showing some promise which is good
for me because it is a new method based on head and shoulders top formations i only recently discovered.
That said jan 23-25th ( the full moon and mercury turning direct is next )
what i need to see is a series of 1’s and 2’s which needs to look like
1 2 i ii , this could take until early feb to as late as march 23rd .
but the main thing is i need to see the counts .
today’s reversal as good as it looks is only 1 day .
if i see the 1 2 i ii set up then i would make the case for new all time highs
if i don’t see the set up then something else is taking place .
once this rally takes hold it is going to take a while due to these oversold readings .
the potential is a bounce in a weekly wave 4 into march 8 then down to new lows into march 23rd . either way i think we saw some sort of momentum low today .
Joe
Thanks Joe,
I m looking forward what is in the Joe cards..
Mahendra is very bullish he predicted the down move for Januari.
He saw the end of the decline today …
Dear Members,
I just got up after a long period of meditation and decided to write this update. Even though it must be very hard for everyone to take our note seriously because the markets are falling nonstop without any break but we have to write because it is our job to write our view:
Two things to be noted:
1. The market’s negative cycle is ending on 21 January 2016 which is tomorrow. Many of you must have read my book, and if you did you must have seen that we recommended buying the market at the end of the second cycle. This is the second cycle mentioned in our book.
Second Cycle:
From the 11th of January to 21st of January 2016 – During this time cycle, the market will remain directionless but buying will keep coming on the lower side, and if I am right in my reading of the astro cycle then the market may form a great solid bottom. Any sharp correction during this period should be taken as a buying opportunity. The overall sentiments in all the major markets will remain mixed to a bit negative. We do strongly recommend taking aggressive positions during the last 63 hours of this cycle, or before the 20th of January, because on the 20th of January Mercury will rise in the east which is a positive astro move for the market.
2. Our lower side mentioned targets for this year have just been achieved. We don’t see S&P remaining below 1821 (this is the spot level for S&P mentioned in our book) for more than 24 or 48 hours. In fact, below 1862 is still a great buying level for those who are taking positions for the next one month. We don’t see the market remaining below 1862 for more than three days.
Currently the spot S&P is around 1815, which is 6 points below our range. The market is crashing lower without stopping and surely many are worried with this sudden fall which came out of nowhere. The market is making a low of 2016 in the first three weeks of January and we still have a whole year (Which is not negative at all) pending so those who can afford to buy the market at current levels should do it without even thinking twice.
During a volatile period, anything is possible but the good news is that 70% of the volatility will end on the 21st of January and the remaining volatility will end on the 26th of January.
Avoid metals, specially gold at this stage, our target of $1107.90 have achieved and sharp fall may occur in the next week. Oil has also achieved our lower target today of $27.71.
Those who have deep pockets can add some more positions, and those who want to add some call options can do so here. In April we still see the USA market moving towards an all-time high.
Let’s see if the market and oil forms bottom or not today! The Astro indicators are saying that S&P won’t close below 1821, and oil $27.71.
Investors have to be patience
In 2004 we predicted that $400 would become history for Gold. A few days after making that prediction gold dropped below $400 and many started doubting what we said and said that gold going back to $300, but we maintained our target of $1600 to $1800.
In 2008, we mentioned that oil would move towards $30.00 not $145.00 when I was trading at $132.00. When oil moved to $147 the same thing happened; many started telling me that, “Mahendra, oil is going towards $200 so you should stop predicting about oil and where it is going to move.”
In 2008 February we called that the market had bottomed out. In 2011 we predicted a historic bull market for USA but once again many were not buying these predictions. You may forward this email.
I have repeatedly proven time and time again that the Astro cycles are the most powerful tool that help us predict where the market is going to move.
The cost of the book comes to less than a $1.00 a day. I would like to emphasize that this is not a story book or a novel. This book will show you the future of the financial markets. This book does not deal with what should or could happen, but with what will happen!
I would like to end by saying that I will highly appreciate it if you can play a small role in introducing the “2016 Financial Predictions” to the world.
Thanks & God Bless
Mahendra Sharma, January 2016 9.30 AM Santa Barbara
Hi Joe,
I m a little bit confused In your comments do you see 2 possibilities new highs or a top early Februari ?
Thanks in advance?
I’ve posted a chart of the first wave down in ES with the ending diagonal clearly marked and some retrace targets. I’ll also add the targets for cash indices later tonight.
ES is in a second wave this morning. Once eur/usd finishes retracing from its drop this morning, ES will head up in a third wave. It looks like SPX also has not quite finished the second wave and will need a C wave down before continuing up.
Could be wrong. The eur/usd is heading to the objective (62% retrace). Maybe ES is too strong to reverse and it’s just going to slow up its progress, which it certainly has so far. In any event, I don’t think we’ll see a lot of progress in ES until the euro resolves the retrace issue. The trend is up in ES overall, though. We may just have a pause for an hour or two.
NetDania. Anybody using this great little app for iphone or ipad? It may be in other flavours, too. It’s got lots of great charts (FXCM data) and chocked full of additional functions. It’s the first app I’ve seen anybody do right. Lots of international indices all for free.
The forum is coming. The flu and a current kidney stone have made life interesting over the past few weeks … haha. Messing with my schedule a bit.
Take care buddy!
W
Thanks, but I’m actually doing GREAT. Just a little behind. But, now that the markets are moving, I’m going to change my hours and will likely be around much more during February …
Forex reversals. I’m also now finally seeing what look like reversals in usd/cad and aud/usd. Aud did a double bottom and CAD sports nice motive waves and is up 4 cents in two days. Maybe I’ll be able to travel to the US one day soon … 🙂
Futures are at new highs, so the euro slowed them up, but a lot of strength in bulls obviously. I put the target for ES for this third wave at 1951 approx.
3rd wave is the same as the C wave. That target for this wave is 1.618 the length of the first wave up (for ES). The first wave measured almost perfectly by fib numbers. The third wave of it was 1.618 X the first. The fifth was a bit short at about 1.3 X wave 1.
Here’s a little head’s up on ES levels (which will relate to the other indices, as they’ll all turn together). The 1 X the first wave level for this current wave up is at 1908, which is exactly the 38% retrace level. We need to watch that level.
However, the strength leads me to believe we’ll hit the 62% level before a turn. This being Thursday, I would guess we’d go into early next week with that (it will likely slow up towards the top). Still looking around the 27th onward for a turn.
This is the influence of the euro/dollar I mentioned earlier, just the timing was a little off. The euro is topping higher than the 62% retrace and this is the true second wave in ES. This will head into a third before the session is over, I think.
I keep a euro dollar screen up and it warns me about ES. It seems a bit ahead of ES movements these days.
Not “true” second, rather this should be the second wave of the third. Still, a BIG retrace …
Thanks Peter…
I don’t think we’re done yet. I think eur/usd has to hit 1.09 before getting back in the water.
Lots of nice volatility, though, if you’re nimble.
I have a target low in ES of 1850. I don’t like the wave structure. Bunch of 3’s today. If we go below 1850, I would be concerned.
http://www.zerohedge.com/news/2016-01-22/what-sent-stocks-soaring-overnight-dbs-jim-reid-explains
I have a possible pivot point at 1910 ES and 1915 SPX but we’ve only just begun the C wave and if it extends to 1.618 X wave 1 (which is typical), it takes us to 1980 SPX, which is also the 62% retrace level of the actual wave.
I’ll update the SPX chart to reflect that possibility tonight.
USD.CAD has rocketed about 7 cents in about 2 days. The low loonie has been all over the news for about 2 weeks—a sure sign a turn was due.
I posted an important SPX update chart at the top of the post.
Peter,
how do you see the Eur/Usd ?
Should Euro follow Cad/Usd ?
Hi Dmitri,
Well (a big pause), I’m not sure about the euro. I’ve been looking at it off and on all day. It’s been running counter to the equities and still appears to be, but it’s also at an inflection point. I can place the eurusd in a large triangle, as well. I was thinking it will head to tag the previous low, but I’m not sure about that. Other than the triangle pattern and fib ratios, there isn’t much to work on as the waves are all in 3’s. I think if it break this 1.078, it will tag the bottom (1.524) and equities will keep heading up …
usdcad is working on the last wave of 5. I think it has a little further to go, to at least finish this wave. audusd and it tend to run in a pack and aud is starting a second wave down I believe. I don’t think cad will be far behind. It will be a nice short (the second wave in cad).
I’ll post the euro chart on the weekend and perhaps cad and aud as well. All these things are setting up in one way or another.
Dmitri,
I posted a euro chart with my comments – what I’m thinking. Top of the post. It depends on what happens with the inflection point we’ve reached.
Just a note that the euro has done a double bottom on the 1-5 min chart and turned up (early yet, but let’s itself to my scenario, which would call for futures down in maybe a wave 2 of 3 over the weekend).
I just posted a chart of ES, as well.
Thanks Peter,
I mean what is your more long term expectation for Euro after it finishes with the triangle ?
Dmitri,
Sorry, buddy. I didn’t “get” that. This is good, though, because as I work on the forum, I realize it will be a place to keep longer-term issues I’ve talked about and I can add to them. In a blog, it’s more fleeting and harder to find past posts.
I’ve maintained for about 5 months that all the currencies will reverse (dollar drops) as the market comes down–for the first leg, at least, and then I think deflation takes over and the dollar heads back up again to new highs.
The market has a memory. The issue with the euro is that when it retraced, it didn’t quite hit 38%. If you remember back with the NYSE, the market simply wouldn’t reverse until the NYSE hit 62% exactly. It always does that. It has to get to the fib number. I’ve seen that happen over and over and over … makes you crazy … unless you know about it … an unwritten rule.
So, AUD, GBP, and CAD have all reversed. I originally thought the euro would be the first, but it looks like it’s going to be the last.
I think the euro is going to do that last leg up in the triangle and then reverse to tag the previous low (what a triangle does in the fourth wave position). Fourth wave triangles always signal the end of a major move. There’s always only one more wave after them.
And then the euro will head up to finally get to the 38% retrace level. The other currencies meanwhile will do a second wave while the euro drops to the low and then they’ll go into third waves up (likely a 62% retrace) while the euro does its 38% retrace, because it’s really that much weaker.
The dollar is going to reverse of course, at the same time. Easier to show on a chart. I’m going to do up some long term charts of gold, and currencies. Also oil has just bounced from the ending diagonal. That will make Calgarians happy. However, with the rest of the market coming down, I’d be surprised if it’s a huge winner.
I’ve never seen so many ending diagonals in my life! They’re all over the place!
Hope this helps. This is “all the same market”–it’s all moving as one generally as debt restructures and disappears 🙂 Prechter got that right!!
Ment to put this on the bottom of the chain, using a small computer as i am on a plane.
Peter-
With the assumption that we are in wave 2 of the larger degree wave three, since this corrective wave against the bearish trend has been only two days, do any of your scenarios have this 1915 on the SPX as being the 5th of Wave C of Wave A of Wave 2 or are you thinking this may even just be the 5th of Wave C of Wave 2. I didn’t see it denoted on the screen short that this is wave 2.
Certainly understand we will need to see more to know for sure, but this two day bounce does not seem to be enough to be the entire wave two, when wave 1 was about 3 weeks.
I also posted a chart of USD/CAD so you can see the motive wave structure (what we’ll be looking for in equities heading down) and see how the fibonacci count works.
Does anyone have a good count for oil? It seems to be tightly correlated with the market and CAD at the moment.
Hi Paul.
I’m going to do a video tomorrow and I’ll include it. Generally, we’ve been in a large ending diagonal, so have been expecting a big bounce. I can’t access charts right now, but I hear we’ve completed 5 waves up at small degree, so that would mean we should continue up.
Thanks for keeping us apprised, Mr. Temple.
Hey, Mike … you’re very welcome!
Hi Peter,
where do you think are we in the longterm wave count on the SP500 ? Have we topped last year in May 2015 as Cycle wave 1 and now underway for wave 2 down to around 1200 in the SP500 ? Many thanks and enjoy the weekend
Jaze
Hi Jaze,
Yes. I’ve maintained since well before April that we were topping. There was only a two day period in December, I think, where I thought we might peak to touch the previous high, because a triangle seemed to be forming. But we truncated instead. Boy, THAT’S bearish!
We’re actually in a second wave (or a fourth–this week will give us an answer to that question) and we’re setting up for a large wave down. We should top near the end of the month (later this week). Coming up next is the all-in wave 3 down as it will be at least the same length as the first wave down (if we peak at 38%) or 1.6 (or 2.6, which is my preference actually) X wave 1 down. I’ll know more in the coming week.
This is likely the most important week of the year coming up.
Jaze,
I’ve tried to cover this off in the new video.
The first serious low will be early January 2017. Next week will be down in abc. Then a retrace into 2/7-ish and then down again. I see a very strong date 4/23-26. That will be a low. After that a longer retrace into 8/10-11 before we turn down again heading for 2017. This bearmarket will run into 2020-2021.
This weekend was a major date to test. Even more significant than 12/25. So after this weekend a more convincing downtrend.
I guess this confirms what Peter wrote above.
André,
haha … we need to get in sync in comments. We seem to be re: the market! I just created a new post. Do you want to repost this note or would you like me to do that for you?
Please repost. Maybe I’ll add some arguments tomorrow.
New post: https://worldcyclesinstitute.com/how-weak-a-week-will-it-be/
This website is for educational purposes relating to Elliott Wave, natural cycles, and the Quantum Revolution (Great Awakening). I welcome questions or comments about any of these subjects. Due to a heavy schedule, I may not have the time to answer questions that relate to my area of expertise.
I reserve the right to remove any comment that is deemed negative, is unhelpful, or off-topic. Such comments may be removed.
Want to comment? You need to be logged in to comment. You can register here.