
 I’ve been amused at the statements in the major media that people generally are glad to see the end of 2016. Well, watch what you wish for! 2017 will be much, much worse from an economic perspective.
2017 will be the year that “The Financial Revolution” begins in earnest. Over the next few years, I’m expecting a move towards public central banks (backed by the government) rather than the private central banks (backed by private investors) that we have right now worldwide. There will be a move by the people of individual nations to get control of their money but it will likely not happen quickly or without bloodshed. The start of the process should begin to get underway during the 2017 year.
We’re once again in the classic struggle of the people against the moneylenders. This fight happens over and over again throughout history, but this time is a 515 year cycle top and the bubble that’s been created is the largest in history. There’s no way out of the current situation other than with a complete overhaul of the factional reserve system that’s in place around the world. It’s concentrated wealth in a few hands at the expense of everyone else.
Money rightfully belongs to the people of each country. That’s why it was invented —as a medium of exchange, not as a commodity. In fact, with fiat money, it’s constantly changing in value, so it’s not wise to covet it as a commodity in the longer term.
That aside, it’s usury that’s our biggest problem. Centuries ago, usury was defined as any amount of interest attached to the lending of money. Oh, how that’s changed!
In Canada, we have a law that states that lenders cannot charge more than 60% annually. Why did they waste time even debating that law!? On the other hand, the Islamic religion outlaws interest of any kind and guess what, their banks are doing really, really well and springing up all over the US.
Let’s look at how this ponzi scheme that central bankers have created is going to unfold. The period in the US just after the war of 1812 is a good example of an economic cycle top, but I could have picked the depression of 1837, 1857, 1873, 1893, 1907, or in fact, 1929. If you look under the economic hood, the engine worked in a similar manner.
In 1816, a charter was given to “The Second Bank of the United States,” to become the central bank on a federal level. In granting the charter, Congress demanded (and got) $1.5 million dollars from the investors in fees. In return, the government invested 20% of the required reserve capital, with investors to supply about $7 million in gold and silver—the most that they ever raised, however, came to a total of $2.5 million—and taxpayers, as usual were on the hook again. The largest concentration of investment ended up being from foreign sources: Guess who; the Rothschilds, once again.
With the War of 1812 over, attention in the US turned to the west of the country and the expansion, with the wild speculation in real estate. In 1817, Pennsylvania chartered 37 new banks, followed by Kentucky with a further 40. Banks sprung up all over the place and, of course, with minimal reserves, they all created new money like crazy, based on it being a fractional reserve system.
The money supply expanded by $27.4 million, which inflated the dollar by about 40%. Taxpayers footed the bill once more.
In 1818, “The Second Bank of the United States” got cold feet with all those questionable loans out there and started to pull in loans. Once you do that, of course, the money supply contracts. Over the next year, there were a series of serious economic contractions, ending in a severe nationwide depression.
This was the first major boom/bust scenario in the US, the first of many, as another and another happened with regularity every twenty years or so throughout the 1800s.
The creation of the Federal Reserve, the story of which is covered extremely well in, “The Creature from Jekyll Island,” was supposed to end all that, but within the first twenty years of operation, they helped create the next depression of 1929. This time, they decided to inflate the money supply to help the Bank of England recover from a very weak reserve position. The idea was that if the US lowered interest rates, investment would seek the higher British rates and gold would start to flow in that direction. They were right, of course, but the lower interest rates (almost free money again) increased speculation in the US, raising the prices of assets and fueling the stock market mania, which eventually led to a crash, huge credit contraction, and depression.
Well, here we go again in 2017, two hundred years later.
For all those who keep talking about hyperinflation, you’ll have to wait. The first order of the day is spiralling deflation. It always has been. Every time we inflate and cause a loss of confidence, people stop borrowing, banks restrict credit, businesses falter, and on and on. There will be no stopping it. In fact, to pay down loans at this point contracts the money supply even more (it takes money out of circulation). There is simply no escape.
A major deflationary spiral is the direction the economy is going to take this year and it will become even more obvious early in the year. Cash is king; investments are dead.
All over the world, major indices are rising to their tops in tandem. When they turn, they will all come down together. There will be no escape from yet another central bank ponzi scheme.
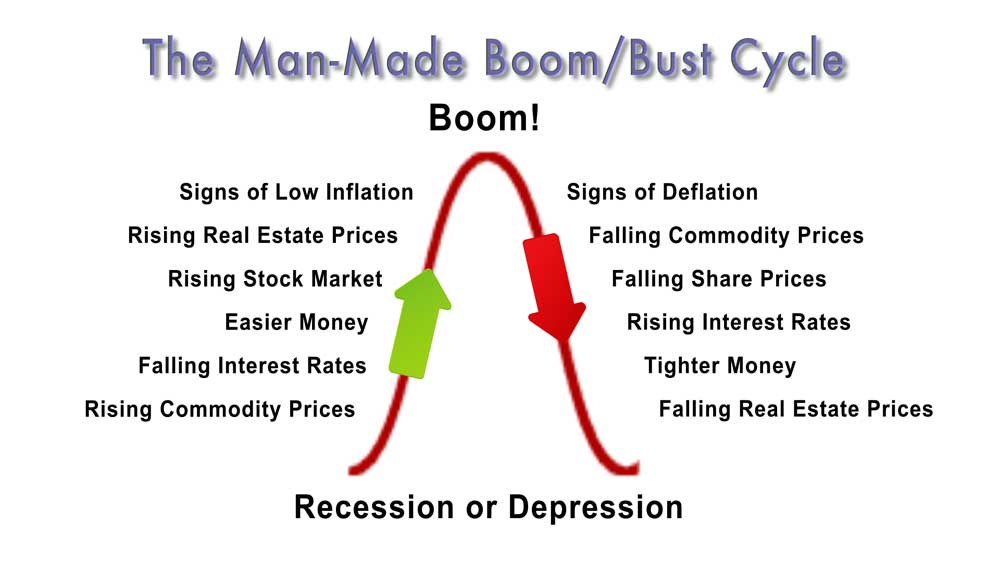
Above is the typical man-made cycle that historically runs over about 20 years, based on a fractional-reserve banking system. We’re at the top of the boom just about the head down.
There are other things to watch during this year.
The Great American Eclipse (a total eclipse of the Sun) is coming on August 21, 2016. It will affect America’s chart as well as Donald Trump’s. It will likely be negative in both cases. But it’s even worse for Melania Trump (in her astrological chart). This will be a date to watch.
Finance and Markets
Stock prices will drop more than 30 percent in 2017. There will be much more to come in 2018, or course. I’m expecting the bottom in 2021/2. We should eventually drop 90%.
Real estate values will drop at least 25 percent in 2017. We should see the top of the latest bubble early in the first quarter of the year. I expect real estate to drop to about 20% of its value at the height.
States, provinces, cities, and countries will default on bonds. We’ve already seen the start. There’s much more to come this year.
International bank runs will begin. Italy is on the verge of one, with Monte Paschi in dire straits. France may very well run into a financial road block before the year is out.
At least one major European country will default. Who’s first-Italy? It’s a bit of a horse race. The euro will also come to an end in the next couple of years, with additional European countries reverting back to their own currencies.
The Federal Reserve will be abolished or nationalized. This projection may not come to fruition this year, but the process will begin and eventually it will be dissolved one way or another. In Canada, we have an active law suit one step away from the Supreme Court, that if successful, will force the national government to return to using our own public central bank (The Bank of Canada) to create our money, as we did before 1974.
Deflation will start its spiral. Where I live, in Calgary, Alberta, where we’ve been hit so hard by the drop in oil, we’re already seeing signs of deflation. You don’t have to be very sensitive to this phenomenon to notice the extraordinary mark-downs in products and services in countries all over the world.
Governments will restrict trade. We’re starting to see free trade agreements falter. There will be no new ones signed and, in fact, we’re likely to see the end of NAFTA. Also look for tariffs to be put in place by the Trump administration, the start of an all-out trade war.
Numerous new buildings will remain unfinished in the midst of construction. These cycles tops always see a plethora of buildings being erected. In fact, you can predict a top when you see buildings reach new heights, as we’ve see in places like Dubai. Commercial real estate is going to be hit particularly hard this year (look out Trump International!).
Politics
More populist leaders will come into power. European countries will continue the trend. I expect to see Angel Merkel say good-by to public life this year.
The President’s and Prime Minister’s (Canada) popularity will drop substantially. Both will be heavily side-lined by the devastating drop in the stock markets of both countries.
US will devolve into a civil war (likely not ’til 2018). The Soros camp is hard at work in the aftermath of the election stirring up trouble. Hillary Clinton’s astrological chart shows an inclination for revenge, which won’t be much of a surprise for most of us.
Some US states will develop legislation to secede. Some states will likely divide into smaller states over the coming few years.
The United Nations will start to become defunded (eventually will cease to exist). President-elect Donald Trump is none too happy with the performance of the UN. Neither is Rodrigo Duterte of the Philippines. And then there’s Bibi Netanyahu … Look for more leaders to start to question its existence this year. Note that they were also the instigators of the Climate Change scam. We may see a major reversal on that front this year, as well.
Some international travel will be restricted. I expect to see a lot more danger areas spring up around the world. This turn down of this major cycle puts an end to international wars, but internal civil wars will continue to crop up, making travel much more difficult. Airlines will also start to default this year and prices for air travel will begin to rise.
More and more corruption will be uncovered. I know that’s difficult to imagine; however, this cycle is more about the uncovering and prosecuting of corruption rather than the instigating of it. We’re going to see some wall-streeters heading for a fight with the government finally.
Social Trends
Homelessness will increase. That goes without saying, but it will become an overwhelming problem over the next couple of years.
The shift to alternative news sources will pick up steam (more newspaper bankruptcies). Fake news is the latest salvo in that regard. Now we have Donald Trump completely side-stepping mainstream media with his tweets. The major news networks in the US now have more minutes of advertising in their half hour nightly new programs than they have news time. Television news has become info-tainment and there is very little, if any, investigative reporting any more. We’ll start to see viewers turn away from these sources and get more of their news from alternative sources online. Look for at least one major news outlet to go bankrupt.
Marijuana will continue to be legalized. Canada should see legalization in 2017. More states in the US will go legal. We’ve known this for years. Governments need the money.
Major violence will increase in the US and murders will rise. Unfortunately, 2016 was the tip of the iceberg.
Horror films will rule the box office. Dark entertainment will start to pop up and make money across multiple genre.
Major sports teams till fold. The incongruity is that major sports facilities continue to be built. We’ll see some of the newer ones remain empty.
The suicide rate will increase. We’ve seen our suicide rate in Calgary increase by 30% over the past year. Twenty percent of the office space in our downtown core is now empty. Most of the affected are younger—people who have never learned to fail. This, to me, is perhaps the most difficult aspect of the coming downturn.
It’s going to be quite a year.
___________________________
Projection for a Top
Based on the ending diagonal we’re currently in (which is the pattern playing out in all the major US indices), I’m still projecting a final top to our five hundred year set of Supercycle waves very early in the New Year. It will take a topping of the third wave of the ending diagonal to give a more accurate prediction of the date, as the fourth and fifth waves should take longer than the third wave by at least three quarters. The third wave up has taken 8 weeks so far.
NEXT Federal Reserve Annct: February 1, 2pm EST
______________________________
Mini-Brexit: Here’s the latest daily chart of ES (emini futures):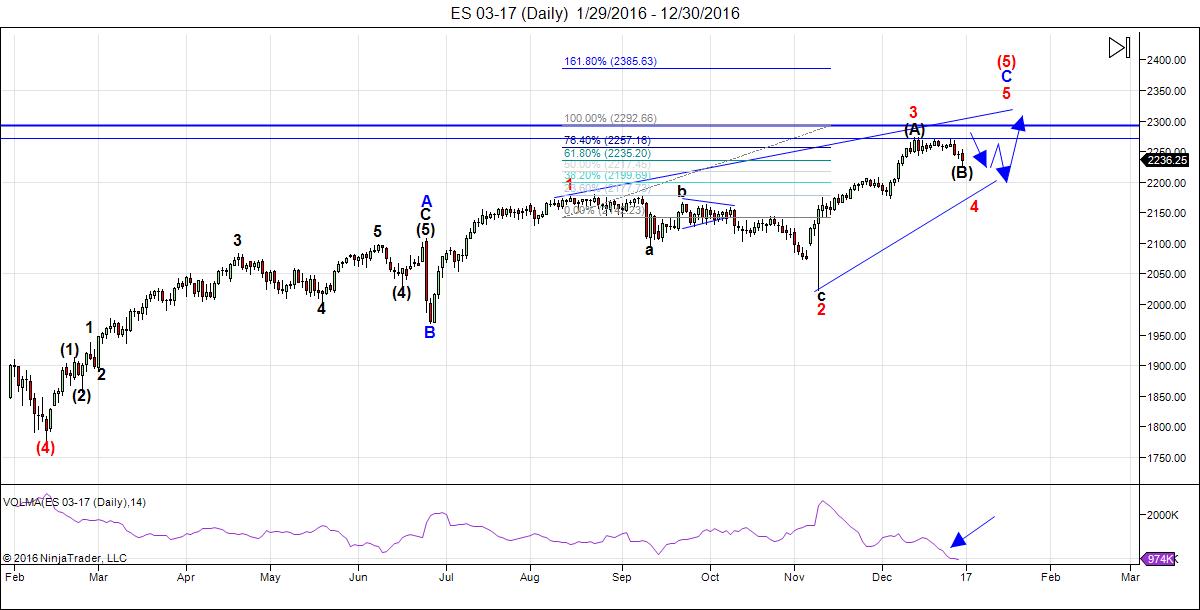
We’re still heading up. On Friday, December 30, 2016, ES traced out the end of an expanded flat (a 3-3-5 configuration) and then an ending diagonal at the tail end of that. It was a dramatic end to a B wave that should give us a dramatic turn to a new high. We have yet to complete the third wave of the ending diagonal.
Through fibonacci ratios, I’m projecting a possible top for the third wave of the ending diagonal for ES of 2294. By extension, it projects a top for the third wave for the SP500 of about 2296.
Note the extreme drop-off in volume for this wave (it’s the purple indicator line at the bottom of the chart). Volume is almost none existent. It should surge in the fourth wave down and we should get a volume surge during the first part of the fifth wave.
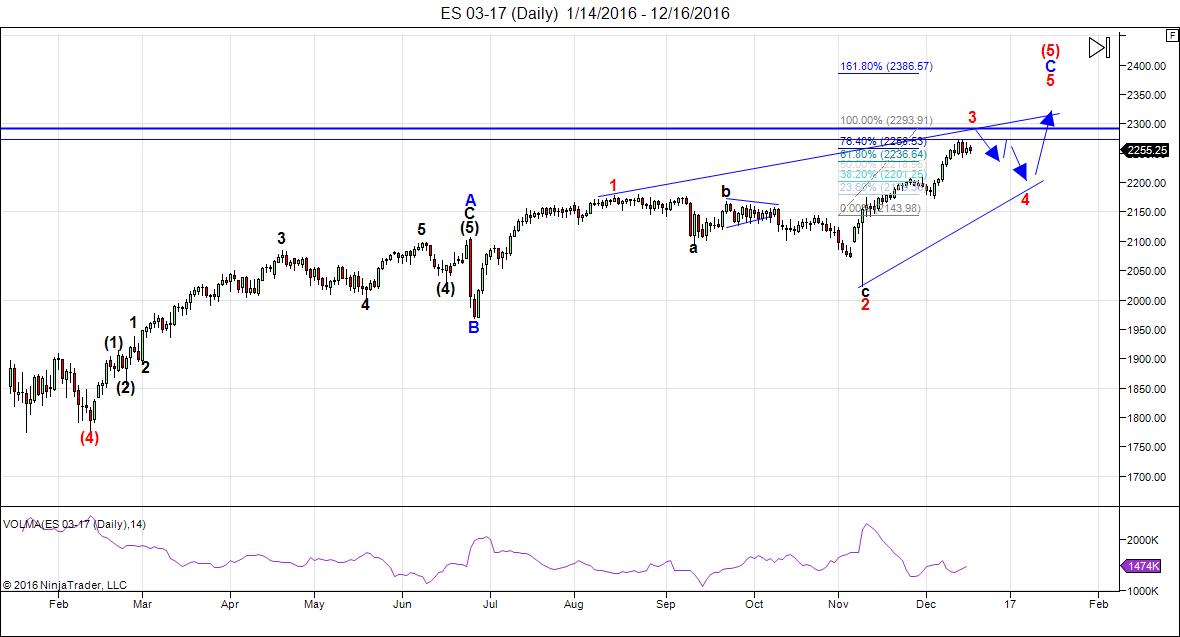
Here are the rules going forward:
- Wave 3 must be shorter than wave 1 and reach a new high.
- Wave 5 must be shorter than wave 3 and reach a new high (usually it does a “throw-over”—extends above the upper trendline defined by the tops of wave 1 and 3, but it is not necessary.
- Wave 4 must be shorter than wave 2 and must drop into the area of wave 1.
- All waves must be in 3’s (zigzags).
- The trendlines of the ending diagonal must converge.
Summary: We’re completing the third wave of the ending diagonal before zigzagging to the top of the largest bubble in history. I expect a sharp drop in wave four of the ending diagonal perhaps later this week. The long awaited bear market is getting closer.
Good trading!
___________________________
Sign up for: The Chart Show
Thursday, January 5 at 2:00 pm EST (US market time)

The Chart Show is a one hour webinar in which Peter Temple provides the Elliott Wave analysis in real time for the US market, gold, silver, oil, and major USD currency pairs.
Get caught up on the market from an Elliott Wave perspective. You’ll also get Andy Pancholi turn dates for the balance of the current month. There’ll be a Q&A session during and at the end of the webinar and the possibility (depending on time) of taking requests.
All registrants will receive the video playback of the webinar, so even if you miss it, you’ll be sent the full video replay within about an hour of its conclusion. For more information and to sign up, click here.


superb!
Say no more, say no more! (as Eric Idle and the other Pythoners used to say …)
🙂
Peter, I have not always agreed with you over the last 2 years with the direction of the markets. Your above update certainly is in alignment with what I see shortly down the road.
In Vancouver/ Canada we hit a major high in April with our real estate prices. If you by pass the manipulated figures from the Vancouver real estate board, you will find out that we have had a 20% correction in detached homes already. The town houses and condoes seem to defy gravity. Our provincial government has just announced a grant for first time borrowers of 37,000 interest free for the next five years. The first time home buyers are going to be like sheep going to the slaughter house shortly. I read a report out of Calgary, their is a huge spike up in people giving away their dogs and cats to the spca. That alone, certainly gives a good indication on how the local economy is doing.
Yeah, I’ve been watching Vancouver. Governments always do the wrong thing at the right or wrong time (depending on your perspective). You’re right about Calgary and the SPCA. We also got our energy tax grab in yesterday. We have a premier who is a complete idiot, but that’s likely not a surprise – it will cost the average family $350 a year more and will do nothing.
Farm from a box. Brilliant.
]https://www.youtube.com/watch?v=VlcijvWRJGU
At the 1929 high Venus HC Lattitude was -0.62153. Br 2a translates this to 0.95019.
This is very sensitive degree. 1/8 we will hit this. So this is a major date.
The 1932 low came at -1.94776, Substract hthis from the 1929 value and we get 1.32623. This is also a sensitive degree. And we will get there 1/29.
The 8/24/15- 11/3/15 was a major cycle. This cycle gives a sensitive degree at .65769. This will come 1/11.
This is just HC venus Lattitude. But these rules work.
2 basic rules : use significant turns and you may use the positive and negative value. For major turns the degrees stay sensitive forever.
P.s. will redo this analysis. The rules work but I used gc latt. Please ignore above.
Now with hc latt.
1/8 is br 2 1929. (was 0,95019 so -0,95019 is also sensitive.
1/11 we have the august 15- nov 15 cycle.
The 1929-1932 cycle gives a diffrence of 1.32, this hits 3/4. This will be a high.
1929 br2a will hit again 1/27. The 2007-2009 decline gives 2/1. So 1/27 till 2/1 will be a significant cit.
typo 3/4 =2/1.
So 2 cycles give this date.
Andre’,
Could you please explain “br 2 1929” posted above?
Also, could you explain “1929 br2a will hit again 1/27”?
I do not know enough about what you do …to understand!
Ed,
Bayer rule 2a deals with HC Venus lattitude. At important turns we take note of HC Venus lattitude. This number is recalculated in a new number. This is now a sensitive degree.
http://trading-nuskhe.blogspot.nl/2015/09/george-bayer-rule-no-2a-or-venus.html
Another way to use this is to combine it with Gann. Gann said that we should look at astro at important turns. Once this astro appears again we can expect a change in trend.
As it happens, 1/11 has the same latt as 1929. This is not a bayer rule. The 1974 low gave -0,2 and 1/20 gives +0,2; hence a low.
Thank you Peter for all your generous market comments week after week !
FWIW i believe we will not top before mid-year after forming a huge ending diagonal from the February 2016 Low. “IF” we break last friday’s lows in the next couple of days, It will confirm we only have started the Wave B down of an ABCDE ending diagonal. Wave A would have completed mid december into a wave a from last february to mid august, wave b from mid august into early November (better seen on the futures chart with the overnight collapse on election day) and wave c into mid-december. If this is the case and we do break last fridays lows this week, Wave B will probably test the election day futures lows in Feb/March before we explode upwards in Wave C of the ending diagonal. Time will tell. Comments are welcome always.. Thank you
Peter
I really like to look at your cycle work from time to time and I am a subscriber. Your chart about real estate could use an update. It currently shows the top in 2007. It has since made new highs. Is it a double top? Anyway, just wondering if you plan on updating it. I would like to see what it looks like now.
Mark
I have to do that for a talk I’m giving in a few weeks so I’ll remember to post it. It won’t change much. I expected another move upwards, but wasn’t sure about a new high. The Canadian index had a low about the year 2000, and I was expecting the two (US & CAD) to eventually get into sync. This is a good reminder to post it. Thanks.
Peter,
Thanks for the post..
So you are calling for B to be done and now we are in C of W(3).
You are saying we will make a new high before 2233.62 is broken to the downside.
What would you say if we do not break 2277 and do in fact do go lower than 2233?
Thx..j
Yup, a new high. We may not break 2277 in ES. A new high is at 2273 and that’s all we need. If we go lower before then, then it’s time to retire EW, but I doubt that’s going to happen. In fact the fib tool tells me we will just make a new high. This is threatening 5 waves up as I’ve predicted elsewhere.
It’s hard to argue with 3 waves down, a flat, and an ending diagonal all at one time.
Peter-
I have question on the rule to help me visualize what you are suggesting. Does the end of wave 3 need to be high enough so that the top of Wave A of 3 does not exceed the trendline connecting wave 1 and wave 3? the picture i keep drawing with the target you are suggesting seems to mean that is happening.
Thanks again for all your information!
Hi Ted,
The larger rule is that all major waves in an ending diagonal have to be in zigzags. A zigzag is a 5-3-5 combination. We started down in 3 waves, so that doesn’t work. So we’re doing it over until we get it right. 🙂
That means we need to get to a new high to “zero out” that count. Plus an expanded flat gets fully retraced. Plus the ending diagonal, which is an ending wave. In fact, if you go to a 60 minute chart of ES, you’ll see that the very first wave down from 2273 or so to about 2243 was in 3 waves, never mind the entire pattern down. So it was clear from the very start (to me) that we weren’t in the larger wave 4.
Was referred to this site a few months ago. There are hundreds of cycle sites that are basically useless guesses that are always changing (like EW) , but I find Peter’s work interesting. Even though he has moved his top back several months already. I am sure that Peter knows that the rest of the world thinks we are in the start of a Primary wave 3 in a Bull market that will take the Dow to above 50k. I am also sure that there are many watching for validation to see if a subscription is worth it. I wish you the best Peter.
Andre’, your work is very interesting but most of us have no clue what you are trying to say. Your projections are not clear as you have so many highs and lows. Are they short, medium, or long term bull or bear bias projections? Are they higher highs and lower lows or lower highs and higher lows? Where exactly in your view is the stock market headed in a swing traders perspective and simple terms as most do not poses the skill level that you do regarding your system. Good luck in your endeavor.
Thanks, Ken. Yup … 50k … and I hope they keep that frame of mind, because somebody has to buy this thing to a top.
Very interesting – looks like the line is drawn then..lol
S&P 2233 must hold.
Ken just so I am clear. I DO NOT think we are in an Ending Diagonal.
Megaphone tops on DJI, Comp, S&P, IWM and FAS fpr me are hard to argue with.
The uptrend is OVER and a break below 2233 will confirm.
In my opinion:)
I’m afraid I don’t mix non EW patterns with EW so can’t comment on that.
Broadening Top DJI, Comp, S&P, IWM and FAS.
E wave now complete on all 5 = 2233 does not hold..
Hi Peter
Your forecast has me asking a few questions which i’ve thought
of for a long time .
demographics in the united states are deflationary .
Shrinking of the money supply is deflationary .
going cashless though concerns me
Bitcoin makes no sense to me as it is a digital currency of sorts
anything online can just disappear with a key stroke .
computers can go down or we can be told the computers are down
Food can be the ultimate form of money in a worst case scenario.
My thoughts on trump
i call it poetic
Trump has a history of putting out best sellers
at the top of the cycle and ending up in bankruptcy
court at the bottom of the cycle.
Trump winning the election ill call the best seller
Trump taking the united states through bankruptcy
would be poetic.
If he were to do so the united states economy would
recover .
Ben Bernanke was the right guy at the right time.
helicopter money .
Trump i m not so sure about yet were going to find out
Your august 21 2017 solar eclipse date fits very well
in my work .
When i talk to people around here i notice a few things.
On new years i went out with a few friends and i was
talking out loud and noticed another guy nodding his head
from across the bar agreeing with me .
i have made similar comments and had similar reply’s
my point is, i live in a predominant democratic state
yet i do not see people with that view, prior to the election
i was driving around and i was surprised to see more
trump signs then Hillary.
I feel as though our society has become gender neutral
so to speak . men claim to be born as women and have sex changes
we no longer have a traditional model and instead it is an anything
you want is OK type thing. many years ago men were told they need
to find their feminine side. It looks to me like everything is messed up.
I do think though women are becoming more and more empowered
which is a good thing yet as proven by this last election women are
not going to vote a woman in office just because…….
Armstrong is correct when he says everything fits together.
The next civil war is probably going to include all of it .
Joe
Daily dow chart appears to be a head and shoulders top formation
todays bounce would be a B wave high or a wave 2 of sorts.
Breaking last weeks lows targets 19479.69 on cash dow
wave A times 1.618 added to todays high ( subtracted )
targets 19503.33
Nov 4th low to the dec 20 high .
.236 retrace = 19491.06
all 3 averaged
19479.69
19503.33
19491.06
————–
Average =19491.36
19410 still stands as my number yet the numbers above
is all im seeing at this moment
Joe
Dow daily chart
Wave A Dec 20 To Dec 30 =7 Trade days Down .
Wave A Dec 20 To Dec 30 = 10 calendar Days Down.
Dec 30 To Jan 3 = a 4 calendar day bounce (40 % time retrace )
Dec 30 To Jan 3 = 1 Trade day Bounce .
Adding 7 Trade days down from today’s high
targets Jan 12th .
Adding 10 calendar days to today targets
Jan 13th
10 calendar * 1.618 = 16-17 calendar days .
that would target Jan 20th .
if this is true then we are now into a wave C of sorts
$NYA
High Dec 13th
Low Dec 30
17 calendar days high to low
obvious jan 3 plus 17 is jan 20th where wave
C will equal A in terms of time .
NYA had 12 trade days down .
Adding 12 trade days targets Jan 19th
This would be a High to Low to Low count .
NYA Has always been a good index for timing purposes
and since this does all fit ( nothing ever perfect )
I must conclude by accepting we are in a downtrend
into jan 20th .
My Intent is to begin Buying stocks on Jan 20th
and adding to them surrounding the feb 8th-11th
time frame .
Looking for an upside bias into 1St week of July at a minimum
2nd 3rd week of August as a maximum .
May 19th should be some type of Low
The may 19th Low should be Much higher than
the lows we are presently seeing .
Joe
Nicely laid out Joe.I hope your plan works out for you. All the best.
Thanks Dave
I can make out a bullish case based on today’s market action
yet the march dow futures failed to break above the 19900 level this morning
which leaves me with a continuation of this decline.
I don’t mind being wrong ( i can handle it ) but i prefer a solid set up
at this moment i m not seeing it .
My Upside targets out way my downside targets .
Longer term i remain bullish . Just looking for a good entry
Jan 20th as well as feb 8th 11th are my main key dates
May 19th secondary yet its another key point
then its mid july as well as august for a high .
the rest of the dates to me are noise .
wait and see .
My work schedule makes it difficult at times to speculate
using futures or options .
Joe
Joe, I am sure you will be crystal clear after mercury retrograde has finished up. Goes direct Jan 8th. We will still be in the shadow of mercury for another 2 to 3 three weeks thou.
Today should be a one day wonder,Wednesday the decline will start and things will get ugly next week.
My bottom date is Jan 16.
Good luck all.
On a 60 minute chart of the S&P we can clearly see the triangle that we were in from 12-13-16 to 12-28-16 when it broke to the downside on the 11:30am candle. S&P usually always when it breaks a triangle comes back to check the trend line that defined the triangle whether it be a break out or break down.
Today almost to the tick it did just that. Tomorrow if we get above today’s high then it would improve the odds for more room to run however a break below today’s low 2245.13 will see selling pick up.
My hunch is we see a 5% rise in US Tech stocks over the next three weeks. Based upon PALS and likely Trump Effect which will be most pronounced into inauguration.
Now that the Seasonal induced ‘fog’ is lifting I have one question please.
Looking at the ES chart above it would appear that the ‘a’ of red 3 of C is already longer than the red 1 (since the late July high) in total…..but isn’t it supposed to be shorter than red 1?
I ask this with trepidation, because it is possible that I am not still fully compos mentis.
Buying back my 1/3 batch short. 2261. Good luck every one.
Sorry for the double post. My I pad did not seem to want to post at first.
It’s not you. Every so often, Wordpress seems to “hang up” the occasional comment or two until I manually release them … not sure why.
I think it was the Russians, who are trying to sabotage the site ! LOLOL
Bought back my 1/3 short I sold late last week. 2261 Fully short with my short term trading account. Long term account in cash. Good luck every one.
NYA looks like its leading the market higher
Record $59.9 billion pumped into U.S. #equity #ETFs in December, smashing previous record of $50.7 billion in November. #stocks
That info was from Trim Tabs
This wont make sense yet the market is oversold despite the bounce.
5 day trin closed yesterday at 6.21
in bull markets the 5 day trin sum at 6 is an oversold reading
in bear market moves a 5 day sum of 9 is more the norm.
the trin sitting at 1.09 right now and if the trin was to close
at that level today the 5 day sum would become 6.67
which implies a more oversold reading .
the 10 day simple moving average of the daily trin
normally has an oversold reading at 1.40
it is at 1.19 , it closed at 1.23 on dec 30th and has turned slightly down
which is a bullish signal .
the 5 day advance decline line is into an overbought reading yet the
10 day advance decline line is not yet overbought .
the 10 day advance decline line peaked back in july of 2016
even this trump rally has failed to bring it up to its typical
short term high readings .
mixed market .
i got stopped into a long position in the overnight session
last night , just moved my stop up .
not the norm for me to take a position in the opposite
direction of what i m thinking yet i did.
if the dow can close the week at or above
19933.82 it would be a new all time weekly closing high .
and its stalled .
the week of june 27 2016 is now where im calling the starting
point of this upwards phase .
week of dec 1 2014 top of wave 3
week of june 27 2016 end point of wave 4
wave 1 ended week of july 18 2016
wave 2 ended week of oct 31 2016
wave 3 this leg up from nov 2016 is seriously flawed as of today
and how it resolves itself i don’t know .
This rally over the past few days counts better as a corrective bounce
the Dow has support near 19410 .
I have no firm opinion on this market and the mixed signals
imply more confusion to come .
overbought advance decline line and an oversold trin .
its a 50 50 call .
Joe
more odd stuff to consider
i have mentioned the 2.2 and 3.2 extensions.
i discovered those extensions by looking at the 1929
and 1987 crashes .
you can look at the recent decline on the nasdaq dow as well as spx
and see . once the 2.2 extension is broken you look for the 3.2
yet , the 2.2 extension becomes the pivot . on the spx that level
is 2247.70 ES H7.
yet im looking at this on the dow monthly and using it as a retrace
which i have not researched in depth .
the jan 2000 high to the march 2009 low using the 2.2 retrace
marked 18086 <— that was a resistance level for 2015 on a monthly
closing basis , using the 3.2 as the next resistance you get 23367
now here is the odd thing .
taking the 2007 high to the march 2009 low and using the 2.2 retrace
you get 23471
hence the 23367-23471 range on the dow should become a stiff
level of resistance .
you can take any bearish move and those 2.2 and 3.2 extensions
will show up . the 2.2 being almost a no brainier the 3.2 not always .
The 2.2 retrace or 3.2 retrace i have not researched enough to
give any weighting to it .
emini spx ES H7 support is 2247.70
Yes Joe, this market is completely BROKEN. The ‘internals’ have not matched up to the ‘end result’ for a very looooong time. But as they say ‘price is KING’ (more likely KONG) so we have to live with what we have.
Maybe the next set of ‘trading text books’ will work with these broken markets and provide some insight.
I also follow Chris Carolan,
His solunar en tidalwave model both have a top on Jan 6.
You can read his link:
http://spiralcalendar.com/2016/12/watching-waiting/#more-11245
Dow futures fail again at the 19900 level.
5.3 to 1 on the advance decline line today.
looks bullish
im flat .
ill look at it in the overnight session
This would be 4th time in this bull mkt (since ’09) that $VIX ⬇️ 5% back-to-back and < 13. Next 30 days, it spiked 45%, 226%, 84%. Info is from Sentiment trader.
I can feel it, taste it, smell it, hear it. LOL We are in for interesting times shortly.
Investors Intelligence Poll
Bulls: 60,2%
Bears: 18,4%
The signal?
https://www.linkedin.com/pulse/rare-signal-says-bull-market-over-michael-valletutti
Fingers crossed..
Thks John. Interesting.
Just for fun I replicated Carolan’s solunar model using degrees in the sun-moon elongation. 19 years = 235 lunations or 19 times 360 degrees.
Looking back this way we see a high 1/5/1998 and 1/5/1960. We also see a high 1/10/41 and a high 1/15-1979.
The average would be 5+5+10+15=35/4=9. The high tides give a low value 1/9. This should be a high.
Bayer’s rule 36 gives 1/9 and 1/20. Rule 17 gives 1/29. Rule 14 gives a high 1/31,
Think the turn wil come Monday.
The lows in this delta system will come 1/19/1979, 1/20/1960, 1/21/1941.
1998 seems to give inversions; a low 1/9 and a high 1/20. This will be a high 9 and a low 20, See how we have a range for 19-21 ?
typo; 19 years =235 times 360
Thanks Andre,
My gut feelings says,when mercury goes direct Jan 8 we will turn sharpley,the dollar/index will fall..
Good luck..
John,
Think you are right 😉
John, just an observation…..
If the dollar falls then surely the rest of the Stock Market goes up.
Perhaps you are describing some ‘other’ index….in which case I apologise in advance.
Hey Purvez,
I missed your comment sorry,
What I meant is the US/Dollar index:
https://nl.investing.com/quotes/us-dollar-index.
I think this Friday or Monday at the latest the markets will sell off.
If not I will sell my shorts.
Regards
John.
Both Jack Gillen and Olga Morales claim there is a 4 year lunar cycle. In my system this is a 50 lunations cycle or 50 times 360. This is a few days more than 4 years but close enough.
4 and 17 cycles give a high 1/8. 2 and 11 cycles give a high 1/11. 8 and 12 gave a high and a low 1/4; exactly what happened.
Have some more work to do on this.
Andre, you certainly are a visionary Mathematical genius with your calculations. I do not always fully understand your methods. But I certainly appreciate your efforts in communicating your thoughts and ideas.
This is what Gann wrote:
The following dates indicate times when stocks will be very active and have wide fluctuations, making tops and bottoms. While all stocks will not make tops and bottoms around these dates, some of the most active ones will and if you watch the ones that turn around these dates, it will prove helpful in your trading:
January 5th to 7th, 12th to 15th, 18th to 24th
well Dave
whether the bull market is over or not remains to be seen
yet i do not see any reason to have a bullish bias short term.
id say Jan 20th as well as Feb 8th 11th .
if the Dow breaks the Dec 30 lows which it looks like it will
at the least test them things will get very interesting to say the least.
NYA made a new high today and if you include yesterdays 5.1
advance decline line and those buyers sell ? we end up with a market
that gets pumped to the downside .
As for me ? no spec trades yet if i was going to id be short on today’s
break .
From Dec 11 to today the pattern does not look good at all .
Joe
Joe, I agree with you on questioning whether the bull market is dead or not. Certainly for the short term, we are going to have some kind of correction. For the future, I want to always have a open mind and not get locked into being a bear or Bull. In other words, to be a multidimensional trader with the flexibility in my approach when investing. I still have Martin Armstrongs phase transition in the back of my mind. Bottom line , be opened minded to other possibilities that Mr Market may have. Best of luck to you Joe.
Dave, allow me to burst , perhaps a very sacred bubble, but all Martin Armstrong is really saying is that ‘anything’ is possible. i.e. literal interpretation….’I don’t know’.
Trading is a personal business. Your gains / losses are YOURS not anyone else’s ‘suggestions’. If you don’t have a ‘reason’ for putting on a particular trade….other than because ‘someone else said so’ then I strongly believe you are in for some serious pain.
SURE listen to ‘many’ but the decision to trade is ONLY EVER YOURS.
You are not the bursting my bubble. LOL If Armstrongs scenario comes into play and my own unique indicators line up, I will certainly jump on board. I do not give a way my power to NO ONE ! I am my own man when it comes to triggering my own trades. All the best to you purvez
Very VERY glad to hear that Dave. ALL THE BEST TO YOU in trading and all things else.
I know that what I’m going to say, I don’t provide any proof of today…..but I will tomorrow, hopefully.
I think today’s down wave is the start of a ‘c’ wave of ‘some degree’ (god knows which one) which will definitely take us below the 30th Dec low on the DJIA.
As I write we are approaching the 61.8% retracement of this down wave from around 19950 today….so that would be the wave 2 of whatever degree.
Next comes the 3rd wave down which I believe may break the 30th Dec low or if not then the 5th wave of that down wave will.
However I want to emphasise that this count does not invalidate our host’s ED as the ED no longer applies to the DJIA but would do for the ES and S&P 500
Almanacist @UKAlmanac · 2h2 hours ago
The 4th trading day in the new year (i.e. tomorrow) tends to fall on the day, and is the start of 2 weeks of weakness for the #FTSE100
Bought SPY 224 puts after hours. Purely gamble on my part.
Nice play LizH, I would call it a calculated gamble rather than a pure gamble.LOL Based on the next 2 weeks, I am sure you will be happy.
All the best.
Thanks Dave. We’ll see. I was inspired by this headline: http://www.zerohedge.com/news/2017-01-05/gartman-covers-his-market-short-goes-long 🙂
Nice find LizH. Being contrarian, doing the opposite. That is one of my top indicators when investing.
Peter
it rarely snows down here in southern Oregon and when it does
it usually stays for the night and melts the next day .
we have had snow on the ground for 3 days now .
Nothing extreme yet its showing the change .
colder lately then the usual to yet again nothing extreme.
the signs of cooling though are obvious .
In Calgary, we’ve already had one 2 week period of -20° C and we have another 10 days coming (by the looks of it – can only see that far ahead) starting Saturday. I’m talking highs during the day. It will get down to -32 next Wednesday night. Haven’t had that kind of cold for quite a few years.
More snow than we had all last year.
My issue with this market is the lack of volatility despite Dow
19000 , Jan 20th is where the mars Uranus pair calls a low
the feb 8th-11th dates are based on the year 1957.
im seeing similarities with 1937 1957 and 1987 which is odd
The mindset of the market is bullish and it appears people waiting
for trump to get into office . i have never in my life considered politics
into trading not to mention have i ever seen a political party try so hard
to cripple a candidate. Obama has thrown Israel under the bus and is doing
his best to put the united states at war with Russia.
Teachers are trying to force their opinions on the students .
last year in a leadership course we were being taught that to be a good leader
you must be a good follower . i get that but….. people need the freedom to think
and what i see going on just amazes me .
according to Armstrong if he is correct and he is not always right , first its
the EU which we are seeing then its japan which we are not seeing yet .
then its the usa . the rising dollar will kill corporate earnings which is the key.
as money seeks a safe haven around the world it will go to the united states
and drive stock prices higher.
i find it odd when i look at the 1929 dow in terms of price .
183 and the break out to 196 , similar to 18300 to 19600.
1987 a similar theme .
Bear markets as well as corrections will at times where you down
and then prices move and don’t look back .
i no longer think Dow 20,000 is such a big deal when the market finally
does move it will just go through it as the Dow plays catch up to some other
index .
another thing that bugs me is the bad tick on the NYA the other day
and its strength since DEC 30 .
i try to connect the dots as best i can yet at times those dots do not correlate
and just when i finally throw in the towel ? reversal and boom .
same thing can be said for the bearish moves .
I always ask what if i m wrong and try to look at both sides of the market .
what i have been asking this year is why has my timing model been so wrong?
it has called for a jan 20th low and that date may prove correct yet it called
for an early august high and since it was based on the Dow i have issues with that . i don’t ever throw out tools that have a history of being correct .
my timing model is usually 85% in a year . well now its more like 85% wrong.
lol 🙂
Today i have accepted that what ever it is that’s going on hinges on
Jan 20th and the Feb 8th-11th time frame. I have also accepted that i have
come into this year with pre conceived ideas which i ask my self
if this then that .
im waiting for the IF to play itself out
Joe
Last weekend I told you about the equilibrium date on Stoxx 600 and how that would cause a flat market. This ends 1/7, what is also a Gann date.
Gann gives natural turndates 1/6 and 1/20. BR36 gives 1/9 and 1/20.
Big moves come when all markets want down. Next week Europe wants down. And this is also the solunar timing, the mercury direct and all the other reasons we have. 1/20 will be a low. 1/11 may likely be a low to cause the ABC move. So Monday high, Wedensday low and up into 13-15. Then a third leg down.
1/31 will be a high. Will it be a higher high? Still thinking about this. March 2017 will be 17 years from the 2000 high; very significant.
Something is brewing; that is certain.
Yesterday I said I would post some evidence for my call that we started a ‘c’ wave of some degree yesterday. Well here is my count from the 20th Dec ATH in the DJIA including out of hours trading:
https://postimg.org/image/slalatxc7/
Hmmm the bottom right hand bit got squigged up but it should read:
(v)=c=C
with the middle ‘c’ being in green.
Thanks Purvez,
The black line should leave your paper down under…… next week lolol..
Hahaha!! We wish!!
Weeeeeelllll!!! That 3rd wave of the ‘c’ wave took a U-Bend I guess.
Our ‘wishes’ haven’t come true….yet.
Hi Peter
I updated my sunspot data .
sunspots on a 90 day average are still following the dalton minimum
very closely .
http://imgur.com/ehllE8S
Vedic astro gives us the Vishu, durmukhi and Akshaya cycles. or 15/30 and 60 lunar years.
Durmukhi and Akshaya give a low 1/11. Vishu gives a high 1/14 and a low 1/19. Vishu and akshaya give a low 2/9.
This is very different from the solunar model, So when we see confluence the signal becomes stronger. Solunar gives a high 1/15 (see above), Vishu 1/14,
20 times the 50/360 cycle is 1000 lunations. This is a numerology cycle as 1 is unity, This cycle gives a low 1/19.
Upagrahas gives a Mars Vyatipaata 1/9, a Saturn Upaketu 1/11, a Venus Vyatipaata 1/14 and a nodal Parivesha 1/21. 1/31 a Saturn indrachaapa.
Again; very different system but these dates are unavoidable.
Tidal inversions.
The high tides give inversions 7-10, 15/16 and 23. Low tides give 7/15/21-22.
Pretty much in lign with the above. And confirmed by Gann timing.
Thanks Andre,
Next week fireworks..
The sine function on the venus/Saturn cycle gives a 3-4 day timing. Dates : 12/30, 1/3, 1/6, 1/9, 1/13, 1/16, 1/20. So 1/9-1/20 is one cycle as a full sine goes from zero to +1 to zero to -1 to zero.
the venus/sat function is natural; so no assumptions needed.
My Jupiter indicator gave the high 8/17 and caused the 8/15 high. But the indicator was above zero. 1/13 the indicator turns negative. This gives credit to the idea the market will test this date. After 1/13/next weekend things will get more volatile.
Jupiter is down into 4/2-3. This is one of the cycles. So I don’t say the low will come early april. The indicator is positive again 6/24. So a low between those dates is likely.
Gann’s great cycle is 144 times 144. This cycle predicts a high 1/14 and a low 2/8.
This cycle confirms my Jupiter cycle.
Changed my strategy
60 point gain on Dow futures for the day
and i m out and flat .
im seeing the 2.2 extension working over and over
not to say it will yet it is lately .
today’s low was a combination of a very short term 3.2
and a short term 2.2 along with several fibonacci
retracements .
March Dow now has 2 support levels
19770 as well as 19800
to give you a view of this ill post the drop in 1937
for perspective.
i see this working on 1 and minute charts lately
todays drop was no different
http://imgur.com/bZwhY6m
Nice trading Joe. What made you decide to go long?
as noted yesterday .
as soon as i thrown in the towel
Boom.
the picture has cleared
New weekly closing high most likely
chart now says higher
no trading , got my 60 pts for the day
have other things to take care of
The third wave of the ending diagonal in ES/SPX has been moving along as predicted, but we’re starting to get near the end of the wave. It may not last past Monday.
learned quite a bit from you during the last year…appreciate your willingness to share…also expecting a change-in-trend to commence Monday…however, a pop may precede the drop…
Thanks and yes, that’s true – still need a final small 5th.
Thank you Peter.
🙂
Still short with my short term trading account. My longer term account, will be deploying funds into options today and Monday. Looking around several sites, every one is getting Giddy at the prospects of Dow 20,000 and beyond. Very soon, it will be called the TRUMP DUMP. Good luck every one.
I just bought spy puts 225. Rolling the dice for the next 2 weeks.
http://www.cnbc.com/2017/01/06/the-biggest-bull-on-wall-street-last-year-just-became-the-most-bearish-strategist-of-2017.html
And then you have Harry Dent who just threw in the towel and became the biggest bull.
For any new traders, I only use no more than 5% of my long term acct for options. If I am wrong in how I see the markets unfolding, It will NOT ADVERSLEY effect my life style. I will have enough in the future to invest in the markets. The reason I bring this up, is that I saw many people wipe out there accounts at the bottom of the markets in 1998 ect trying to go short. All the best every one.
Bulls and Bears make money. PIGS LOSE OUT.
Good advice Dave. Theta burn is deadly.
The last time $SPX closed at an all-time high with more ⬇️than ⬆️stocks & volume and < 4% at 52-week highs was March 24, 2000
From Sentiment trader
Fingers crossed for Monday ,I count on Mercurius nothing happend in the retograde periode,so lets see what happens on monday in the shadow?
Good weekend to all
This link from Raj is also interesting ,
I m following him from a long Time.
He is also looking for a major swing high I don’t no his date but it has to be close,
http://www.safehaven.com/article/43358/raj-t-and-c-2016-year-in-review-and-forecasting-2017
I did the math on his next swing high.. I get 01/23 or 24 .. give a day or 2 either way
Thanks Nicola,
If that comes true we will see a major XXXX high.
Let’s wait and see if Mercury can turn this market by Monday or not?
In the year 2000, the Nasdaq got hit 3 times from the tops.
End days of Mercury retograde in the year 2000, March 10, July 17 and Oktober 18.
Tops Nasdaq:
March 14 after the weekend
July 17 exact.
Oktober 18 exact.
Good luck..
Mercurius retograde in 2000:
Februari 21 – March 14.
First top Nasdaq March 10 second top slightly lower March 24.
PALS next week:
Phase: positive until Full Moon late in week
Distance: negative all week
Declination: positive all week
Seasonals: neutral
Summary: PALS is slightly positive next week.
This website is for educational purposes relating to Elliott Wave, natural cycles, and the Quantum Revolution (Great Awakening). I welcome questions or comments about any of these subjects. Due to a heavy schedule, I may not have the time to answer questions that relate to my area of expertise.
I reserve the right to remove any comment that is deemed negative, is unhelpful, or off-topic. Such comments may be removed.
Want to comment? You need to be logged in to comment. You can register here.