

Two Legs Left
I’m providing the following “summary overview” write-up this week which is very similar to what I provide for my Trader’s Gold members, except for the fact that they get an additional video on the immediate market and a host of daily to hourly (and sometimes in small timeframes) charts that provide high probability direction across US indices, major USD currency pairs, the US Dollar Index, gold, silver, and oil.
There are STILL two “legs” left to this rally from December 26, 2018 across all the major US indices. However, they’re not the same legs I identified last week. In fact, I’d prefer just to call them “waves.” They’re going to be different shapes, depending upon the asset class and asset itself. We’re expecting a trend change towards the end of the coming week.
NOTE: the top we’re going to get here in the US indices is a rare exception to what you would normally expect, and, as such, requires some explanation for anyone interested in Elliott Wave Theory as a “science” (i.e., its integrity as a reliable market predictor). Therefore, I’ve provided a fuller explanation and a video below.
Here’s the shorter story for futures, more specifically, ES.
Both the SP500 are in ending diagonals. In fact, the NYSE is also tracing out an ED, as I showed this past week, as part of a nightly video update. Ending diagonals are ending patterns; they warn of an imminent change in trend.
We’re currently tracing out the fourth wave of an ending diagonal in ES and the SP500.
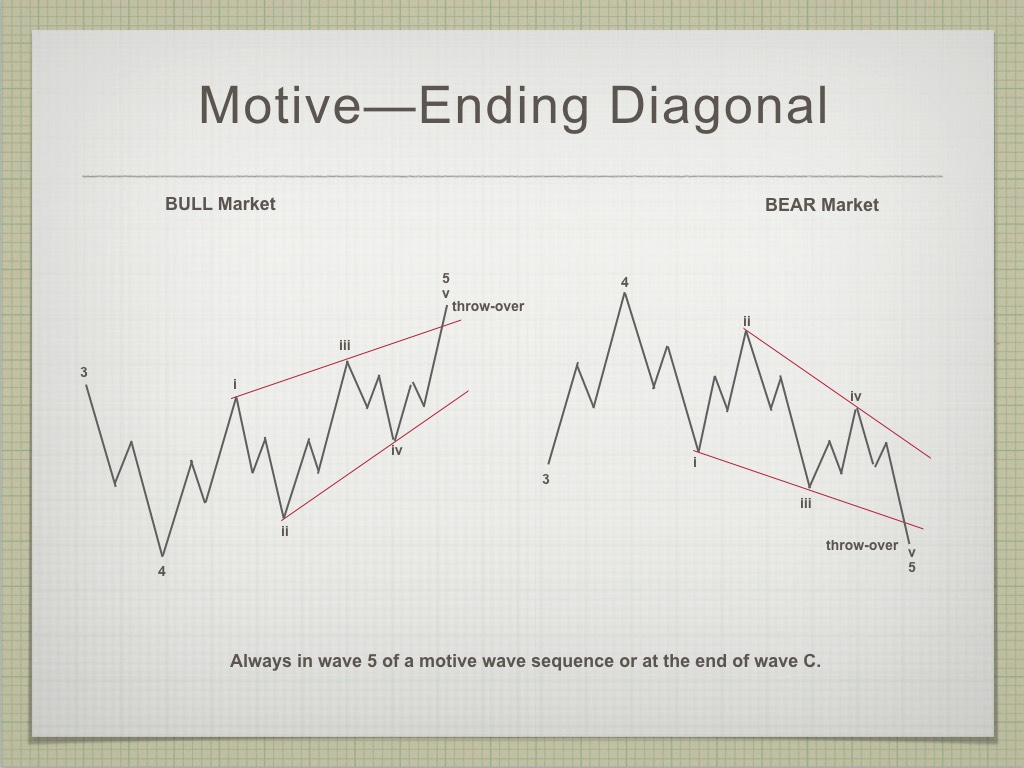
The diagram above shows typical ending diagonal patterns for both bull and bear markets. We’re interested in the pattern on the left (for a bull market).
As of the end of the day on Friday, we began the fourth wave down. It will be in three waves and target the 2995 area in ES. This is the last down wave.
The last up wave will be the final fifth wave of the ending diagonal. The rule in ending diagonals is that the fifth wave cannot be longer than the third wave. To get a projected top price, you measure from the bottom of the fourth wave (which is not in place yet).
The top of the fifth wave of the ending diagonal will mark the end of the trend from December 26 and send the US indices well below the levels they were at at that date.
The US Dollar Index should turn back down with ES/SPX reaching the bottom of the fourth wave. When the US Dollar bottoms at the trendline of the running triangle it’s in, the US indices will have reached their tops.
DAX is at a high and is ready to turn down. I expect that will happen in tandem with the US market turning down.
________________________
Time to Put on Your Shorts!
This market is exhausted. Gaps are routinely being left open and virtually everything is moving to the beat of the US Dollar.
You can also see revolutions starting to break out in countries around the world (Spain, France, Hong Kong, Chile, Ecuador, Haiti, Papua New Guinea, now Iraq, and others). This is not an anomaly; they will continue to crop up and get bigger as time goes on.
Then there are the loss of jobs, bankruptcies, and union strikes that are growing through out the world. The action of governments to these crises usually exacerbates the problem (as in the jailing of politicians from Catalonia for 13 years, or the restricting of imports of black outerwear in Hong Kong by the Chinese government so protesters can’t dress in black — this one is particularly stupid).
Add to that the corruption that continues to be exposed and you have a recipe for a major upheaval. When this market comes down, it will be fuel for the fires that are starting all over the world.
I’m expecting a trend change before the end of the coming week.
How We Got Here; Where We’re Going
The current pattern in the US indices is one for the record books. To my knowledge, it’s never happened before in recorded market history. It’s a perfect storm, if you like in that there are three extraordinary elements that have come together to make this market the most difficult one to stay on top of ever …
- The set of waves up from 2009 in the NYSE-related indices is a corrective B wave. Mr. Elliott believed in them, but Bob Prechter determined that they were not possible. Well, we have one due to the debt injection by central banks – in a sense, it’s an “unnatural wave.”
- We have a HUGE non-confirmation between the NYSE (the exchange) and its sub-indices (the SP500, the DOW, and the Russell 3000). The sub-indices went to new highs above the January 29, 2018 NYSE third wave high.
- We have an expanded flat in the same three sub-indices, the B wave of which is going to mark a major trend change (the top of the third wave). I don’t believe this scenario has ever played out before.
On top of all this, the ending waves on hourly charts are going to end the trend as corrective waves, which is not supposed to happen, except for the fact that this is an extremely rare situation, one that would actually allow for that anomaly.
The explanation of the most recent market action (the last couple of months) is technically complicated and for this reason, I’ve produced a short video to help me explain the new information this current pattern has provided both in case you’re interested in the finer elements of EW Theory, and as a case study that I can include in my book and course.
Lesson Learned: We already know that the B wave of an expanded flat must be corrective (have a “three count). What’s new is that the subwaves ending the B wave of an expanded flat can also be in a three wave pattern (contrary to the normal requirements that trends end in 5 waves).
You won’t find this information recorded anywhere, as I don’t think the market has traced out this large an expanded flat — also at the top of a trend. It caught me by surprise this past Thursday. I want to share with you why that happened.
Some background first.
The Elliott Wave Principle is mostly about recognizing patterns, wave structure within those patterns, and using fibonacci ratios (that influence wave lengths) to predict wave targets. All the patterns have individual attributes that determine how they will play out. Accurately identifying those patterns at an early stage allows you to predict their path with a high degree of certainty.
The skill of identifying those patterns is based to some extent upon the level of probability of them appearing in the wave structure you’re currently analyzing. There are strict rules for pattern formation and there are often additional guidelines as to how they will trace out their waves.
One of the rules for ending a trend is that the final pattern will be in five waves. It can either be:
- a set of 5 impulsive waves
- a fourth wave triangle with a final impulsive 5 wave move out of the triangle (triangles have five waves themselves, labelled ABCDE)
- an ending diagonal, which contains five waves, the final wave of which is in three waves
In a normal market, corrective waves (in three) cannot end a trend. The ending pattern must have a five count (except in the current extremely rare exception).
Expanded Flats at Major Tops
Flats at a Trend Change 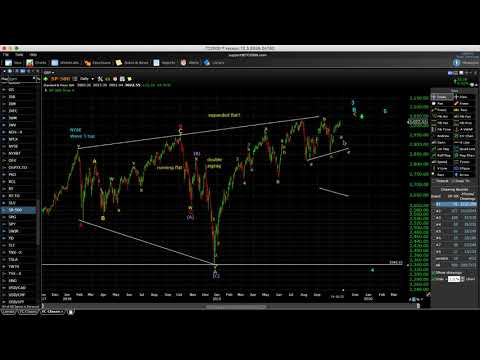 |
 |
Make sure you zoom the video to full size with frame expander (arrows) in the bottom right hand corner and also set the quality to as high as your web connection allows. This is a high definition (HD) quality video so the best viewing is at that level. |
_______________________________
In August of this year, the probabilities pointed to the final pattern being an ending diagonal. That pattern played out until October.
However, on October 1, that pattern suddenly broke with news on the China trade war. In fact the waves dropped to the current lower trendline, to suggest we were in the alternate pattern, a contracting triangle. That served us well until the the past couple of weeks.
On Thursday of this week, that pattern showed signs of breaking, more because of what related asset classes were doing. I raised the alarm that night that the next move would be to the upside. I had already identified a possibility of a smaller ending diagonal being the operative pattern in progress at the top of the breaking triangle.
Friday we rose to a new high, which ended up being the top of the third wave of an ending diagonal. We have a fourth and fifth wave still to play out.
Here’s the interesting point to me (and something I had mused about in one of two video reports): Because the higher degree pattern on the daily futures charts are unfolding as expanded flats, the subwaves are not going to top normally, but rather as a corrective wave.
This is possible only because the we’re in the middle of a large expanded flat (we’re at the top of the B wave), which appears to take precedence over the usual requirement of a five wave pattern for a top.
This is the first time that I (or perhaps anyone) has analyzed an expanded flat of this size at the top of a market. This is quite a unique structure; very rare indeed.
This creates an addition to the flat guidelines (perhaps it’s a new rule) that the subwaves of the B wave of a flat can be corrective (in three waves) in addition to the overall B wave structure being in three waves. This would be the case in very large, high degree instances of flats of any kind (there are three different kinds — descriptions can be found on the right in the sidebar).
The Hunt for Red October (updated)
The end of October is rife with major events.
- Wednesday, October 30 is the next Federal Reserve announcement.
- Thursday, October 31 is the current Brexit deadline. This could change, but right now the situation is in limbo (nobody really knows what will happen this week.
- November 1 is the next US Labor Report.
We’re looking ahead for a possible “trigger event.” The market will turn on schedule when the final pattern (an ending diagonal) in ES/SPX is complete. However, it’s usually accompanied by a major event sometime around that top.
Based upon the projection of a very large fourth wave drop in the SP500 to an area below 2100 suggests to me we’re going to see the demise of an European bank, perhaps Deutsche Bank. (there are other possible contenders out there, but this would be the biggest financially destructive potential catalyst).
_________________________________
Elliott Wave Basics
Here is a page dedicated to a relatively basic description of the Elliott Wave Principle. You’ll also find a link to the book by Bob Prechter and A. J. Frost.
______________________________
Get an upper hand … JC 2
Get an upper hand in trading …Seeing all the different currency pairs and the wave structures and hearing you explain why this has to do that on a nightly bases gives one a upper hand when trading. Elliott Wave applies to all stock and indices and can be applied to any candlestick chart. If someone ask what you want for Christmas – Tell them a membership to Peter’s “Traders Gold!”—JC |
Tops in your field DZ 2
Tops in your field …You are tops in your field. Tried to follow Elliot Wave international for years. They were always behind the market. After discovering you, I perceive that you are an expert in reading the waves, which puts you way ahead of the rest of your peers. And you can read the Waves like you are reading tomorrow’s financial section. I pray you stay healthy. —DZ |
Couldn’t be happier … KK 2
Couldn’t be happier …The analysis and insight you provide is simply amazing! I’ve been trading the futures and equity markets for well over thirty years and usually average around 5% monthly. Since joining your Traders Gold Service two months ago, that number has better than doubled. I couldn’t be happier.—KK |
the real deal SM 2
The real deal …‘Educational, insightful and thorough market analysis for all levels of traders. It’s Elliott Wave at its best….Peter Temple is the real deal’ —SM |
The best of them JL 2
The best of them …Last couple of years, I subscribed to several ‘market traders’. You are by far the best of them and the personal contact is awesome. Daily and daily updates are very well written! Besides your expertise in EW, I also like your cycles analysis. Best investment I ever made! —JL |
Have not had a losing week RW 2
Have not had a losing week …I have been with Peter almost a year. The only thing that matters is have I made money with his service. I think I have finally turned the corner using Peter’s EW. I have not had a losing week in the last 5 months. Thanks Peter, for your amazing amount of hard work. —RW |
Rise above the rest … SM 2
Rise above the rest …I have only ever met a few people who, in their chosen fields (astrology, medicine, music, martial arts, technical analysis), rise above all the rest and you are one of them…you have ‘the gift’…and that’s why I’m a Trader’s Gold member. —SM |
A true expert in Elliott Wave FL 2
A true expert in Elliott Wave …You are a true expert in EW analysis. What you provide is not available anywhere and is priceless. Subscription on your services is the best thing I have ever done. Many thanks for your effort to make me a better investor. I now have more trust in my investment decisions. I hope you will continue the excellent work! —FL |
US Market Snapshot (based on end-of-week wave structure)
This chart is posted to provide a prediction of future market direction. DO NOT trade based upon the information presented here (certainly NOT from a daily chart).

Above is the daily chart of ES (click to enlarge, as with any of my charts).
This past week was a very eventful and important week in the US indices.
As I explain in the video above, we're going to end the trend in the SP500, the DOW, and Russell 3000 with corrective subwaves, something I did not think was possible, but under the current larger degree expanded flat situation, it makes sense. We are, after all, at the top of the B wave of an expanded flat.
Now, as say that, I'm taking a bit of a leap, because it's highly probable an expanded flat is what we have here, but I can't be absolutely certain until I see how the C leg down starts to unfold (it must drop in 5 waves to a new low below December 26, 2018 to confirm. However, all indications overwhelming point to that outcome, and have for some time.
That being the case, the potential five wave patterns (an ending diagonal, a contracting triangle) have been negated. We are left with a three wave pattern, which in ES, is an ending diagonal.
I'm expecting a top to this trend by the end of the coming week.
There is an option of a set of zigzags down to the same level, but it's less probable because there are so many flats set up across multiple stocks and indices. If a zigzag is the pattern that traces out, the retraces up will not be as strong as they would be with the C wave of a flat. We'll get a lot of information about the probable path from the first wave down.
The coming drop will be a world-wide phenomenon across all most all sectors. It will last into the New Year and most likely culminate in at the low in a final round of QE.
As I've said since the low on Dec. 26, the waves up are corrective in the NYSE-related indices, and as a result, will completely retrace. Expect an imminent top and a major move to a new low under 2100.
Summary: The current B wave up is most probably the B wave of an expanded flat. The A wave ended on Jan. 26, 2018. The B wave up will end in a set of corrective subwaves, capped by an ending diagonal.
The larger degree pattern appears to be a flat (3-3-5 wave structures), which predicts a five wave dramatic drop to a new low below the A wave bottom (at about 2300). The larger pattern in ES is a record-breaking expanded flat, which will end the trend.
I expect the ultimate bottom will be somewhere under 2100.
Once we've completed the fourth wave down, we'll have a long climb to a final slight new high in a fifth wave of this 500 year cycle top.
___________________________
Trader's Gold Subscribers get a comprehensive view of the market, including hourly (and even smaller timeframes, when appropriate) on a daily basis. They also receive updates through the comments area. I provide only the daily timeframe for the free blog, as a "snapshot" of where the market currently trades and the next move on a weekly basis.
I do a nightly video on the US indices, USD Index (and related currency pairs), gold, silver, and oil).
______________________________________
Sign up for: The Chart Show
Next Date: Wednesday, November 6 at 5:00 pm EST (US market time)

The Chart Show is a one hour webinar in which Peter Temple provides the Elliott Wave analysis in real time for the US market, gold, silver, oil, major USD currency pairs, and more. You won't find a more accurate or comprehensive market prediction anywhere for this price.
Get caught up on the market from an Elliott Wave perspective. There’ll be a Q&A session during and at the end of the webinar and the possibility (depending on time) of taking requests.
For more information and to sign up, click here.
| "I think you are the only Elliot Wave technician on the planet who knows what he's doing.” |
| m.d. (professional trader) |
All registrants will receive the video playback of the webinar, so even if you miss it, you’ll be sent the full video replay within about an hour of its conclusion.


