

Long Will Be a Bummer
This market is exhausted. Gaps are routinely being left open and virtually everything is moving to the beat of the US Dollar.
You can also see revolutions starting to break out in countries around the world (Spain, France, Hong Kong, Chile, Ecuador, Haiti, Papua New Guinea, now Iraq, and others). This is not an anomaly; they will continue to crop up and get bigger as time goes on.
Then there are the loss of jobs, bankruptcies, and union strikes that are growing throughout the world. The action of governments to these crises usually exacerbates the problem (as in the jailing of politicians from Catalonia for 13 years, or the restricting of imports of black outerwear in Hong Kong by the Chinese government so protesters can’t dress in black — this one is particularly stupid).
Add to that the corruption that continues to be exposed and you have a recipe for a major upheaval. When this market comes down, it will be fuel for the fires that are starting all over the world.
I’m expecting a trend change very early in the coming week.
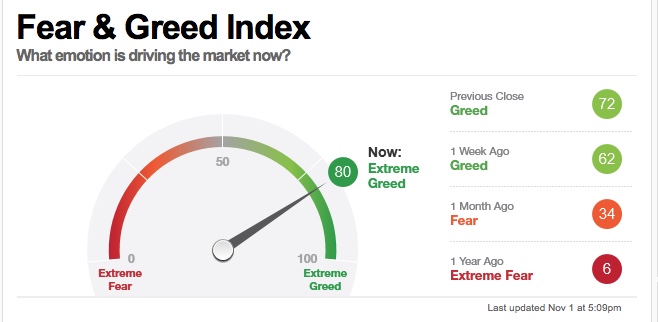
CNN’s Fear and Greed index is at new highs, ripe for a turn to the downside.
The Hunt for Red October (updated)
It’s Halloween sugar hang-over time … which is likely to drift into the markets early this week.
- Wednesday, October 30 was the next Federal Reserve announcement.
- November 1 was the next US Labor Report.
- The Elliott Wave count is now full, or almost full, across all the major US indices.
- The lagging index, the DOW, is 50 points away from a new high.
- Sunday evening New Moon at 4 Scorpio, the highest point of Radiation in all the heavens.
- Sentiment is highly elevated (CNN Greed Index above)
- During the last five trading days, volume in put options has lagged volume in call options by 47.06% as investors make bullish bets in their portfolios.
I’m expecting a turn as early as Monday … we’ll see what happens. We may also get a “trigger” event, which very often accompanies a turn of this magnitude, but it may lag the actual turn.
Based upon the projection of a very large fourth wave drop in the SP500 to an area below 2100 suggests to me we’re going to see the demise of a European bank, perhaps Deutsche Bank. (there are other possible contenders out there, but this would be the biggest financially destructive potential catalyst).
_________________________________
Elliott Wave Basics
Here is a page dedicated to a relatively basic description of the Elliott Wave Principle. You’ll also find a link to the book by Bob Prechter and A. J. Frost.
______________________________
A true expert in Elliott Wave FL 2
A true expert in Elliott Wave …You are a true expert in EW analysis. What you provide is not available anywhere and is priceless. Subscription on your services is the best thing I have ever done. Many thanks for your effort to make me a better investor. I now have more trust in my investment decisions. I hope you will continue the excellent work! —FL |
Tops in your field DZ 2
Tops in your field …You are tops in your field. Tried to follow Elliot Wave international for years. They were always behind the market. After discovering you, I perceive that you are an expert in reading the waves, which puts you way ahead of the rest of your peers. And you can read the Waves like you are reading tomorrow’s financial section. I pray you stay healthy. —DZ |
the real deal SM 2
The real deal …‘Educational, insightful and thorough market analysis for all levels of traders. It’s Elliott Wave at its best….Peter Temple is the real deal’ —SM |
The best of them JL 2
The best of them …Last couple of years, I subscribed to several ‘market traders’. You are by far the best of them and the personal contact is awesome. Daily and daily updates are very well written! Besides your expertise in EW, I also like your cycles analysis. Best investment I ever made! —JL |
Have not had a losing week RW 2
Have not had a losing week …I have been with Peter almost a year. The only thing that matters is have I made money with his service. I think I have finally turned the corner using Peter’s EW. I have not had a losing week in the last 5 months. Thanks Peter, for your amazing amount of hard work. —RW |
Get an upper hand … JC 2
Get an upper hand in trading …Seeing all the different currency pairs and the wave structures and hearing you explain why this has to do that on a nightly bases gives one a upper hand when trading. Elliott Wave applies to all stock and indices and can be applied to any candlestick chart. If someone ask what you want for Christmas – Tell them a membership to Peter’s “Traders Gold!”—JC |
Rise above the rest … SM 2
Rise above the rest …I have only ever met a few people who, in their chosen fields (astrology, medicine, music, martial arts, technical analysis), rise above all the rest and you are one of them…you have ‘the gift’…and that’s why I’m a Trader’s Gold member. —SM |
Couldn’t be happier … KK 2
Couldn’t be happier …The analysis and insight you provide is simply amazing! I’ve been trading the futures and equity markets for well over thirty years and usually average around 5% monthly. Since joining your Traders Gold Service two months ago, that number has better than doubled. I couldn’t be happier.—KK |
US Market Snapshot (based on end-of-week wave structure)
This chart is posted to provide a prediction of future market direction. DO NOT trade based upon the information presented here (certainly NOT from a daily chart).

Above is the daily chart of ES (click to enlarge, as with any of my charts).
This past week gave us the usual Federal Reserve announcement boost and on Friday, the boost from the US labor report, two events I was expecting might culminate in new highs across the US equities indices. We achieved it in all the indices, except the DOW and Russell 2000.
The DOW now sits shy by 50 points (which is "nothing" for the DOW to traverse in an hour, and I'm not sure the Russell is set up in flat pattern now, so we may not actually need a new high in that index.
The count appears complete (5 waves in the final pattern) but may need just a few more points to the upside to complete the final topping process. We may finish those chores on the weekend or early Monday.
I'm looking at Monday for a possible turn to the downside.
The pattern across the indices appears to be an expanded flat (a regular flat in the exchange, NYSE). That projects a large wave down in 5 waves to an area under 2100 in ES.
There is an option of a set of zigzags down to the same level, but it's less probable because there are so many flats set up across multiple stocks and indices. If a zigzag is the pattern that traces out, the retraces up will not be as strong as they would be with the C wave of a flat. We'll get a lot of information about the probable path from the first wave down.
The coming drop will be a world-wide phenomenon across all most all sectors. It will last into the New Year and most likely culminate in at the low in a final round of QE.
As I've said since the low on Dec. 26, the waves up are corrective in the NYSE-related indices, and as a result, will completely retrace. Expect an imminent top and a major move to a new low under 2100.
Summary: The current B wave up is most probably the B wave of an expanded flat. The A wave ended on Jan. 26, 2018. The B wave up will end in a set of corrective subwaves, capped by an ending diagonal.
The larger degree pattern appears to be a flat (3-3-5 wave structures), which predicts a five wave dramatic drop to a new low below the A wave bottom (at about 2300). The larger pattern in ES is a record-breaking expanded flat, which will end the trend.
I expect the ultimate bottom will be somewhere under 2100.
Once we've completed the fourth wave down, we'll have a long climb to a final slight new high in a fifth wave of this 500 year cycle top.
___________________________
Trader's Gold Subscribers get a comprehensive view of the market, including hourly (and even smaller timeframes, when appropriate) on a daily basis. They also receive updates through the comments area. I provide only the daily timeframe for the free blog, as a "snapshot" of where the market currently trades and the next move on a weekly basis.
I do a nightly video on the US indices, USD Index (and related currency pairs), gold, silver, and oil).
______________________________________
Sign up for: The Chart Show
Next Date: Wednesday, November 13 at 5:00 pm EST (US market time)

The Chart Show is a one hour webinar in which Peter Temple provides the Elliott Wave analysis in real time for the US market, gold, silver, oil, major USD currency pairs, and more. You won't find a more accurate or comprehensive market prediction anywhere for this price.
Get caught up on the market from an Elliott Wave perspective. There’ll be a Q&A session during and at the end of the webinar and the possibility (depending on time) of taking requests.
For more information and to sign up, click here.
| "I think you are the only Elliot Wave technician on the planet who knows what he's doing.” |
| m.d. (professional trader) |
All registrants will receive the video playback of the webinar, so even if you miss it, you’ll be sent the full video replay within about an hour of its conclusion.


