

Controlled Chaos at the Top
We’re on the cusp of a trend change. The US Dollar Index looks like it has changed trend (but needs confirmation); however, the EURUSD wave pattern is questionable. None of the other USD currency pairs have turned the corner to create a new trend, but they’re not far away from doing so.
The US indices, of course, have not changed direction; the direction is still up, but not for much longer.
It will be important what the US Dollar Index does in terms of its retrace. A 62% retrace only (and a subsequent turn up) will confirm a bottom is in place and should trigger a large drop in the US indices (and similar moves in currency pairs). Until that happens, we’re in limbo.
There’s a full moon on Tuesday, Nov. 12 and this may be a determinant of a trend change. The market tends to rise into a full moon.
Tops are a process, and never more so than in this market, where everything has to change trend virtually together to allow the market to build some momentum in the other direction.
It’s important to note that several possible ending diagonals in the US indices have failed, and combined with the elevated sentiment index, the next move down should be the major one we’ve been expecting for SO LONG (frustrating, for sure).
The greed factor is at an extreme as of this weekend (even more extreme than last week!), so it’s certainly telegraphing a trend change is imminent.
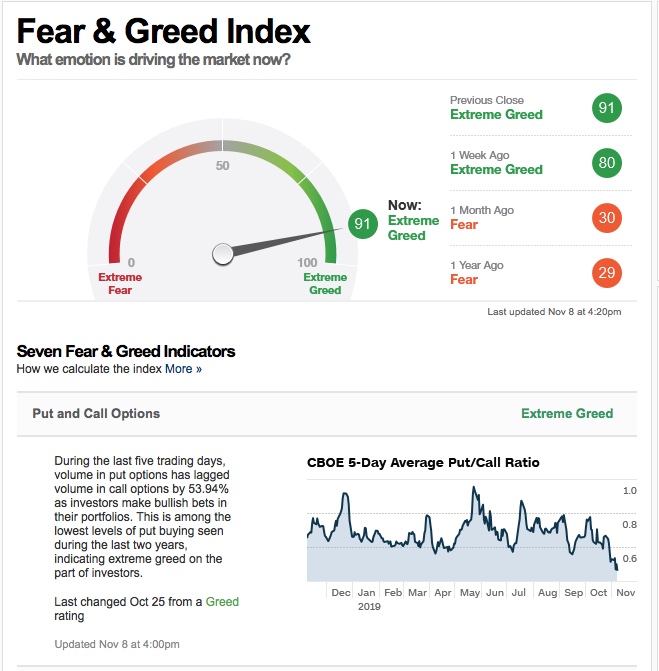
During the last five trading days, volume in put options has lagged volume in call options by 53.94% as investors make bullish bets in their portfolios. This is among the lowest levels of put buying seen during the last two years, indicating extreme greed on the part of investors.
________________________
Based upon the projection of a very large fourth wave drop in the SP500 to an area below 2100 suggests to me we’re going to see the demise of a European bank, perhaps Deutsche Bank. (there are other possible contenders out there, but this would be the biggest financially destructive potential catalyst).
_________________________________
Elliott Wave Basics
Here is a page dedicated to a relatively basic description of the Elliott Wave Principle. You’ll also find a link to the book by Bob Prechter and A. J. Frost.
______________________________
Get an upper hand … JC 2
Get an upper hand in trading …Seeing all the different currency pairs and the wave structures and hearing you explain why this has to do that on a nightly bases gives one a upper hand when trading. Elliott Wave applies to all stock and indices and can be applied to any candlestick chart. If someone ask what you want for Christmas – Tell them a membership to Peter’s “Traders Gold!”—JC |
Tops in your field DZ 2
Tops in your field …You are tops in your field. Tried to follow Elliot Wave international for years. They were always behind the market. After discovering you, I perceive that you are an expert in reading the waves, which puts you way ahead of the rest of your peers. And you can read the Waves like you are reading tomorrow’s financial section. I pray you stay healthy. —DZ |
the real deal SM 2
The real deal …‘Educational, insightful and thorough market analysis for all levels of traders. It’s Elliott Wave at its best….Peter Temple is the real deal’ —SM |
A true expert in Elliott Wave FL 2
A true expert in Elliott Wave …You are a true expert in EW analysis. What you provide is not available anywhere and is priceless. Subscription on your services is the best thing I have ever done. Many thanks for your effort to make me a better investor. I now have more trust in my investment decisions. I hope you will continue the excellent work! —FL |
Have not had a losing week RW 2
Have not had a losing week …I have been with Peter almost a year. The only thing that matters is have I made money with his service. I think I have finally turned the corner using Peter’s EW. I have not had a losing week in the last 5 months. Thanks Peter, for your amazing amount of hard work. —RW |
The best of them JL 2
The best of them …Last couple of years, I subscribed to several ‘market traders’. You are by far the best of them and the personal contact is awesome. Daily and daily updates are very well written! Besides your expertise in EW, I also like your cycles analysis. Best investment I ever made! —JL |
Couldn’t be happier … KK 2
Couldn’t be happier …The analysis and insight you provide is simply amazing! I’ve been trading the futures and equity markets for well over thirty years and usually average around 5% monthly. Since joining your Traders Gold Service two months ago, that number has better than doubled. I couldn’t be happier.—KK |
Rise above the rest … SM 2
Rise above the rest …I have only ever met a few people who, in their chosen fields (astrology, medicine, music, martial arts, technical analysis), rise above all the rest and you are one of them…you have ‘the gift’…and that’s why I’m a Trader’s Gold member. —SM |
US Market Snapshot (based on end-of-week wave structure)
This chart is posted to provide a prediction of future market direction. DO NOT trade based upon the information presented here (certainly NOT from a daily chart).
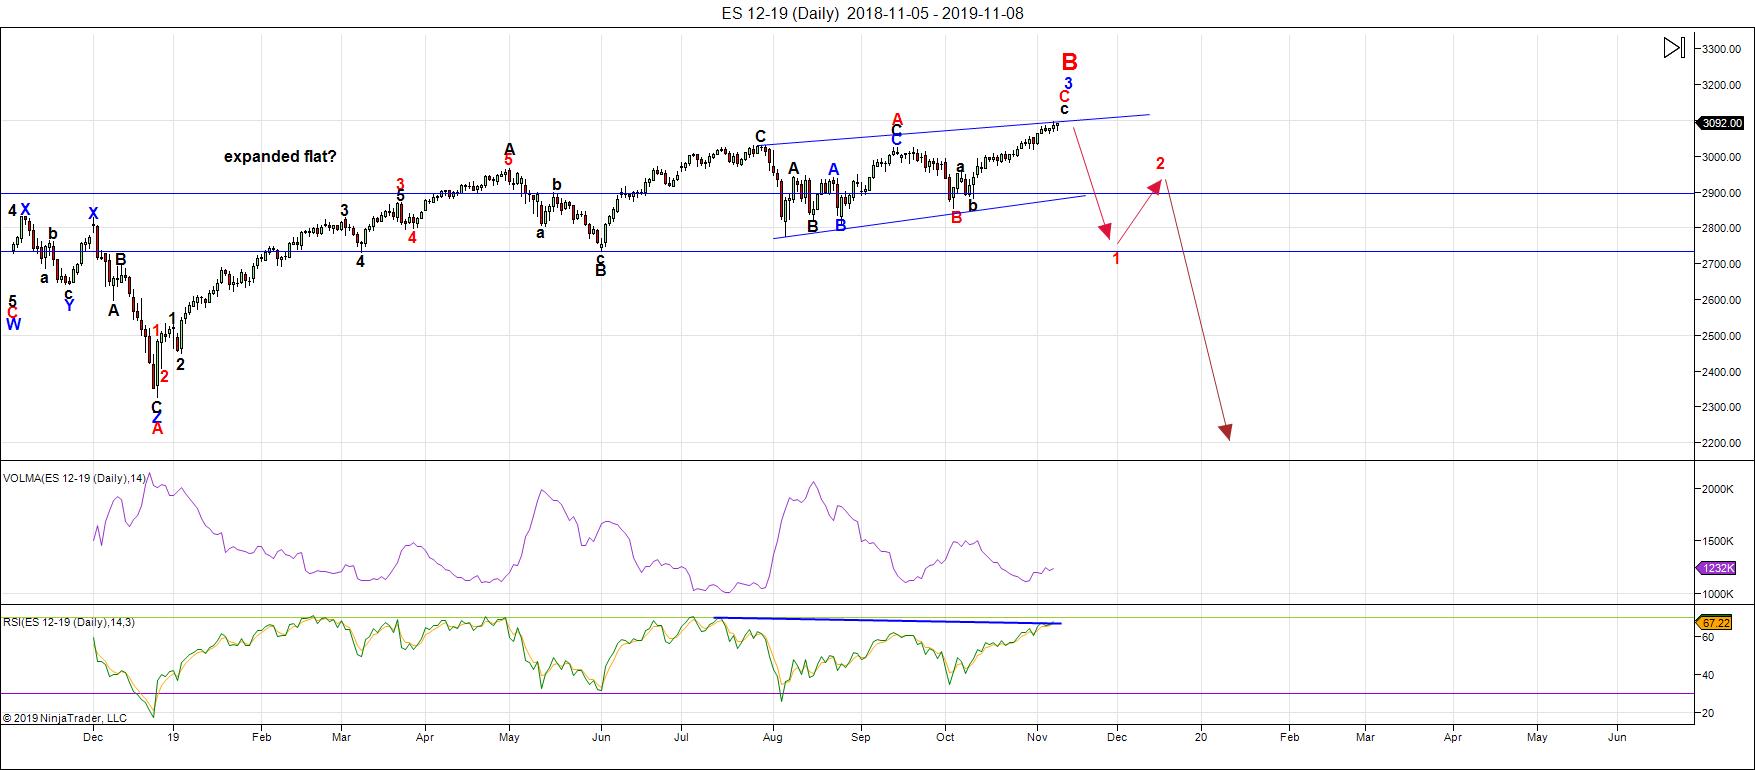
Above is the daily chart of ES (click to enlarge, as with any of my charts).
This past week has seen a lot of churning and some turning (in the US Dollar Index, particularly). It will require a second wave to the downside to confirm the bottom is in).
At the same time, the US indices have been working on a final high, which I don't see for perhaps a couple of more days. Currency pairs still have a bit of work to do and I don't see an equities top until they finish up their current trends (they're very close).
All the major NYSE sub-indices (except the Russell 2000) have hit new highs, so I'm expecting the IWM target of 161 to be hit before the larger turn down.
The possible ending diagonal has been broken in NDX, the Russell 3000, OEX, and possibly, the SP500. I've left the ED trendlines on the above chart to show the possible pattern, but since it's broken in other indices, it will affect the outcome in ES, as well.
That means we're poised for a large wave down to below 2100 in ES. We need the final waves in other asset classes to finish up their current patterns before the entire market (and other international exhanges) change trend. I expect that event is only day away.
Tuesday of this week gives us a full moon, which could be the trigger.
The pattern across the indices appears to be an expanded flat (a regular flat in the NYSE exchange). That projects a large wave down in 5 waves to an area under 2100 in ES.
There is an option of a set of zigzags down to the same level, but it's less probable because there are so many flats set up across multiple stocks and indices. If a zigzag is the pattern that traces out, the retraces up will not be as strong as they would be with the C wave of a flat. We'll get a lot of information about the probable path from the first wave down.
The coming drop will be a world-wide phenomenon across all most all sectors. It will last into the New Year and most likely culminate in at the low in a final round of QE.
As I've said since the low on Dec. 26, the waves up are corrective in the NYSE-related indices, and as a result, will completely retrace. Expect an imminent top and a major move to a new low under 2100.
Summary: The current B wave up is most probably the B wave of an expanded flat. The A wave ended on Jan. 26, 2018. The B wave up will end in a set of corrective subwaves.
The larger degree pattern appears to be a flat (3-3-5 wave structures), which predicts a five wave dramatic drop to a new low below the A wave bottom (at about 2300). The larger pattern in ES is a record-breaking expanded flat, which will end the trend.
I expect the ultimate bottom will be somewhere under 2100.
Once we've completed the fourth wave down, we'll have a long climb to a final slight new high in a fifth wave of this 500 year cycle top.
___________________________
Trader's Gold Subscribers get a comprehensive view of the market, including hourly (and even smaller timeframes, when appropriate) on a daily basis. They also receive updates through the comments area. I provide only the daily timeframe for the free blog, as a "snapshot" of where the market currently trades and the next move on a weekly basis.
I do a nightly video on the US indices, USD Index (and related currency pairs), gold, silver, and oil).
______________________________________
Sign up for: The Chart Show
Next Date: Wednesday, November 20 at 5:00 pm EST (US market time)

The Chart Show is a one hour webinar in which Peter Temple provides the Elliott Wave analysis in real time for the US market, gold, silver, oil, major USD currency pairs, and more. You won't find a more accurate or comprehensive market prediction anywhere for this price.
Get caught up on the market from an Elliott Wave perspective. There’ll be a Q&A session during and at the end of the webinar and the possibility (depending on time) of taking requests.
For more information and to sign up, click here.
| "I think you are the only Elliot Wave technician on the planet who knows what he's doing.” |
| m.d. (professional trader) |
All registrants will receive the video playback of the webinar, so even if you miss it, you’ll be sent the full video replay within about an hour of its conclusion.


