

Something May Break
We’re on the cusp of a trend change across multiple asset classes on an international scale.
“Hopium” is a euphemism for the unsupported bullishness we’re seeing both in the market and in the main stream media. It’s not supported by the underlying fundamentals.
In fact, if you want a snapshot of the current social mood, look no further than Baltimore, which is highlighted in a zerohedge article this weekend, “Baltimore City Hits 300 Homicides.”
We have riots and revolutions erupting all over the world. This is the tip of the iceberg. The market is about to destroy trillions of dollars of value over the next three months. It’s going to be a game-changer.
The US Dollar Index appears to have changed trend and is possibly in the middle of an extended first wave to the upside. However, it needs a new high to technically confirm the bottom is in place.
This will further the recent liquidity issue that central banks have been fighting (as in the Federal Reserve and its announcement of “NOT QE”). A larger deflationary monetary crisis has been simmering “under the hood” for years. On a longer-term basis, it will lead to a credit and banking crisis throughout the world. We’ve already seen the topping of the real estate bubble, which is in itself, a sign of deflation taking hold.
The EURUSD wave pattern is in a similar position to the US Dollar Index (in the opposite direction), but the wave structure is not as clear. The most recent wave up as of Friday is corrective, so more downside is expected in the short term.
DAX, the German exhange, also appears to have topped and is this weekend in a corrective second wave on a one minute chart. This is the beginning of a 5,000+ point drop.
None of the other USD currency pairs have clear enough patterns to be certain as to whether they’ve changed trend, or not, but they’re all close to reversals.
Oil may have a little bit more to its rally, but the upside is very limited.
So, What Could Break?
Usually, at a major high such as the one setting up here, we have a complementary catastophe of some sort. It could be a financial collapse, or some other major event that would cause a loss of confidence. This doesn’t cause the expected thousand plus drop in SPX, but is a byproduct of the fact that all the money possible is “in” the market and people are feeling bullish because of that fact … and … financial ratios are pushed to the absolute extremes, which is certainly what Elliott Wave is telling us this weekend.
In the United States, we’re expecting the handing down of indictments from the Attorney General William Barr in the case of conspiracy to remove a sitting president from office. I don’t know if this event has the financial implications to help move the market but I think there’s a reasonable chance that it could. In any case, there will be two major opposing social forces at work, on opposite ends of the aisle, with a lot at stake.
There are revolutions cropping up all over the world, with a potential crackdown (illegally, mind you) of the Chinese government at the request of Hong Kong. At this point, it’s just a rumour.
There are also a few international banks that are on the verge of collapse in Italy, Spain, and Germany and this could also prove to be a catalyst for a trend change. Usually at these major inflection points, there is something that “triggers the turn,” even though the turn is inevitable without it.
For example, very often at expected currency turns, there is an rate change announcement that creates a spike in the opposite direction than the established trend, and ends up being the catalyst for a turn with momentum.
It’s going to be an exciting week, I have no doubt.
____________________________
Time To Screw on Your Contrarian Hats
The greed factor is at an extreme as of this weekend. We’ve been hovering around the 90% level for the past week or so. It’s telegraphing a trend change is imminent.

During the last five trading days, volume in put options has lagged volume in call options by 47.53% as investors make bullish bets in their portfolios. This is among the lowest levels of put buying seen during the last two years, indicating extreme greed on the part of investors.
The VIX is very close to new lows, setting up a gigantic short squeeze opportunity.
_______________________
Elliott Wave Basics
Here is a page dedicated to a relatively basic description of the Elliott Wave Principle. You’ll also find a link to the book by Bob Prechter and A. J. Frost.
______________________________
the real deal SM 2
The real deal …‘Educational, insightful and thorough market analysis for all levels of traders. It’s Elliott Wave at its best….Peter Temple is the real deal’ —SM |
Couldn’t be happier … KK 2
Couldn’t be happier …The analysis and insight you provide is simply amazing! I’ve been trading the futures and equity markets for well over thirty years and usually average around 5% monthly. Since joining your Traders Gold Service two months ago, that number has better than doubled. I couldn’t be happier.—KK |
Have not had a losing week RW 2
Have not had a losing week …I have been with Peter almost a year. The only thing that matters is have I made money with his service. I think I have finally turned the corner using Peter’s EW. I have not had a losing week in the last 5 months. Thanks Peter, for your amazing amount of hard work. —RW |
Rise above the rest … SM 2
Rise above the rest …I have only ever met a few people who, in their chosen fields (astrology, medicine, music, martial arts, technical analysis), rise above all the rest and you are one of them…you have ‘the gift’…and that’s why I’m a Trader’s Gold member. —SM |
A true expert in Elliott Wave FL 2
A true expert in Elliott Wave …You are a true expert in EW analysis. What you provide is not available anywhere and is priceless. Subscription on your services is the best thing I have ever done. Many thanks for your effort to make me a better investor. I now have more trust in my investment decisions. I hope you will continue the excellent work! —FL |
The best of them JL 2
The best of them …Last couple of years, I subscribed to several ‘market traders’. You are by far the best of them and the personal contact is awesome. Daily and daily updates are very well written! Besides your expertise in EW, I also like your cycles analysis. Best investment I ever made! —JL |
Tops in your field DZ 2
Tops in your field …You are tops in your field. Tried to follow Elliot Wave international for years. They were always behind the market. After discovering you, I perceive that you are an expert in reading the waves, which puts you way ahead of the rest of your peers. And you can read the Waves like you are reading tomorrow’s financial section. I pray you stay healthy. —DZ |
Get an upper hand … JC 2
Get an upper hand in trading …Seeing all the different currency pairs and the wave structures and hearing you explain why this has to do that on a nightly bases gives one a upper hand when trading. Elliott Wave applies to all stock and indices and can be applied to any candlestick chart. If someone ask what you want for Christmas – Tell them a membership to Peter’s “Traders Gold!”—JC |
US Market Snapshot (based on end-of-week wave structure)
This chart is posted to provide a prediction of future market direction. DO NOT trade based upon the information presented here (certainly NOT from a daily chart).
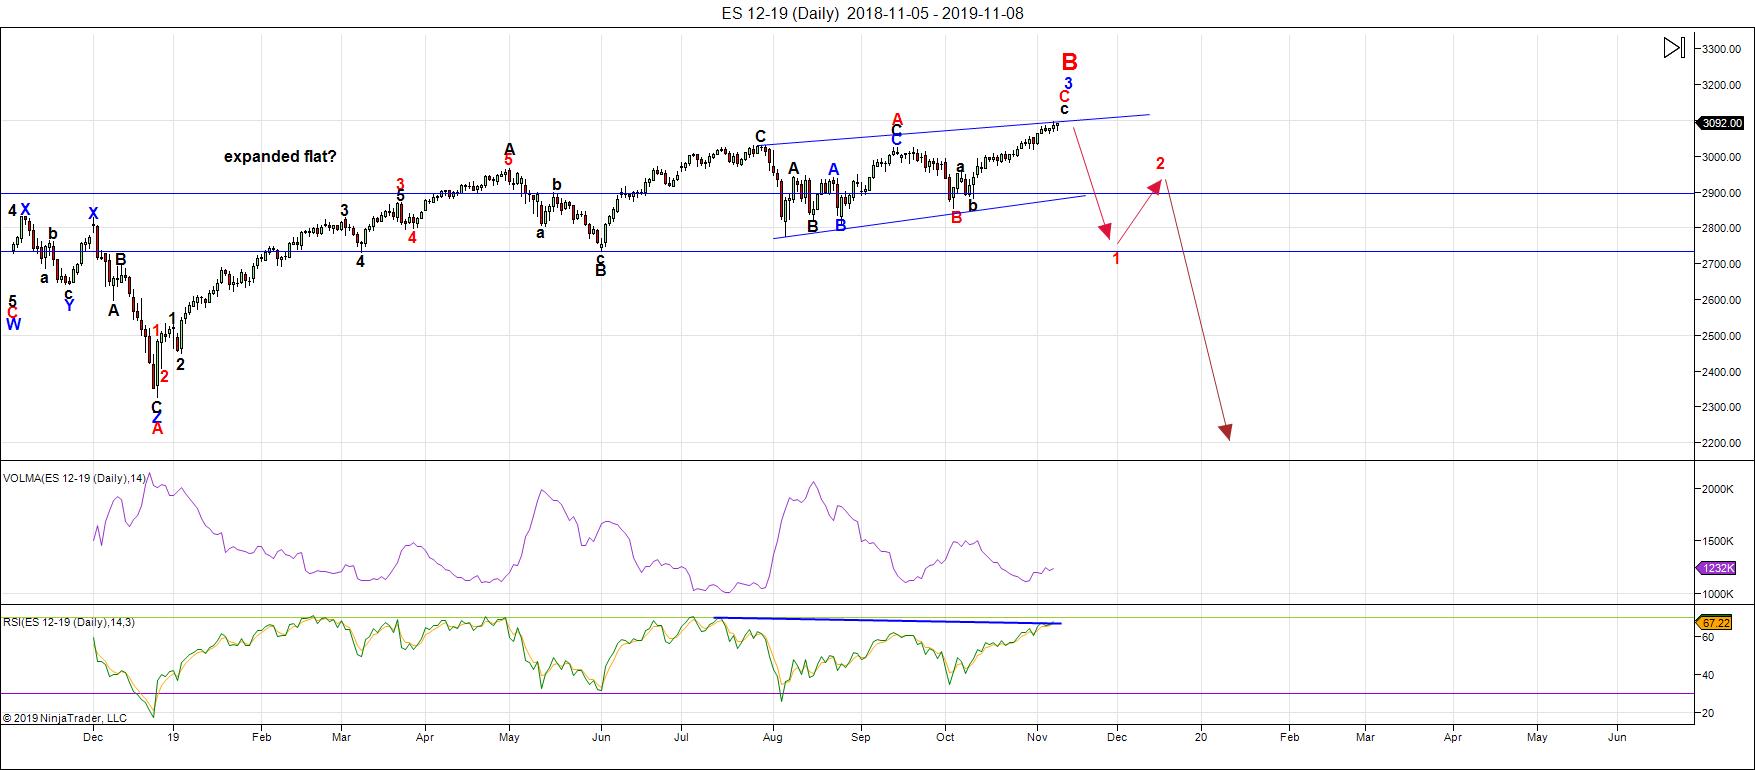
Above is the daily chart of ES (click to enlarge, as with any of my charts).
This past week has seen a lot of churning and some turning (in the US Dollar Index, particularly). DXY looks like it's in the middle of an extended first wave to the upside but will need confirmation with an immediate turn higher.
We continue to wait for the US indices to find a final high. On an hourly chart, NQ (Nasdaq futures) has traced out an ending diagonal and has almost reached the maximum level allowable.
ES (on an hourly chart) first began with a contracting triangle, then morphed into an ending diagonal, and then morphed once more into a very rare ending expanding diagonal (a pattern that I've only seen one or two times before). On Friday late in the day, it tested the upper trendline.
Both of these patterns are trend ending patterns and we are at the very top of both.
The SP500 is more difficult to pinpoint due to all the gaps in the set of waves up from 2872. Fibonacci relationships also do not seem to be working. The most recent wave up in both ES and the SP500 may need a small fourth and fifth wave to finish off the final wave — it's very hard to tell.
In any event, we're at a top and at this point, hours away from seeing a turn to the downside, I believe. However, we may need some sort of "trigger" event to mark the turn. I'm expecting a resolution in the first part of this week and a set of waves down that are dramatic in terms of momentum.
The possible large ending diagonal (trendlines have been left on the chart above) has been broken in NDX, the Russell 3000, OEX, and the SP500. As a result, I'm expecting this wave down to result in the targeting of the 2100 area and below.
We need the final waves in other asset classes to finish up their current patterns before the entire market (and other international exhanges) change trend. I expect the trend change is imminent (particularly with the current position of the US Dollar Index.
The larger pattern across the indices appears to be an expanded flat (a regular flat in the NYSE exchange). That projects a large wave down in 5 waves to an area under 2100 in ES.
There is an option of a set of zigzags down to the same level, but it's less probable because there are so many flats set up across multiple stocks and indices. If a zigzag is the pattern that traces out, the retraces up will not be as strong as they would be with the C wave of a flat. We'll get a lot of information about the probable path from the first wave down.
The coming drop will be a world-wide phenomenon across all most all sectors. It will last into the New Year and most likely culminate in at the low in a final round of QE.
As I've said since the low on Dec. 26, the waves up are corrective in the NYSE-related indices, and as a result, will completely retrace. Expect an imminent top and a major move to a new low under 2100.
Summary: The current B wave up is most probably the B wave of an expanded flat. The A wave ended on Jan. 26, 2018. The B wave up will end in a set of corrective subwaves. A trend change is imminent.
I expect the ultimate bottom will be somewhere under 2100.
Once we've completed the fourth wave down, we'll have a long climb to a final slight new high in a fifth wave of this 500 year cycle top.
___________________________
Trader's Gold Subscribers get a comprehensive view of the market, including hourly (and even smaller timeframes, when appropriate) on a daily basis. They also receive updates through the comments area. I provide only the daily timeframe for the free blog, as a "snapshot" of where the market currently trades and the next move on a weekly basis.
I do a nightly video on the US indices, USD Index (and related currency pairs), gold, silver, and oil).
______________________________________
Sign up for: The Chart Show
Next Date: Wednesday, November 27 at 5:00 pm EST (US market time)

The Chart Show is a one hour webinar in which Peter Temple provides the Elliott Wave analysis in real time for the US market, gold, silver, oil, major USD currency pairs, and more. You won't find a more accurate or comprehensive market prediction anywhere for this price.
Get caught up on the market from an Elliott Wave perspective. There’ll be a Q&A session during and at the end of the webinar and the possibility (depending on time) of taking requests.
For more information and to sign up, click here.
| "I think you are the only Elliot Wave technician on the planet who knows what he's doing.” |
| m.d. (professional trader) |
All registrants will receive the video playback of the webinar, so even if you miss it, you’ll be sent the full video replay within about an hour of its conclusion.


