
Year End Video – December 31, 2015
 |
 |
Make sure you zoom the video to full size with frame expander (arrows) in the bottom right hand corner and also set the quality to as high as your web connection allows. This is an HD quality video so the best viewing is at that level. |
_______________________________
Update Wednesday, Dec 30 After the Bell
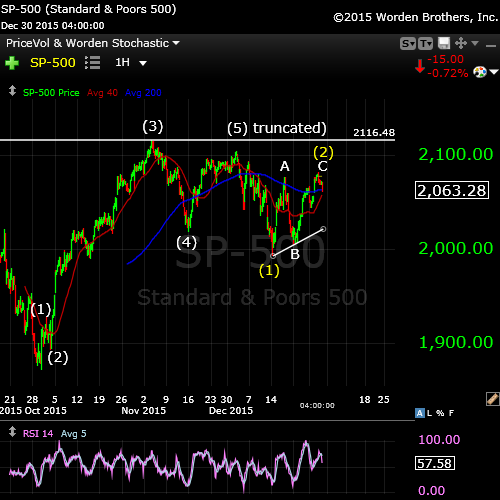
Wow! This is quite the market. I’m planning to do a little video on it later today. Let’s look at the SP500 as at right now. This is a one hour chart.
It suddenly dawned on me today what I’m looking at. While I had thought the truncation took place on Dec 17, it was actually in Dec. 1. You can clearly see the five waves up in wave (5) but the last wave didn’t complete and left a 3 as the final wave. Then we have a first wave down (a bit messed up—not motive, due to the truncation). You can see the subwaves clearly—they’re just compressed.
After finishing wave 1 down (it came down to exactly the right spot—the bottom of the previous fourth wave), we traced out a corrective second wave in two legs (ABC). I’m expecting this wave to top tomorrow, leaving a third wave down set up for the beginning of next week. It’ll be the hangover to the party that’s gone on for way too many years …
_______________________________
Update Tuesday, Dec 29 11:30am EST
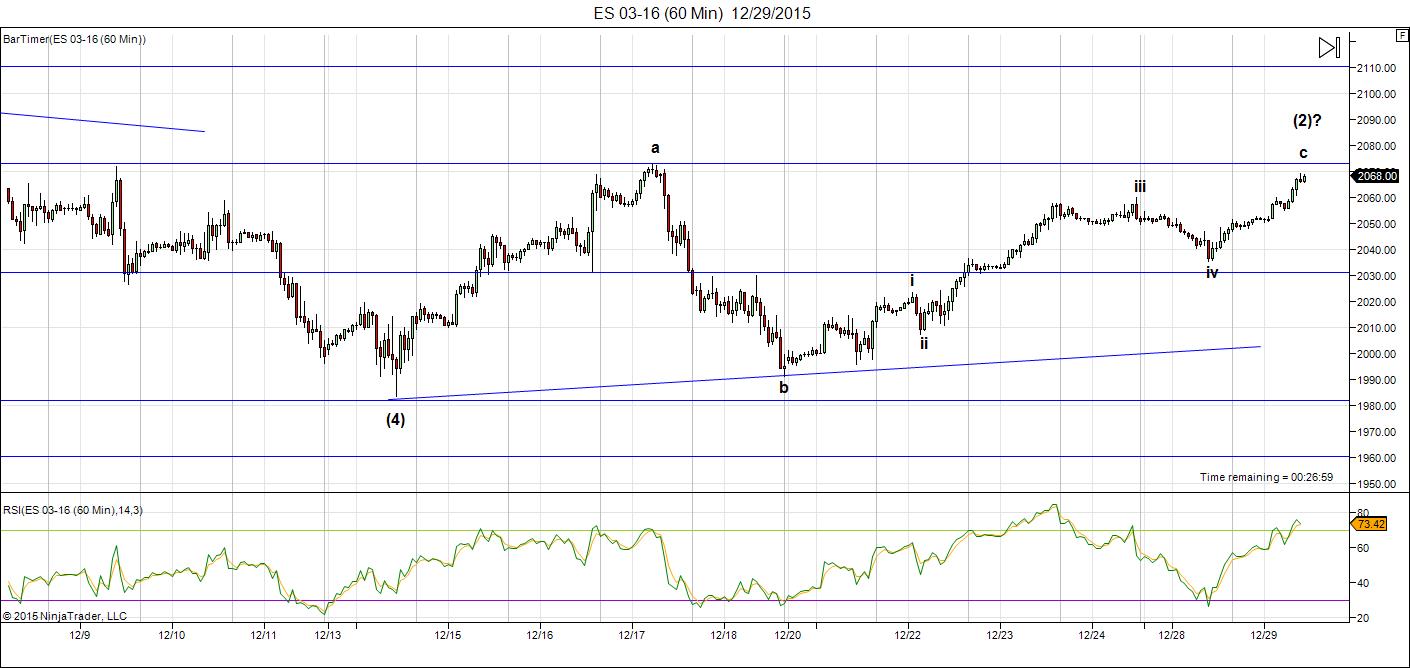
Another chart of ES. I can’t get the idea of a flat (3-3-5) idea out of my head. But this would bring us back to the truncation idea. This would be an a/b/c pattern shown here, which would end where I have the c on the chart, ending in a double top. This would lead to wave 3 down. We’ve lost all our momentum, so all I can suggest is to watch for a turnover at this previous high. It might not happen, but there aren’t a lot of options that I can see at the moment …
_______________________
Update Tuesday, Dec 29, 5am EST
Things are certainly getting interesting, but it’s more difficult to figure out a valid count. Above is the 60 minute chart of ES (SPX emini futures).
Overnight, we seem to have broken through the upper trendline of the triangle and so I’ve relabelled the waves as if this is a final motive 5th wave up, but I have reservations about the count.
We may have completed wave 4 of 3 yesterday, but wave 3 is still short. Within this wave, wave iii is 1.6 X wave i and if wave v ends up the same length (as it normally should, it would take this third wave to 2088 ES. At that point, wave 3 would be slightly longer than wave 1, which is good. However, this leaves a question as to what’s going to happen with wave 4, which cannot retrace into the area of wave 1. I don’t see how that’s possible, so we’re going to have to wait to see how this unfolds.
In the meantime, the trend seems to be up, which was the long term plan, anyway. The secondary indices (IWM, etc.) seem to have corrective (abc) waves unfolding, so they may have already topped. There are only a few stocks keeping the cash indices alive.
OR … we could just be extending the upper trendline a little higher and still be completing a triangle …
This market is a bit of a mess, so it’s difficult to figure out how this last wave will tie into the bigger picture, but we seem to be in the final stages of this year-end dance.
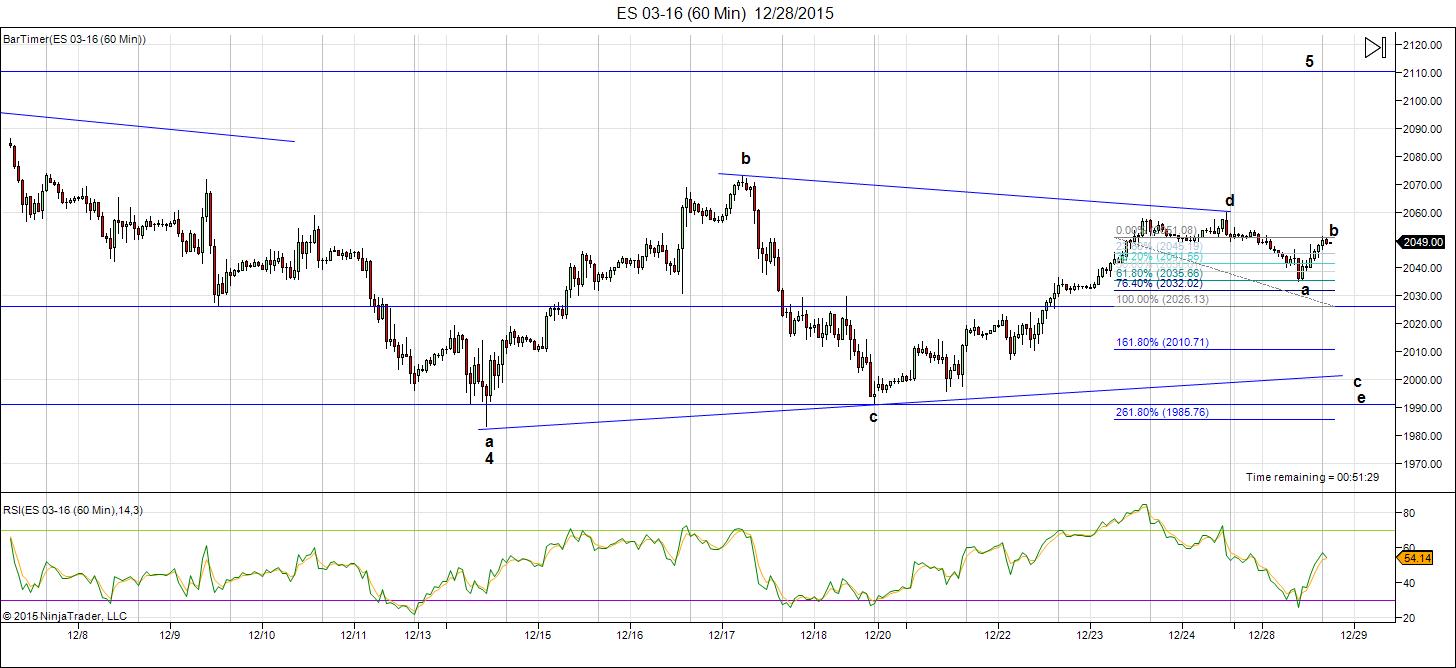
Update: Monday, Dec. 28, After the Bell
We appear to have completed the b wave of the triangle e wave at the end of the day. If so, we should drop in the C wave to the bottom of the triangle through tomorrow. After the turn at the bottom of the triangle, we should see a wave up (in 3 waves) to a high above the Nov. 3 third wave top.
This wave we’re currently in could be a fourth wave leading to a fifth wave but, as I’ve mentioned before the b wave up on the chart below, ES does not look motive. For this to a be final wave up, it would have to be a motive sequence of 5 waves. Due to the questionable look of the b wave, I have focused on the triangle pattern that seems to be unfolding. All the futures and cash indices are forming the same pattern.
In ES, the c wave overnight would reach about 2010 when it’s 1.618 X the length of the a wave.
Currencies: I am long AUD/USD which turned up at the end of the day, as did EUR/USD. Currencies continue to move contra to the equities market. They should continue up overnight.
Holidays Market Schedule:
- US Equities close at 1pm EST, Thursday, Dec 24, open Monday, Dec 28 at 9:30am EST
- Forex closes at 2pm EST, Thursday, Dec 24, open Sunday, Dec 27 at 5PM EST
- Globex Futures close at 1:45pm EST on Thursday, Dec 24, open Monday, Dec 28 at regular time
- UK Markets close at 12:30 PM London time, Thursday, Dec 24 and open on Tuesday, the 29th
- French markets close at 2pm Paris time on Thursday, will reopen for a regular day Monday, Dec 28
- German markets closed all day Thursday, Dec 24 but will be open on Monday, Dec 28
Elliott waves are amazing! When you think the market is going to keel over, it just doesn’t—not until the final prescribed wave is complete. In this case, we have a regular flat pattern, which is the 3 wave corrective pattern up from the Aug. 24 low.
The final wave of this patter (3-3-5) has to be in five waves and we simply haven’t finished that fifth wave.
But with what looked like a short motive-looking wave up and then a motive-looking first wave down, I declared a truncation. But I did that with the warning that the fifth wave was short (and in three waves—requiring a longer wave to make it work). Alas, there was no follow-through.
A day later, after scratching my head a good bit, I introduced a final triangle as an alternative (shown above), although very early in the process, as it only had one leg up completed. A triangle pattern can add onto a fourth wave pattern and would signify the final pattern before a fifth wave up.
The waves will finish their journey. They almost always do. I only know of a couple of real truncations over several decades.
Well, now all the indices in cash and futures sport the same pattern, so it’s becoming rather obvious to me that this is ultimately what’s happening. There’s a possible alternative, but it would result in the same end—a new high just above the previous wave 3 high.
Today, I’m doing the rounds and showing the final pattern in a couple of e-mini futures markets and four equities indices (The NYSE shows a slightly different pattern, included at the bottom).
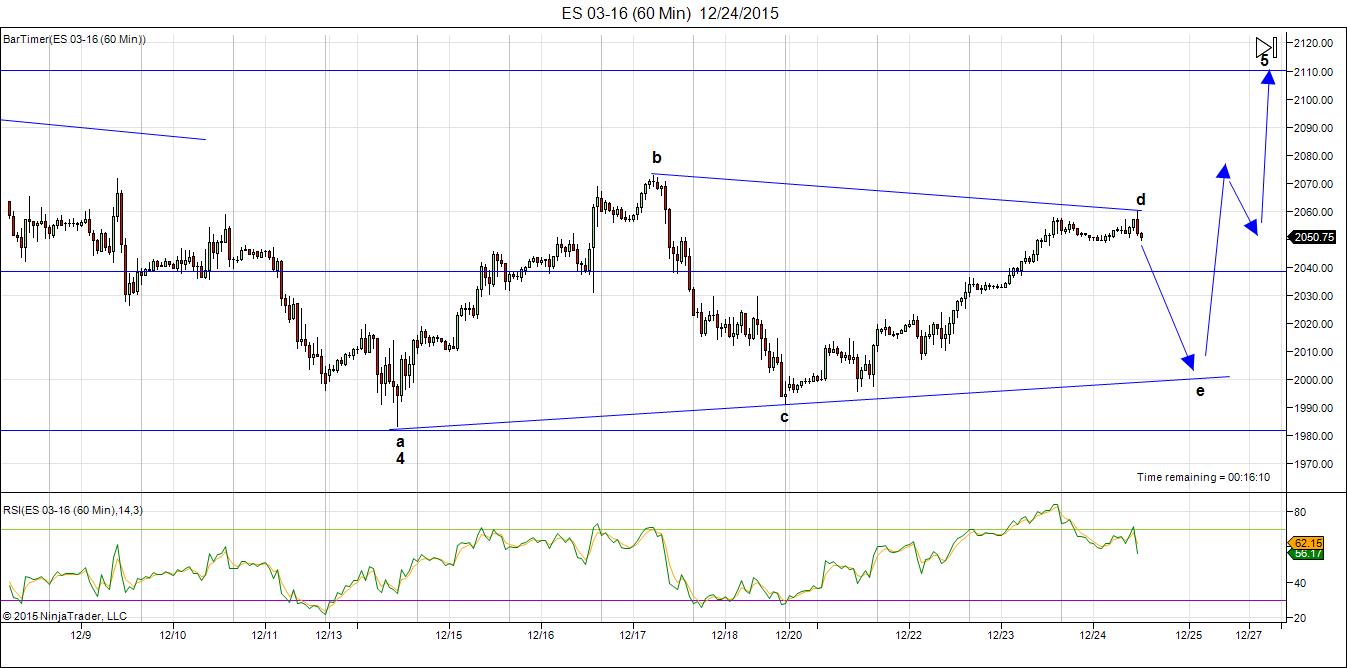
Here’s a 60 minute chart of the ES (SPX futures). This formation has been obvious for a couple of days now and with this morning’s action, it made the triangle more or less symmetrical.
The d wave up here is not a motive wave. After a close look at the b wave up, you can see that the final set of waves (the fifth wave) is actually in 3 waves. Much harder to make this distinction in the cash indices. But they all must move together, so I often look at them all to come to a conclusion when the waves are difficult to decipher.
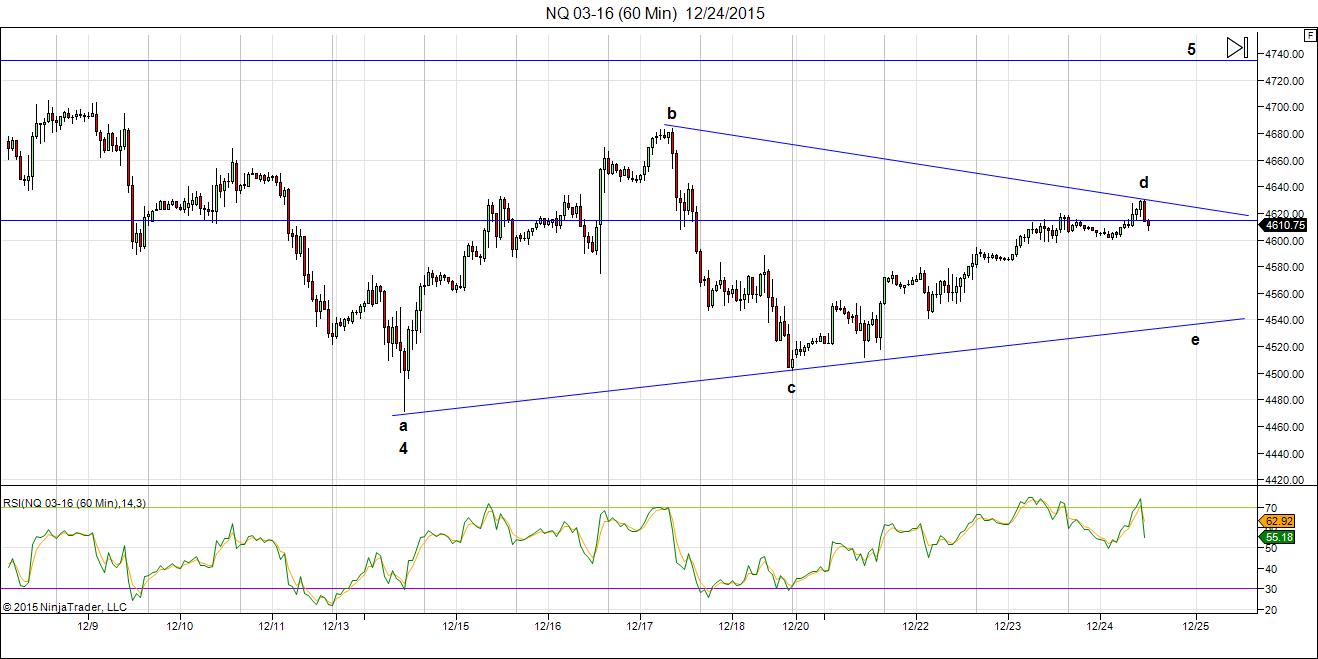
The 60 minute chart above of the NQ (Nasdaq e-mini futures) was out of alignment until this morning. Now we have a perfect horizontal triangle. I would expect the same action here as all the other indices.
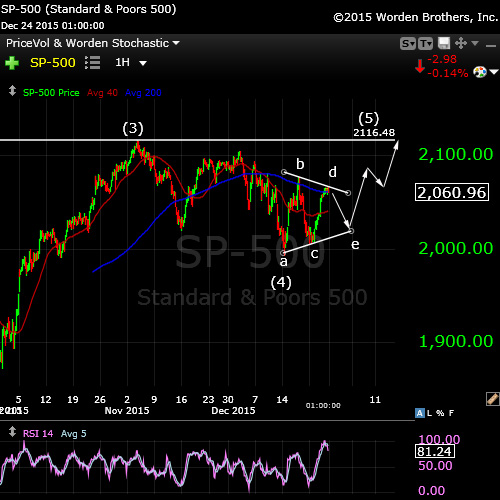
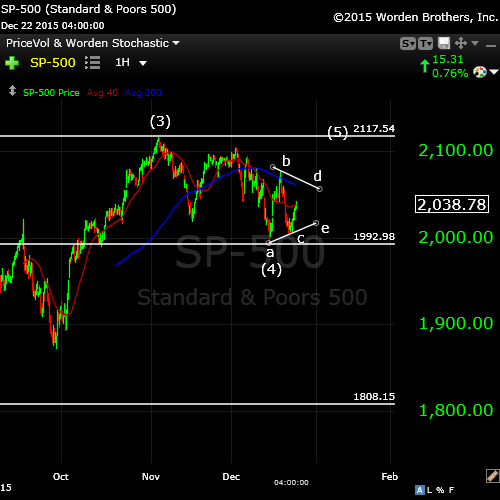
Here’s the updated one hour chart of the SP500 triangle I introduced last week. It’s now progressed to the point where we only have one more leg down before a final wave up. It also seems to line up now with all the other major indices. I’ve drawn in the probable path.
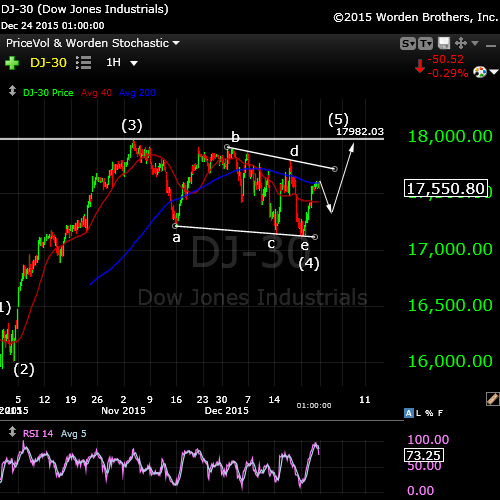
Above is the one hour DOW chart. This is the chart that seemed out of alignment with the others, but when you realize that the smaller triangles in the other indices require a leg down, as does this index, it puts them all in alignment for the final wave up to the top.
All the indices should be in alignment for the final wave up to the top and that’s what I’ve been so concerned about figuring out. I wouldn’t be surprised to see the top right at the end of the year!
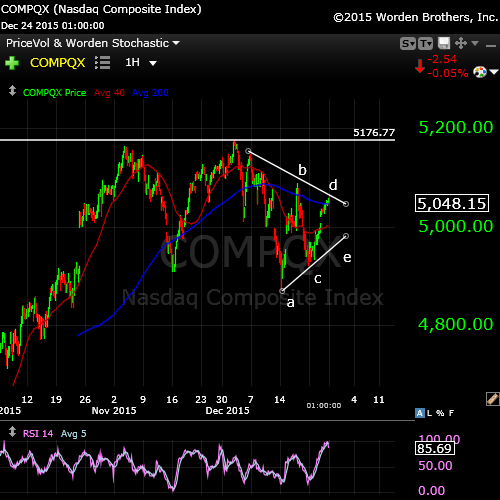
The one hour chart of the Nasdaq shows the same pattern unfolding. The Nasdaq has already topped, but it looks like we have a final top to go (likely a double top). I expect this pattern here to end up the same as the others.
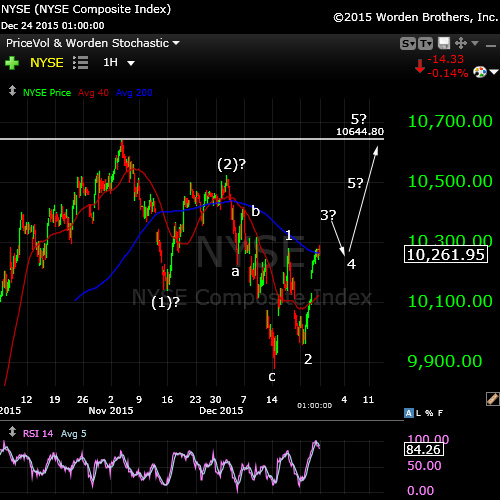
The one hour chart of the NYSE shows a slightly different pattern and there are a couple of options. I can’t tell if the wave down from the top in this chart is a motive wave or not. But there’s no question that the wave down from the (2) is in 3 waves, so it will retrace.
My preference is for the NYSE to do a double top like all the others. However, the third wave is short at the moment and so I can see a possibility of a double second wave forming (a move up to the same level as the (2) and then a roll over). Either way, the wave up should be in five waves.
Another interesting week shaping up heading into the new year.
Good trading, everyone.


Misc info worth researching
So whats really going on in Syria ?
check out this advisory board
http://genieoilgas.com/about-us/strategic-advisory-board/
GNE is the symbol
Joe
this is a test for Wouter
Sold out of my remaining shorts 2051, will be going long shortly. Good luck every one.
Noteworthy is the fact that the large cap index Standard & Poor’s 500 has never closed lower in a year ending with “5”, nor has it ever closed lower in the year preceding a U.S. Presidential election, and lastly, has not closed lower in the seventh year of a Presidency since 1939. If the S&P cannot hold this week the index is in danger of deviating some strong cyclical patterns that it has built and leaned on over the last several decades.
Slowly buying buying back some longs here at the 2047 sp level.
Good luck every one.
Sold full position long (2053) for a few points, waiting for a retrace to go back long. Good luck every one.
I added a chart of ES at the end of the day showing progress.
I added another chart of a possible answer to this count. We could be seeing a wave end as I count 5 waves up and there’s a possibility this is a flat, which would start to match some of the secondary indexes.
Wouter has been having problems logging in a comment. If anyone else is having a problem with that, drop me a line at peter@worldcyclesinstitute.com
Some of you are having problems posting comments. I don’t know what the issue is. I may have to take the site down tonight to work on it. I will let you know. I’ve been making some changes and may have caused a problem.
Hi peter
test here to see if your site working .
Id be careful shorting the market , i have sat the past few days out to see what the market does and leaving my mind open .
i am seeing a very similar market to the dec 1929 market its not exact
but extremely close . if so we will chop sideways fora few days and then
gap higher again similar to today . it would imply higher prices into april .
the overlay was created based on what martin armstrong calls his 8.6 year cycle , so i added 86 years to 1929 which is 2015 .
guess we will see soon enough how long this up phases lasts .
Joe
Some are able to post, but not everyone. I updated a plugin and my theme, so one of those is the culprit.
Not planning on getting short until I see the end of a wave and a motive wave down. We’re in a fifth wave, but this should be the third of, as per my post. It’s an odd structure. My measurements don’t show a top until 2091 SPX or so. Lots of underlying elements pointing to a top sometime soon, but don’t know how soon that is …
Joe, very interesting analyze with Martys info. How ever, I would agree with Peter for the very near future. We have a very good chance of reaching 2103 min as posted 2 to 3 weeks a go into year end. I personally will be finally selling out my core long position in the market here within the next two days. I feel like we will have some kind moderate correction in the markets from this Friday into the third week of Jan. Mark on your calendar Feb 25th time frame for a scare in the markets. Joe you posted I believe 2 weeks ago a Feb 25th as cycle high, I would be very careful that it does not invert on you. Good luck to you.
Wow, it got posted. LOL I thought I got kicked out of the site. Could not post earlier.
Yeah, well, I don’t know what’s going on. I’ll work on tonight.
We may get a huge spike up by Thursday 2122ish sp range. Either way, I will be out of the markets. (Long)
I finished the prep work last night but will need to take down the site today for a short while to do some maintenance. It shouldn’t be down all that long. Hopefully I’ll be able to fix the comments area.
We have a corrective wave down this morning, so we should be heading back up to the top (the first wave is in three).
I’m hoping I’ve been able to fix the comments issue.
Peter,
could you fix also this messy market.
In order to have some clear pattern.
It’s my New Year wish, please.
I just posted a chart showing that it’s a corrective pattern, of all things. You’re right, it’s a mess. I don’t give it very much longer. Maybe we’ll get a New Years gift early next week.
WHERE IS THE ‘LIKE’ BUTTON??? 😀
Hey! I’m not upgrading anything else ever again! That was the issue …
Peet!
If you can read this, you did it my friend! 🙂
Cheers,
W
Yay!! You’re back!
WOEHOEHOEHOEEEEEEE! 😛
I posted a new chart of this crazy market – top of the post.
Dave
Im not sure if i posted about a feb 25 high .
What i am seeing is is a feb 22 cycle low or high but i am tuning out the cycles at the moment as what is developing to me by a few indicators is an oversold condition . This is a multi indicator set up and at the moment it is
not set up which is why i have been sitting out of the market .
Today i see the advance decline line is 2 to 1 negative which is a bearish bias which is fine by me . the 10 day moving average of the daily $trin
is sitting above 1.40 at this moment yet this indicator is a close based indicator . a close today above 1.40 is the oversold condition yet not a signal . The 10 day and 5 day advance decline line are up near there upper ranges and have turned down . this combination is at best signalling a flat market yet for me i need to see both in an oversold condition to signal a stronger bounce so i sit and wait for the set up . I do see a trend change following feb 22 which implies an extended move following that date yet that is a bit into the future to claim its a big drop or even a big high .
there is more to it and until we get to that date im not going to make a great claim which it is . so tuning out the cycles at the moment and
watching the development with the 5 day trin sum the 10 day trin and the 5 day and 10 day advance decline line . at the moment i dont see anything worth trading unless i was to take a bearish trade but that is not what i see in the bigger picture .
Bottom line : im of the opinion that we are in a basing process at the moment and with more data comes a better view . a drop into the close
would cause what i call a trin spike and those when they happen can signal the end of a move or the beginning yet it all comes back to what typically happenns . a 10 trin above 1.40 gives an oversold condition
a close back below 1.40 after a close above 1.40 gives a buy signal and that buy signal does not give a sell signal until the 10 trin closes below 1.00 which in many times ends up going below .90.
the best set up though is when you take the trin readings and combine them with the advance decline line . the complete set up is not present and my thinking is jan 5th to the 15th the picture will be much more clear .
then i also include the 20 day oscillator on the dow which i calculate using excell because i have not seen any software that calculates it as i do .
When i get variables i sit back and wait . its just my trading style as id rather hold for more then a few minutes guessing . taking it another step further i use the wave count and the broader picture based on several indexes yet my main focus is on the dow because i have a very large data base that i have spent years with using various indicators for daily weekly and monthly data as well as what i call a 36 day chart , each bar being 36 trading days .
It takes time trading the way i do and when i get whipped around because i begin trading to much it, to keep it simple, pisses me off because i break my own rules .
we are at an inflection point as i see it and i am going to let the market
line up then act based upon my own rules .
i am up just over 100 percent on my account for the year yet it is a small account , i dont want to get lazy or stupid and give it back 🙂
Joe
By the way as i was typing that was the spike down i was watching for
note the time stamp on the above message .
Now ill wait for the closing readings
Joe
Weakness into the close today. Does this bolster your truncation theory?
Mike,
Aaah… great minds! … I was just writing someone else a note, which I will share with you here.
I think you’re going to find that the Dec 1 high (the B wave of the 4th wave triangle) was the truncation. Then we have a messed up first wave down, and now we’re in a second wave that will likely top tomorrow. It’s an ABC corrective wave and if you look at the NYSE, one more up with be a 62% retrace. That is my take on the market. So, if I’m right, get ready.
I’ll do a video later on tonight.
If the market has not truncated, and we are still in a 4th wave, then it would seem to be a wave that is impossibly long in ‘time’ compared to every other wave. It just wouldn’t ‘look’ right proportionally. It would mean that the 4th wave would be about 3 times longer in time than waves 1, 2, and 3 combined. Are there any rules in EW theory that address time? If not, humm…, seems like there should be.
Im Turning bullish as more of a position trade
expecting another 10 trading days or so of sideways trading action
if the market fails to break to the upside after that time frame
ill abandon my bullish bias .
Joe
I’ve added a “year end video” at the top of the post.
thanks for the excellent video
You are very welcome! The question now becomes “What is this wave down?” We had another drop in futures. They look to have dropped to the previous fourth wave. I didn’t get much sleep last night, so I may be a bit slow on a reaction this morning.
Currencies are very volatile right now.
In any event, the US indices will have to retrace at least 62% and they may retrace completely. I’m not sure right at the moment.
The cash indices look like motive first waves down to me. I put them just about at their end. We should get a retrace of 62% but not likely today. It will start today but take a couple of days to get there.
SP500 looks like it has to drop a bit still to 2049 approx.
I put the 62% ES retrace target at about 2060. I think we’re just about at the bottom.
Great video. Thanks. The black screen charts do not show well on my computers. I particularly liked that the video was concise and well conceived. Many others seem to be winging it changing as they can’t find the chart they just thought they should show.
Thanks, Kent. I only wish I’d clued onto the truncation a couple of days earlier. This wave down would have been nice to have. However, we appear to be on the way. I will post some charts of the expected path on the weekend.
Interesting you mention the conciseness. It’s amazing how many don’t “get” that—after training presentation structure for umpteen years, it became aggravating … 🙂 Less is more. I found even that video a little on the long side.
Really instructive video. Thanks and Happy New Year.
Happy New Year. Hang around here this coming year and it will be a happy financial one, if nothing else! 🙂
Great video. Helps me in understanding EW.
Have to make a decision on closing out my short prior to weekend, or not. Hate these super long weekends. I’ll be interested to see if the market comes under pressure from 1:00 to 3:00 est. Any thoughts?
The market should rebound right through the weekend. This wave up will be an abc wave to SPX 2068. I would expect us to turn down again early next week.
This is a second wave we’re in now. The third wave down (a long one) should start at the point I mentioned.
Steve-
Statistically over the last 18 years, the first day of the month tends to be one of the best days of the month (though prior to 1997 this was not the case). http://www.mcoscillator.com/learning_center/kb/special_market_reports/sp_500_first_day_of_the_month_tendency/
Aligning with elliot wave, i think a top on the first or second trading day of January makes sense,
This should be the end of the first leg up in futures, I think. A b-wave should correct from here.
Happy New Year, Peter,
so, you expect the c-wave to finish up around 2060 ES tonight ?
No, not tonight. Perhaps over the weekend. However, I’m concerned about this wave up in futures. Looks like a 3, which will retrace down …
Shouldn’t it be in three as it is corrective while the trend is down?
The overall wave will be in 3, but the segments (a and c) are usually in 5.
Peter-
Are you looking at a 2051 target for this b wave on SPX?
I just replied to Dmitri that I’m concerned with the look of the first wave up … so not sure.
Ted,
I’d be looking for a 2052 target on SPX for wave b. Nothing has really dropped enough to satisfy me that we’re done and I think we’re likely done for today. The market seems to have died.
Well,
it’s not a wave b as it has broken lower
Tidbits for the coming year. Gann called years ending in 5 as years of ascension. His financial time table said it would be a year of panic. The next two years as times of low prices. The Master Time Factor continued bull stk mkt, bearish commodities. The reliable 8-9 nine gold cycle due to bottom dec 2016 to jun 2017. The commoditiy bull market that ended in 2008 to 2011 started in 1897. It is a clear and elegant 5 waves up with 5th wave extensions. It is 5 of 5 of 5 of 5 not counting very small degrees. So how much lower do commodities have to go? The 4 of lesser degree is the 1999 low – a beauty of elliott wave. Generally that gives 50% more to go down. This larger scale commodity mkt is not due to bottom until around 2030.
Thanks for this, Kent—interesting info on commodities. Timing of gold works for me. I didn’t put the chart up today, but it’s bottomed and has done a small 5 waves up and three down, so it’s ready to do into a third wave. This will be a large B wave.
I certainly can’t disagree with your assessment of the commodity market. I expect demand to be low from quite some time to come. What are you using for your chart for commodities generally?
Why nor count the moves down from oct as 1,2 and another 1,2????
Roger, I saw that possibility as well. It looks like the way Peter counts 1-2’s.
I puzzled over this. I think you must be referring to the moves down from November 3 in the US indices. None of the waves down are motive waves, so they have to retrace—that’s a very basic EW concept. Motive waves are always marked with numbers and corrective waves with letters.
However, with a truncation, that rule would not necessarily hold. My fifth wave up (truncated) is a final wave in five and the first wave down is technically a corrective wave, although I’m labelling it wave 1. Perhaps the latest post and the video from a couple of days ago will help to explain it.
https://worldcyclesinstitute.com/the-tipping-point-2/
This website is for educational purposes relating to Elliott Wave, natural cycles, and the Quantum Revolution (Great Awakening). I welcome questions or comments about any of these subjects. Due to a heavy schedule, I may not have the time to answer questions that relate to my area of expertise.
I reserve the right to remove any comment that is deemed negative, is unhelpful, or off-topic. Such comments may be removed.
Want to comment? You need to be logged in to comment. You can register here.