
Update Wednesday Noon, EST
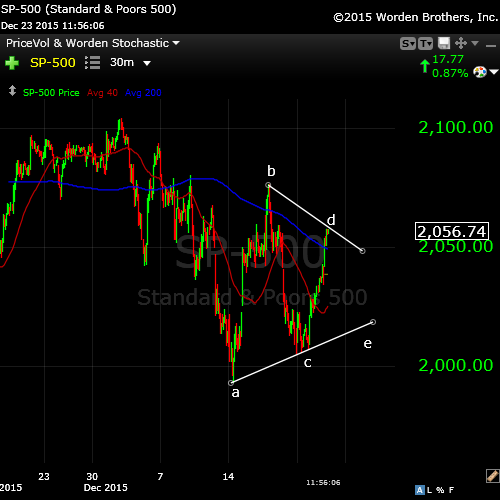
I’ve brought the triangle to the of the options (there aren’t many left).
Above is the one hour chart of the SP500. I’ve updated the potential triangle from yesterday. It’s a guess at this point and will require another day (at least) to confirm.
It’s relatively common to a have a triangle formation as a continuation of a countertrend pattern.
It’s certainly a sick market. And with the volume so low, we may just drive into the holiday
____________________________________
Original Post
Bottom Line: The equities market appears to have created a wave truncation, which means the trend has changed to down. If correct, after this first wave finishes (Monday morning?), we should see a retrace of more than 38% and then a turnover into a third wave down.
Here’s a video of where we’re at and what to expect over the short term. I’m still working out how to transfer the best quality to the web, which is a painstaking process. Make sure you set the quality as high as possible as per the note below the video. Let’s see how Monday and Tuesday go before I develop a more comprehensive prognosis.
 |
 |
Make sure you zoom the video to full size with frame expander (arrows) in the bottom right hand corner and also set the quality to as high as your web connection allows. This is an HD quality video so the best viewing is at that level. |
Holidays Market Schedule:
- US Equities close at 1pm EST, Thursday, Dec 24, open Monday, Dec 29 at 9:30am EST
- Globex Futures close at 1:45pm EST on Thursday, Dec 24, open Monday, Dec 29 at regular time
- UK Markets close at 12:30 PM London time, Thursday, Dec 24 and open on Tuesday, the 30th
- French markets close at 2pm Paris time on Thursday, will reopen for a regular day Monday
- German markets closed all day Thursday, Dec 24 but will be open on Monday
Summary of SP from Friday end of day:
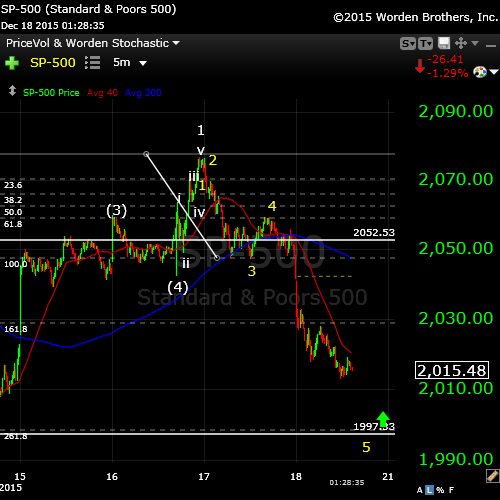
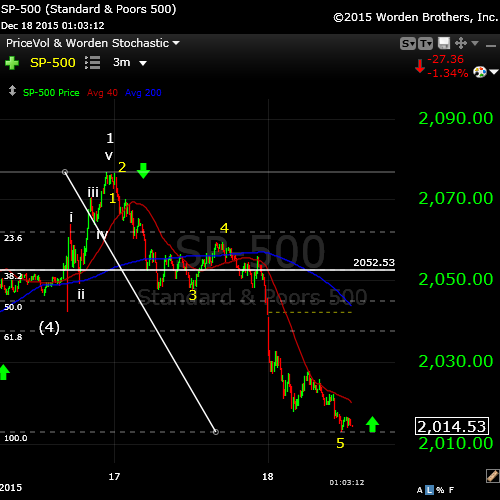
Above is the 3 minute chart of the SP500. (updated as at 1:30PM EST, Friday, December 18.)
Truncations are extremely rare but I’m leaning more to that possibility after looking at the cash indices today. It’s a major turn date and we have a very motive wave up yesterday (a full five waves). This could be the ending wave and it’s short of the target.
Today we are looking at a motive wave down. I count five waves in a typical first wave pattern. If this is correct, we would now have to rally to the 62% mark and then turn over into a third wave. I expect this wave down to terminate at about 1997 or a little bit below.
We watch carefully.
________________________
The Longer Term Outlook
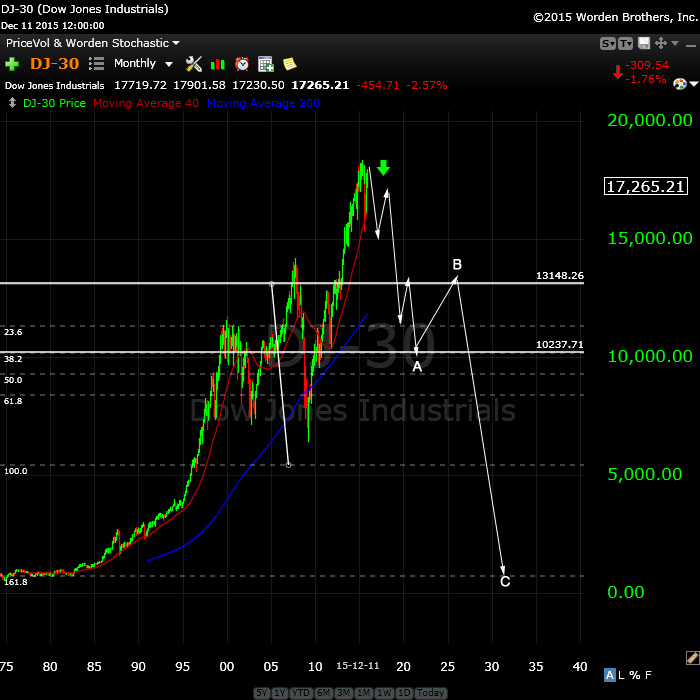
Here’s a look at my longer-term projection for the DOW (monthly chart). This is where I find Elliott wave amazing, equally with how fibonacci ratios act as guides to the future.
The longer-term prognosis is for a corrective wave (an ABC, 3 wave sequence) down to the previous fourth wave. The previous fourth wave was in 1974 at approximately $570.00. When you do the appropriate EW fibonacci measurements, you find that it leads us right to that spot.
Let’s take a look at what I mean: The A wave down (starting hopefully later this week) should take us in 5 waves to approx. 10,240. this length it 2.618 X the length the first wave down (not marked) from May 21. This measured move stops right at the previous 4th wave up, coincidently enough. Then we should have a B wave retrace of 38% at least, which should last over 6 months (at least the length of the second wave we’ve just completed) before a final C wave down of 1.618 X the length of the A wave. Again, that takes us right to the previous 4th wave from 1974 (a life changing move, no matter whether you’re trading or not!).
The Question of Seasonal Bias
The Decennial Cycle (chart below) that’s tossed around without a lot of thought is not a “cycle” in the true sense of the word. It a short-term phenomenon, or pattern, perhaps. It’s interesting that most charts only go back a few decades to make the case for a continuing pattern.
The chart above goes right back to 1805 so you can see the issue I have with this phenomenon being anything other than a short-term pattern. 2005, in fact was ‘flat’ or negative, depending on who you listen to. So far this year, the NYSE is down one percent. I find the reference to the “decennial cycle” lacking in any kind of credibility.
You’ll find the article to this chart here.
In terms of seasonal bias, Santa Claus and end of year seasonal rallies show even a spottier performance. On the other hand, as a contrarian, I would much rather see rabid optimism in the market, as we have now. In my way of thinking, it sets up the perfect scenario.
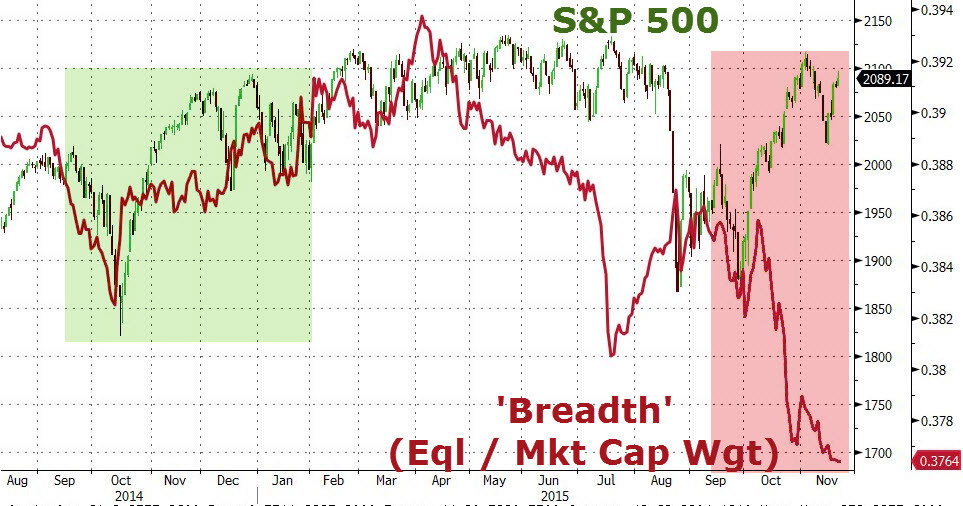
Above you’ll find a snapshot of market breadth, which continues to implode. This is from a zerohedge blog post.
Now on to cycles:
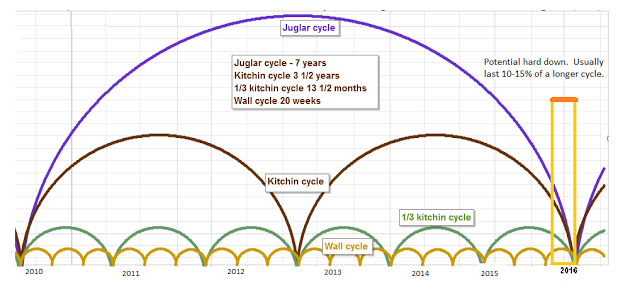
Here’s a chart of the Juglar, Kitchin, and Wall cycles which are harmonic. They’re forecasting a turn near the end of 2015 or very early 2016. More specifically, they point to the January/February time period as a bottom.
You can find this chart and a full explanation at http://swingcycles.blogspot.ca.
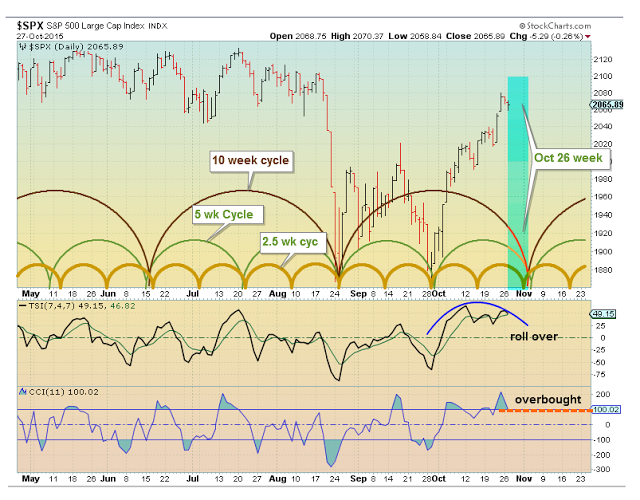
This is a similar chart of the recent past. You’ll see the end October/beginning of November forecasting a major top. In fact, we topped in wave 3 of C on November 4—a direct hit.
Andy Pancholi’s “Market Timing Report” forecasts December 18 as a major turn point for the month. I highly recommend it for its accuracy. You can find it here.
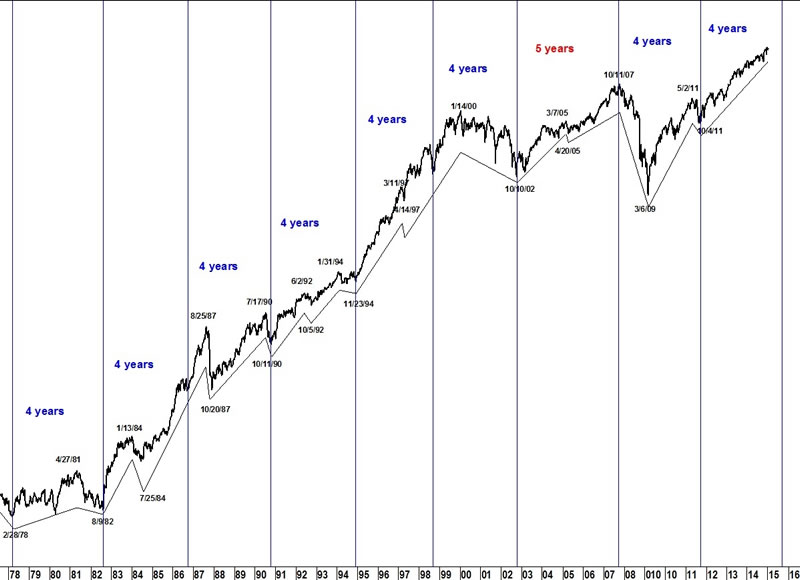
On a longer-term basis, here’s a look (above) at the 4 year cycle on the DOW. This cycles forecast looks to the end of 2015 for the turn. You can see how long-term and persistent this cycle is.
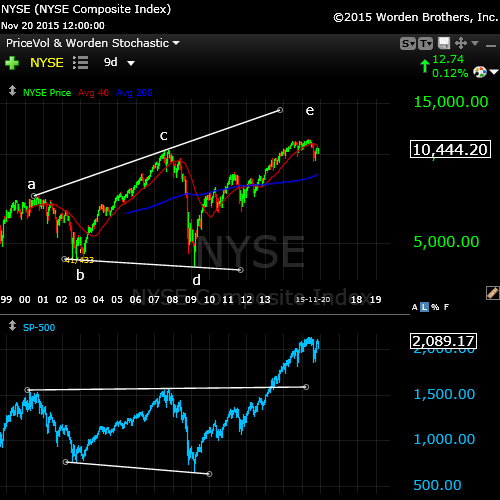
I was asked a couple of weeks ago about the broadening market topping pattern (well-known market topping pattern—not Elliott Wave related), so decided to include it here.
Above is the larger broadening top of the NYSE in a 9 day chart going back to 1999. This would be called an “ending expanding diagonal” in EW terms. It’s an extremely bearish pattern and seem to be failing in the final stages.
It’s interesting to me to note the difference in the NYSE as opposed to the SPX (lower blue chart). It speaks to the breadth of the market. It tells me the buying is concentrated in the big cap stocks.
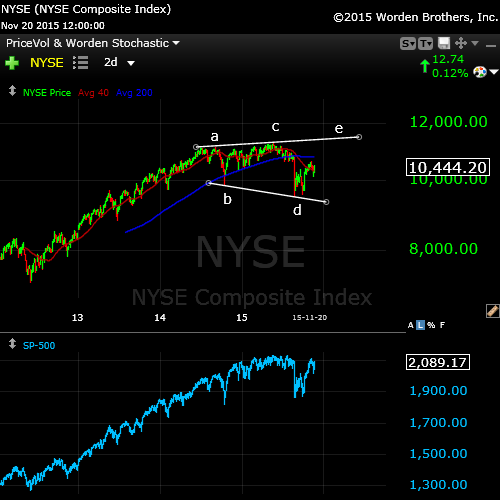
Above, we can see this same pattern on a short term scale in the final wave of the larger topping pattern. We have what appears to be a failing e wave in the NYSE 2 day chart.
There’s also a non-confirmation here, as well. with the SPX chart. This suggests the rally is narrow on even a short term-basis, with most of the buying in the big cap stocks.
DOW Theory (Transports and Industrials Non-Confirmation)
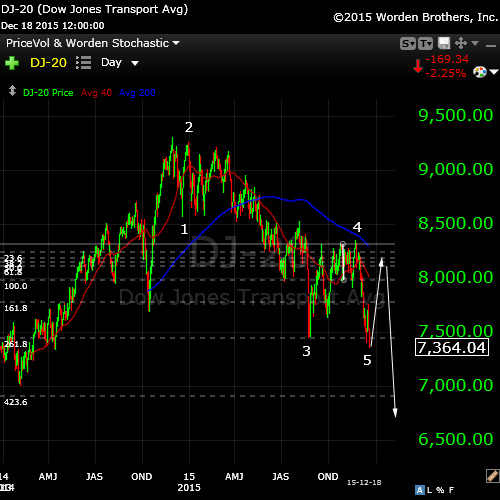
The Transports Index (DJ-20) is has traced out a short fifth wave (above). I expect a retrace either as a second wave of the fifth or to the previous fourth, before a longer fifth wave down. You can find background on the DOW Theory here.
For more confirmation, you can visit this article on the Baltic Dry Freight Index. Scary stuff!
Good trading!


video not working for me……
Sorry, it is working. Nice and clear! thanks
I had some messed up code which I just fixed, but I’m not getting it to play on windows so I may have to make some changes …
I will work on it.
Whitemare,
I changed the plugins so it should work OK on all systems now.
Awesome vid Peet! My hero!
I thought we truncated at your 4.B (end of Nov/begin Dec) but it was just a very large 4th wave ABC. Clear!
Cheers,
W
🙂
Great video….
🙂
We didn’t do exactly as I had though this morning. The outcome will be the same, though. We ended up correcting the three waves down.
We’re in the final wave down now. Because there are options here, I’m not positive about the stopping point. But we should at least pass the previous low (ie SPX 1993).
One potential stopping point i am looking at is the trendline that connects the Nov 16th and December 14th lows on SPX. Currently that is around 1986.
Wave 5 is 1.6 times wave 1 at 1975. It is likely to be the previous fourth, or a wave relationship. Wave 3 was exactly 1.6 X wave 1. Motive waves are highly accurate in terms of wave lengths.
This retrace is making me nervous. If we go above 2006 in ES, I think something else is going on. The wave structure is looking a bit odd
Sorry … above 2008 ES. I would worry then.
No… I’m getting confused with too many charts. ES 2006 it is. Above 2006 would put us into the area of the first wave and mean this isn’t a motive wave down.
a simpel seasonal low and then up again 🙂
I got out of the market until I figure out what’s going on. I see a possible triangle forming in the Nasdaq, and maybe we’ll see that in the other indices, but I don’t see it yet.
Possible rather obvious fourth wave triangle in ES and SPX, too. I’ll post a chart tonight of SPX. This would be the last leg (e) for SPX top about 2019 or so.
Sold shorts, long up into the 2040ish level. \Large short squeeze for the perma bears
I posted a chart of the triangle.
Today was a really unsatisfying day in terms of my count. We seem to have destroyed the triangle at the end of the day.
That means we must have bottomed in what I still think is a first wave down. It could have with the apparent ending diagonal but the fifth wave is short, even though the other subwaves measure correctly.
Of course, this could be due to the truncation, if in fact, that’s what we’re looking at.
Considering that the triangles aren’t valid, the next stop would be a 62% retrace. In ES, the target is 2041. In SPX, it’s 2050. We could also retrace just 38%, which would end up giving us another large wave down.
There are several options until we can confirm a first wave is complete. Then the fibonacci relationships take over and wave lengths become easier to establish in advance.
I wouldn’t be surprised to see a big dump tonight in futures ….the second half of the first wave down.
Cash and futures appear to be setting up to turn down at the 38% retrace level.
Euro/dollar should keep going until at least reaches the previous high at about 1.06 before turning down in a second wave.
A turn down here (38% level) would begin the fifth wave of the first wave down and would be good for a drop in ES to 1940 and in SPX to 1960.
Peter-
Anything that we should watch for that might change your opinion?
If it doesn’t turn down at the 38% level. But this is five waves up, which marks a trend change, so the probability is very high for the turn. The first wave down is also not a full wave.
Of course, at the current rate, it may not happen in my lifetime …. 🙂
Ted,
I added an SP500 chart to the top of the post.
Thanks Peter! The low volume and range of trading today had me curious. And based on how long this topping process has been you have prolly said that a couple of times.
The Nasdaq is lagging badly and it should also get to 38%, so that may cause the ES/SPX to head a little higher. Also the SPX has a gap at 2041, which I mentioned in the video and that might need to get filled.
Ted,
Bit of an exasperating day for wave structure. We didn’t turn at 38%. However, this wave up is corrective and the final wave down at day’s end is also corrective. It looks like the fourth wave. So we should get one more wave up.
So the question is where will it end? The gaps are now filled but we close enough now to the 62% level that I suspect that’s where we’re going. The issue I have is with the bottom of the first wave down, which ended in 3 waves. I am standing aside to see where we open in the morning.
The only other thing to keep in mind is that the 1.618 level for the drop doesn’t look like a good stopping point, so this next wave could drop 2.618 X the first wave which would take it down to about 1884 or so SPX. We should be able to figure that out on the fly (or in this case, the drop).
Nice call Andre on your up swing in the markets.
A bird in a hand is worth two in the bush. Taking 1/3 long position off. Close to 40 points. Did any one notice how bearish it was last Friday and Monday morning? That is when you have to hold your nose and press the buy button and let go of the shorts. Good luck to all.
markets are just testing support here late in the day before heading much higher. \I would suggest to hold off from selling here at the 2028 level. Bought back in my 1/3 I sold earlier. Go with your gut instinct’s NOT YOUR EMOTIONS.
Hi peter
it looks like we may have some kind of 5th wave tomorrow .
not sure if its a 5th of a 3rd or 5 of 5 .
a drop from tomorrow sometime iam expecting .
a sideways to down trend next week .
if that plays out id look higher into year end .
to soon to call it
Joe
I think we’re forming a triangle. If so, it will last until the new year. There are a few issues with anything motive. The wave down from Thursday has a fifth wave in 3’s. That would have been OK if we’d rolled over today at the previous fourth wave. We didn’t and now it’s not OK.
So, these waves are now all in 3’s, which means we have a triangle forming after the fourth wave. It also means we didn’t truncate.
Then there’s the DOW which went to a new low and therefore, complicates things even more, but I can still place it in a descending triangle. Otherwise, it’s out of sync with everything else. Tomorrow might give a clearer picture.
For tomorrow (or tonight), I’d want to see a B wave down on today’s leg up and then a C to finish what would be the C leg of the triangle.
This entire structure is also getting very long in the tooth.
Peter-
You have mentioned truncating twice in the last week, one on dec 16th/17th related to the fifth wave of larger wave 2 and yesterday as part of the bottom of a fifth wave of the larger wave 3.
Just to be clear, you are suggesting that the bottom yesterday morning was not a truncated wave 5, but rather part of a triangle in wave 4. You are still under the impression (based on the current chart) that wave 2 ended last Thursday? I am having difficulty seeing a triangle as part of wave 4 in the move down.
Never mind that chart answers my question.
Yeah, I knew this needed a chart. It’s been a real challenge to figure out this ongoing pattern.
EW is a principle based on probabilities. When I developed the truncation theory (admittedly, extremely rare), the triangle as an add-on to the pattern hadn’t occurred to me, although I knew the first wave down had a problem with the final wave. So … we’re pretty much down to the only thing left that’s possible … a triangle as an extension of the wave 4 pattern.
A triangle is always the final pattern, though, so if this is what’s forming, we can follow it along to a final high at 2116.48 (or slightly above) in the SPX.
Currencies (sigh) are so much simpler to trade right now. They’re doing what I’d expect.
I’ve added chart of the SP500 with the potential triangle drawn in.
Hi Peter
Thanks for the updated chart .
I can see what your thinking by that chart .
Ill look into it further tonight when i dig into the charts .
the stronger than normal rally makes sense from an indicator perspective since
we did see a rather oversold condition . as an example on yesterdays close
the 5 day trin sum was actually giving a more oversold reading than Fridays close
despite the rally . The indicator takes a somewhat insightful view at times because it is flawed but as a very short term indicator it has its merits at times .
4.00 is the overbought reading . all you do is take the daily closes for the previous 5 trading days including the present days close ( 5 days total ) and add them up .
4.00 is overbought and 7 to 9 oversold . 7 is a normal oversold reading in bull markets
and 9 tends to get hit in bear markets . Fridays close reading was 7.39 and Mondays
close reading was 7.78 todays close reading was 7.66 which is still an oversold reading over 7.0
how its figured .
closing trin numbers .
Monday last week to today :
Monday .51
tuesday .74
wednesday .95
thursday 3.53
friday 1.66 ( added equals 7.39 )
monday this week ( 5 days total = last tuesday to this day )=7.78
today tuesday ( 5 days total including today ) =7.66
this 5 day sum wont drop off until after we get past this week
since the Thursday and Friday readings are the highest readings .
Joe
The good thing is that now we’ve pretty much run out of options and a triangle is the penultimate move. So the end wouldn’t be far off and if the triangle takes shape, it will be a predictable ride.
I want to wish everyone a Merry Christmas. From a global finance perspective, this could be the last relatively merry one for a long time. Thank you Mr. Temple for the service you provide.
Thanks, Mike!
You’re right about Christmas being the best for quite some time. It could be even more interesting, depending on what happens today.
Have a great holiday.
More market shenanigans! The futures this morning have risen to the 62% retrace level. That suggests a third wave down from here.
Be on the lookout for a turn here. We would have to head down in a motive fashion to a new low in order for this to be the third wave. It would also mean that we indeed did truncate.
So, there are two options on the table:
– the triangle—chart above at the top of the post (although it’s tougher to make this work for the DOW). We would need a b wave down in 3 waves (but not to a new low) in order to consider the triangle
– a third wave down (although the first wave down doesn’t look quite right – it doesn’t break any rules but it’s shorter than expected and the individual waves aren’t of normal length). This would require all the cash indices to also get to the 62% level this morning
I’ll be around today so I’ll try and keep everyone updated in case it’s the latter.
That was one heck of a fight. I’d say this is looking a lot more like a second wave top than anything else.
I want to see these waves under the previous fourth SPX2034 and ES2030.
The fight was in futures.
So far the SPX is the only one of the major US indices advancing. Waiting for more clues.
I’ve updated the triangle chart at the top of the post. Volume is super low, so we might just be stuck with this for the near future.
Selling one third position due to trading rule # 101 ( Do not be greedy) sp 2059
Due to Christmas parties, sold out of remaining positions. I have no time to monitor the markets. Will be putting on some hedges here shortly. My feeling is a very helter skelter erratic market for the next few days.
Peet!
I am definetely going for truncation… I can’t make anything else out of it looking at Europe as well.
Cheers,
W
Wouter,
That’s what’s making the most sense to me at the moment, looking at what the euro is doing. I can’t really make the triangle work for all the indices.
The challenge right now is that all the indices are doing something different, so there’s no one count that seems to work for them all. We at least need one more top on the present wave in order to come down in a motive wave.
It’s a mess. However, it will give away it’s intent sooner of later …
Peter—Calgary Posted this morning. Gary (Denver)
http://www.zerohedge.com/news/2015-12-23/canadas-depression-surging-crime-soaring-suicides-overwhelmed-food-banks-and-worst-y
Gary,
Yeah, we’re going well, aren’t we? We were in zerohedge yesterday, too. But most people, though, think this is a short term problem. They’re mostly still in denial. The bubble in the housing market is more acute in Vancouver and Toronto. Once, they start coming down, all hell’s going to break loose.
On top of that in Alberta, we have a new young Premier (socialist-leaning) who’s trying to tax us for climate change and raise additional taxes for the energy industry. So, these are the bright days … unfortunately. 🙂
And then there’s our new, even younger, no-nothing Prime Minister who’s intent on photo-ops at the moment. Look out below!
You have yourself a great holiday. I think the fun in the market will start soon.
Peter—Happy Holidays to you and your family. Peace, Gary Denver
haha … “know-nothing” would be a better, more grammatically correct way to keep myself out of the same boat …
Double tops right here might just finish off this wave up.
A new high but I have what look like ending diagonals on just about everything – cash and futures.
Waiting for 2065 sp to be fully hedged with shorts. Good luck every one.
PS I am not looking for any thing to dramatic here in the markets. Possibly 20 – 30 drop
$ES_F $YM_F $IWM all are testing strong Res here at the weekly or monthly
If we go past 2058 with conviction, I will drop my hedges. Good luck every one.
Hi Dave,
I think that will be a good call
Stan Harley also mentioned the 22-23 December time frame for an important top.
https://www.equities.com/news/here-s-why-you-shouldn-t-be-long-equities
The bradley has a turn date on December 25 and the next one on Januari 6.
So good luck
Thanks John. I use to listen to Stan many years ago. For now in the markets, I am taking it day by day. I am not waiting for this so called huge market crash. While every one is waiting for this huge dramatic 200 point or more sp drop, I am consistently picking up 20 -40 points swing trades. Which have cumulated far more than 200 points. A lot of traders are shooting them selves in the foot with their shorts. When the actual time comes to go all short, those perma bears will not have to much capital left to take advantage of the move. Again, one must learn to go with their gut instincts not their emotions. Good luck John
Hi Peter
it looks like we have 3 waves up yet this 5th wave of 3 is an incomplete wave
17350 is now the support area im looking for if we get a pullback
sold out of longs and sitting out until the picture clears
Joe
I spoke to soon
wave 5 of 3 is now complete .
next wave should be a B wave or a 4th wave down
Joe
I believe you will be proven correct Joe. It should be a interesting few days in the market with lots of swing trades opportunities. The market makers will have a field day with these thin trading days. ( low volume)
Correct.
I can place the DOW & YM in a triangle, but it’s a descending triangle, unlike the other indices.
And if we’re talking fourth wave, because it went to a new low on Dec 21, the DOW is in a first wave while everything else is in a third.
So, I think the B wave is out. We can’t have a B wave if we’re going to the previous wave 3 high.
I’ll post a chart of a very large triangle of the DOW tonight. It would put us in the e wave. This correction would then have to be the 4th of the third. We’d need a fifth and then another 4th and 5th to get to the top, I think.
It will be a stretch, for sure. Right now, the third wave of the SP is way too short, so it needs to extend, otherwise the third wave will be the shortest wave. I certainly have lots of issues with the current structure.
Actually, Joe,
A large B wave would put everything back in sync (if the Nasdaq and SPX are in triangles). I’ll post these charts tonight (the SP triangle is already there). Bulls are at a 5% low right now, so we should continue heading up to the previous high.
Peet, André and all the other posters/readers,
Merry Christmas (since I won’t post tomorrow, haha)!!!
Cheers,
W
Yea, you have a great holiday. See you back in a few days, although I can promise much excitement! I’m sure now we still have to top. Didn’t get charts done last night but will over the next day or two.
to All,
Wishing you all a wonderful Holiday, to be encircled in the warmth and comfort of family and good friends.
May you be surrounded by family, sharing great happiness.
(PS – we have a house full and i LOVE it).
amb
Have a great holiday everyone!
When you get back, the next move should be down, but only in a triangle. I’m convinced that’s what we’ve got in all the indices and futures, based on last night. The triangle trendlines are all perfectly aligned now.It should be the e leg and then up in a fifth wave.
Peter
Have a wonderful holiday everyone…
Blessings to all.
Sold half position for ( shorts) at the end of day trading for a few points, enough for a case of beer for Santa. Will keep half for early next week, Good luck every one.
New post: https://worldcyclesinstitute.com/the-last-tango/
This website is for educational purposes relating to Elliott Wave, natural cycles, and the Quantum Revolution (Great Awakening). I welcome questions or comments about any of these subjects. Due to a heavy schedule, I may not have the time to answer questions that relate to my area of expertise.
I reserve the right to remove any comment that is deemed negative, is unhelpful, or off-topic. Such comments may be removed.
Want to comment? You need to be logged in to comment. You can register here.