Friday, during market hours -- chart updates
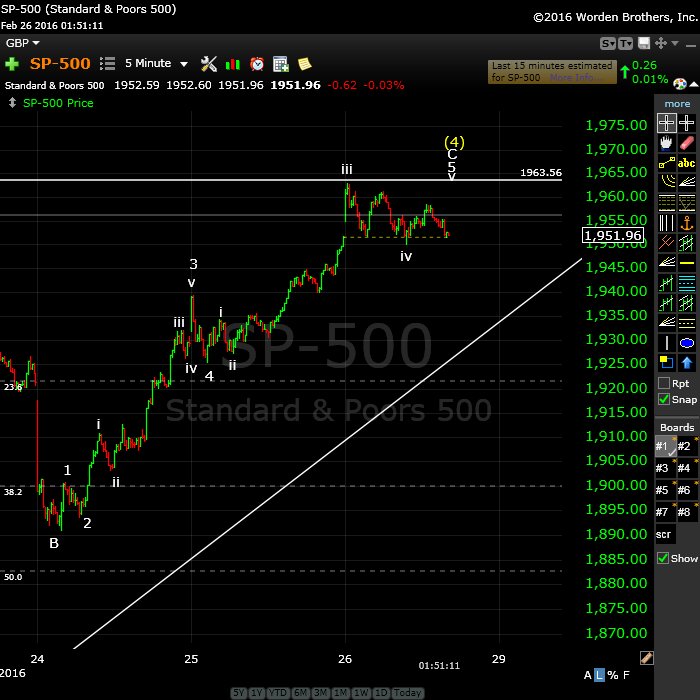
Here’s the 5 minute chart of the SP500 so you can see where we’re at. We’re in the final 5th wave of a motive wave up. 5 waves spell the end, but it’s not quite complete until we rally back up to this morning’s top. All the subwaves measure correctly. We remain patient.
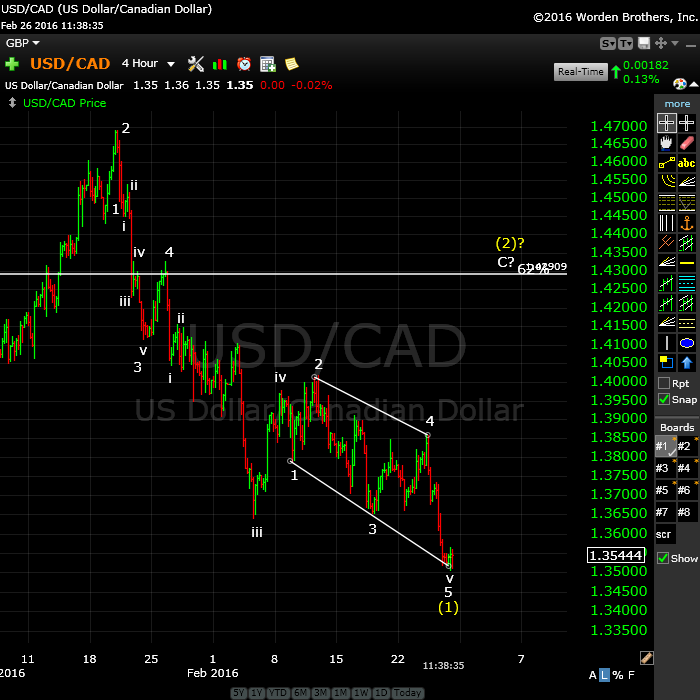
As a comment on this market, here’s 4 hour chart of USDCAD showing the inflection point we’re at, very much like the one for EURUSD. This currency pair should turn up to complete a second wave. Strange motive configuration (it’s actually countertrend) but it works.
________________________
Update Friday, Feb 26, Before the Bell
We’re at the projected target. I expect a double top this morning and we may see an opening gap reversal in the cash indices. Eur/usd has come back to what I also expect will be a double bottom. The EW preferred entry point is after 5 waves down at small degree and three waves up (a second wave). Good luck.
_______________________
Update Thursday, 1:40PM EST
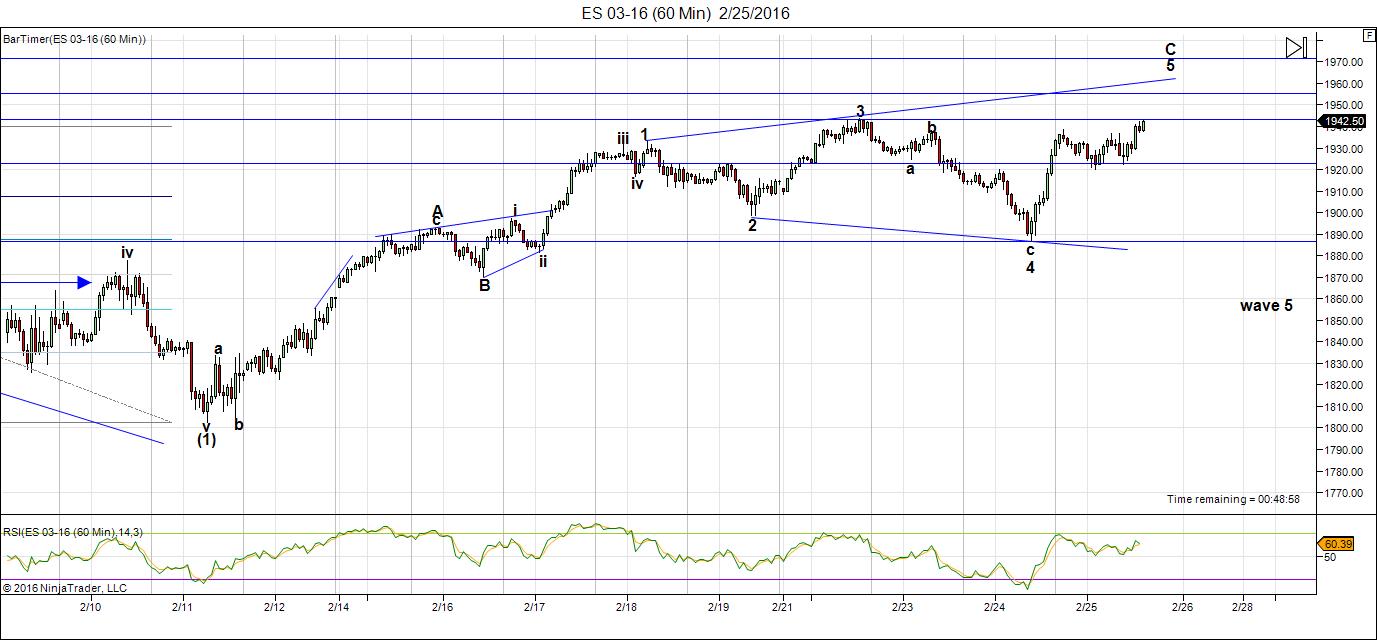
This 60 minute chart of ES is at approx. 3:15 EST, just before close. Because of today’s wave up, which has turned into a “3” in futures, the overall pattern has turned into an ending expanding diagonal. Extremely bearish pattern.
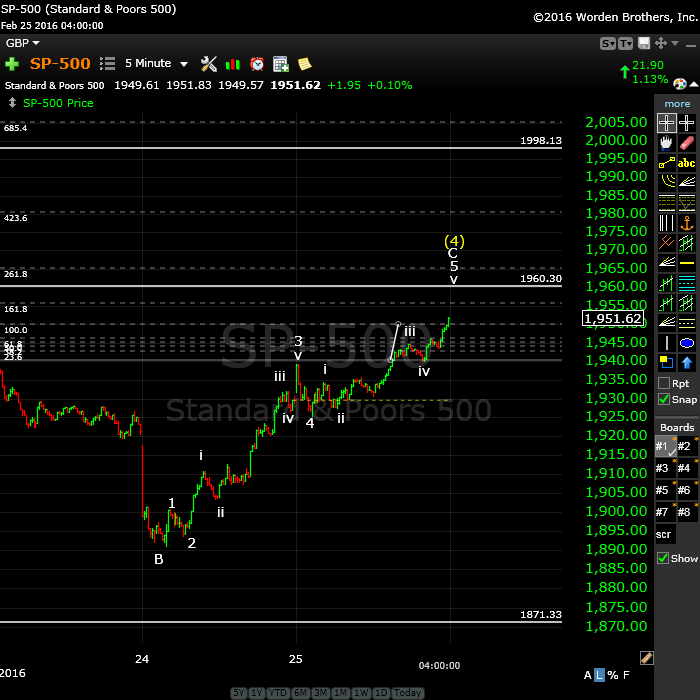
Above is a 10 minute chart of the SP500 (updated at market close)—showing the motive subwaves leading to a top after the fifth wave. The 3rd wave up was exactly 1.618X the first wave and if the fifth wave continues to its full length (1.618 X the first wave, as well), the target will be about 1960/1. It may not necessarily make it that far. I’ve renumbered the subwaves to more adequately match the underlying wave structure.
On the other side of the coin, eur/usd seems to have turned and is possibly completing the second wave after a motive first wave up. They should all turn more or less together.
__________________________
Update Wednesday Night, Feb. 24
As I write this tonight, we appear to be in wave 4 of this 5th wave up. If we retrace 38% and the final wave up is 1.618 the length of wave 1, the top measures to about 1955 ES. As far as SPX goes, based on the fourth wave ending at about 1925, I’m projecting a top of about 1961 (the fifth wave at 1.618 X the first).
_____________________________
Update Tuesday, Feb 23, After the Bell
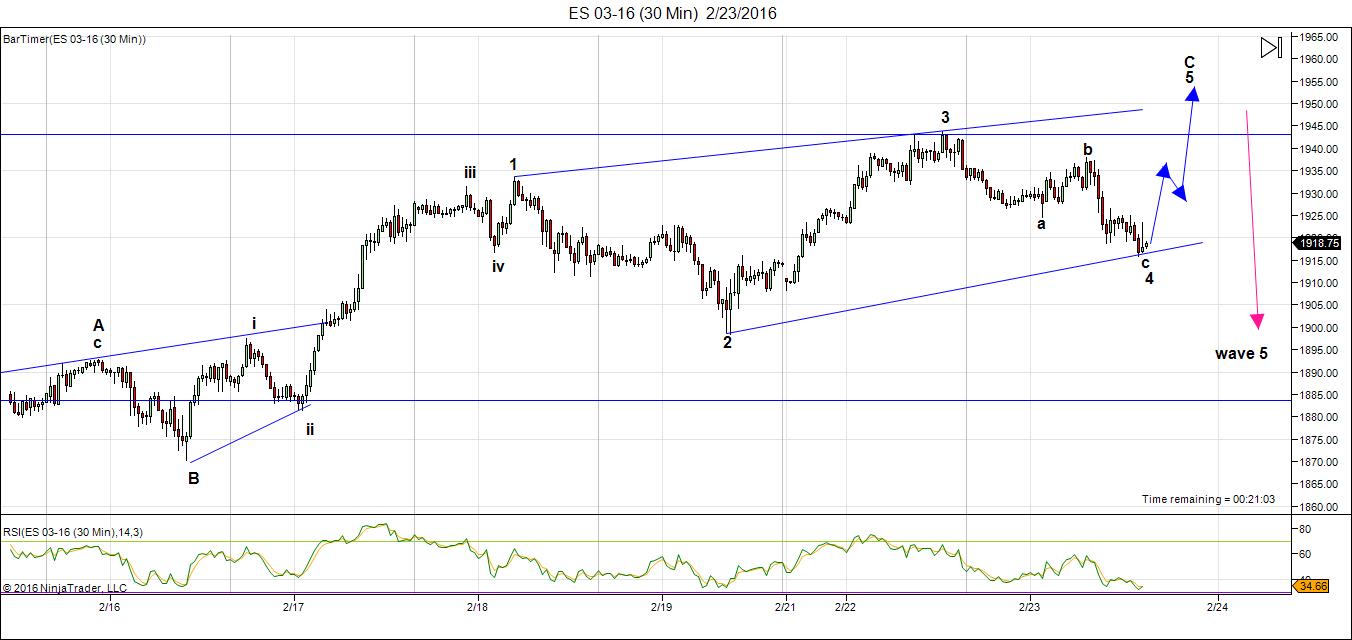
Above is the 30 minute chart of ES. This chart shows what I’m seeing in the futures markets and in the Nasdaq. The SPX and DOW are slightly different and may just be setting up for a top at the previous 4th wave high. All these ending waves are in 3s and this suggests the ending diagonal, which would head up in three waves with a likely overthrow past the trendline to a new high. They result in a dramatic turndown.
This should turn over tomorrow (likely) in the long-awaited fifth wave down of the much larger first wave from Dec 31.
___________________________
Update Feb 22 Before the Bell.
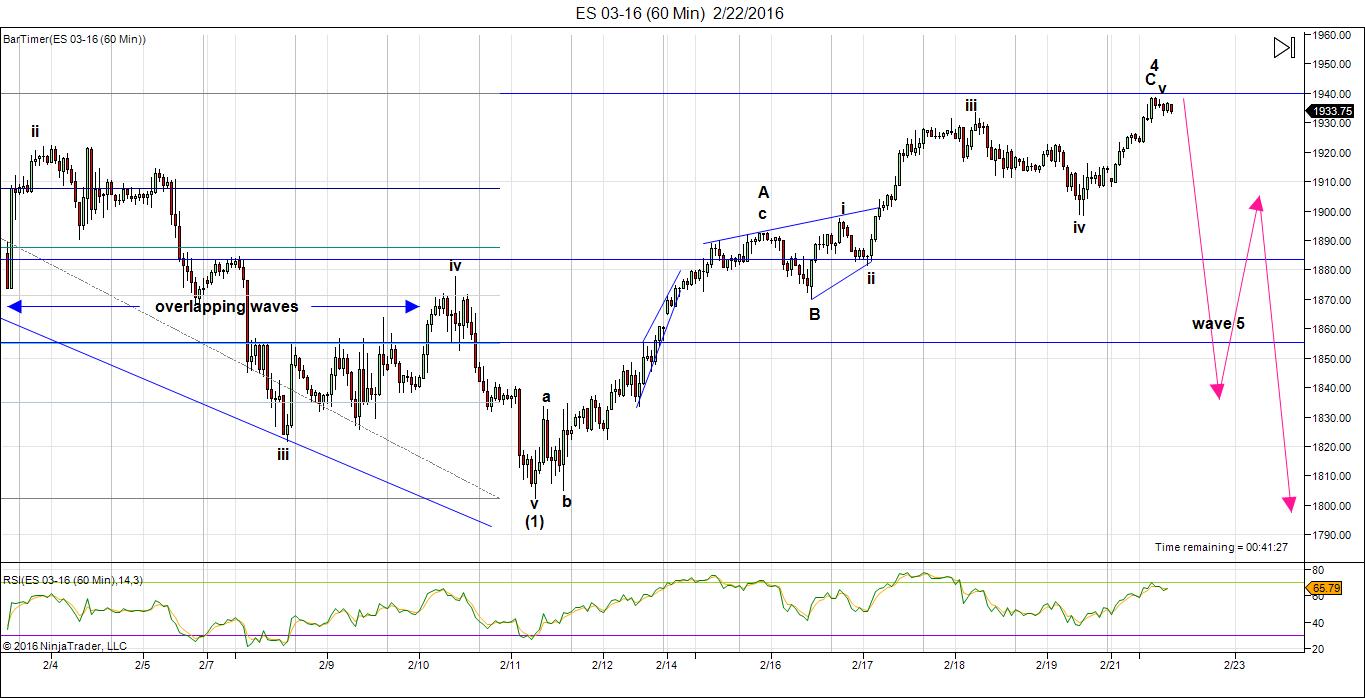
Above is the one hour chart of ES (SPX futures). Watch for a turnover this morning at the previous 4th wave high. All the cash indices, as well as futures, would have to make that previous high, so don’t get in too early. There is still the possibility that we go higher. However, we’re within the cycle turn forecast and have just about met the price target.
Note: The Nasdaq may not need to reach a new high as it’s the only one of the indices that could be considered to have completed 5 waves down.
Also eurusd is has reached its objective.
The safest entry point is after 5 waves down at small degree (a very small first wave and then a second wave of 3 waves up to about 62%).
____________________________
Original Post: First waves of a sequence are interesting animals. Few “wavers” get them right. That’s because there’s no written mention (that I’ve found) of the fact that they’re different than the rest of the motive waves in a sequence. They’re often mistaken for waves “in 3,” because without a careful and thorough look (right down to the one minute level), they look like an ABC corrective wave. They certainly have the same overall measurements. But … they’re in 5 waves.
You won’t find a mention of them in the Elliott Wave Principle book. But they’re real. I’ve watched them form over and over and over again during my 20K hours of watching the market.
First waves come in two parts. You get a set of five waves down (in a bear market), but they’re not quite complete. The five waves don’t measure out properly to each other in terms of their expected fibonacci ratios. It’s the fifth wave that’s the problem; it’s usually too short. That’s your clue.
That’s what we appear to have here. I’m expecting the other shoe to drop this week … to give us the fifth wave down to complete the first wave.
A complete motive wave to a “waver” is the holy grail. Because it tells you the trend has changed and that you can expect three more larger waves in the same direction, at least. And they’ll be highly predictable waves, because they always follow the same pattern. It’s only the first wave that’s the devil to get right.
My major cycle date is the second part of this week. I’m expecting to see us tag the previous 4th wave high and roll over into a fifth wave. That fifth wave should drop 300 points in the SP500 and over 2500 points in the DOW.
It won’t quite wake up the sleeping herd. It may give them a bit of a jolt, but they’ll go back to the party, because the second wave that follows is going to come right back up to where we are now and everyone will breathe a sigh of relief. Everyone but us.
Here’s a video overview of the market as at Monday, February 21:
Market Report for Feb 21 |
_______________________________
I’m providing only two charts tonight because the video pretty well says it all and the markets are all moving as one, so more charts really don’t add anything to the forecast. I will be putting long term charts in the Forum this weekend, so if you want access to those, you’ll need to join. The Forum is here.
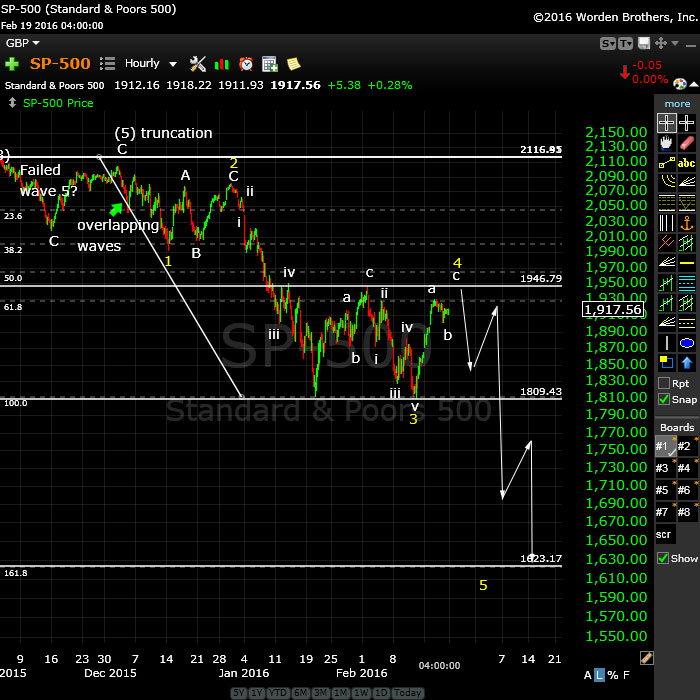
Above is the one hour chart of the SP500. The primary count shows us topping at the previous 4th wave high (about 1946-50). There is an alternative that will see us going a bit higher, to the 62% level, but that’s not my expectation at this point. That would be second wave, but I think the first wave needs to finish its work first.
Watch for another small leg down Sunday/Monday in futures and cash to at least the 38% retrace level before heading up to finish the current C wave. I cover this in the video.
The fifth wave of the first will drop substantially (and fairly quickly) to the 1620 (at least), before we get a second wave that will retrace right back to where we are now.
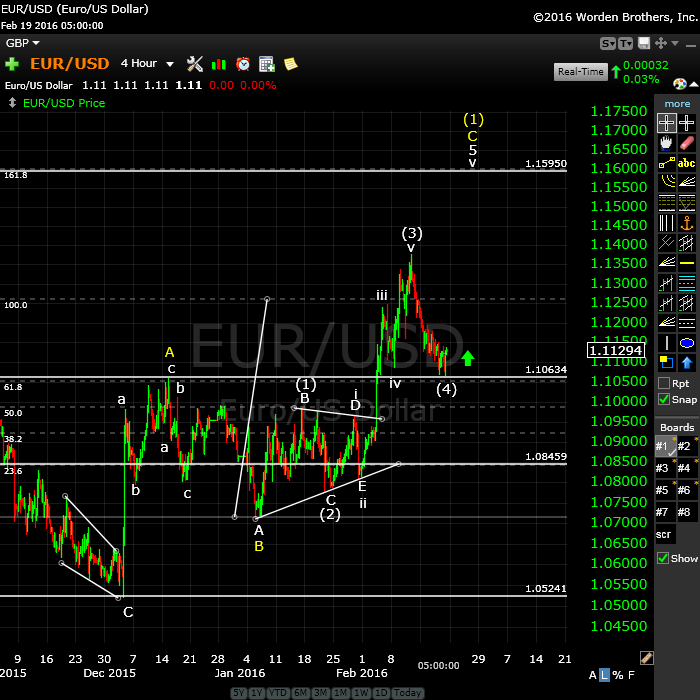
Above is the 4 hour chart of the eur/usd. It’s interesting that it’s an exact reflection of the US equities at this point. I also place it in a 4th wave. With the euro, as with equities, there’s the option of a second wave retrace. In that case the euro would drop to the 1.08459 region before turning up in earnest. The chance for that to happen will be when the equities trace up to the previous 4th this week. Otherwise, expect the euro to sit here a little longer.
The eurusd is in a countertrend (corrective) wave and I expect it to rise in the medium term, and for the dollar to head down. The longer term prognosis is the for the dollar to rise, but not until it at least retraces 38% of the previous large wave up, which it has not yet done. The euro is in the same boat, but in the opposite direction
Profitable trading!
The Forum
This weekend, I expect to flesh out the forum. You can join now. There’s a link to the sign up page in the menu at the top of the Forum page. I will create more signup links on the weekend. You can only post if you’re a member.
___________________________
History: The 1929 crash
I posted the 1929 chart a few months ago and now’s the time to bring it back to the forefront. I would expect a similar path moving forward.
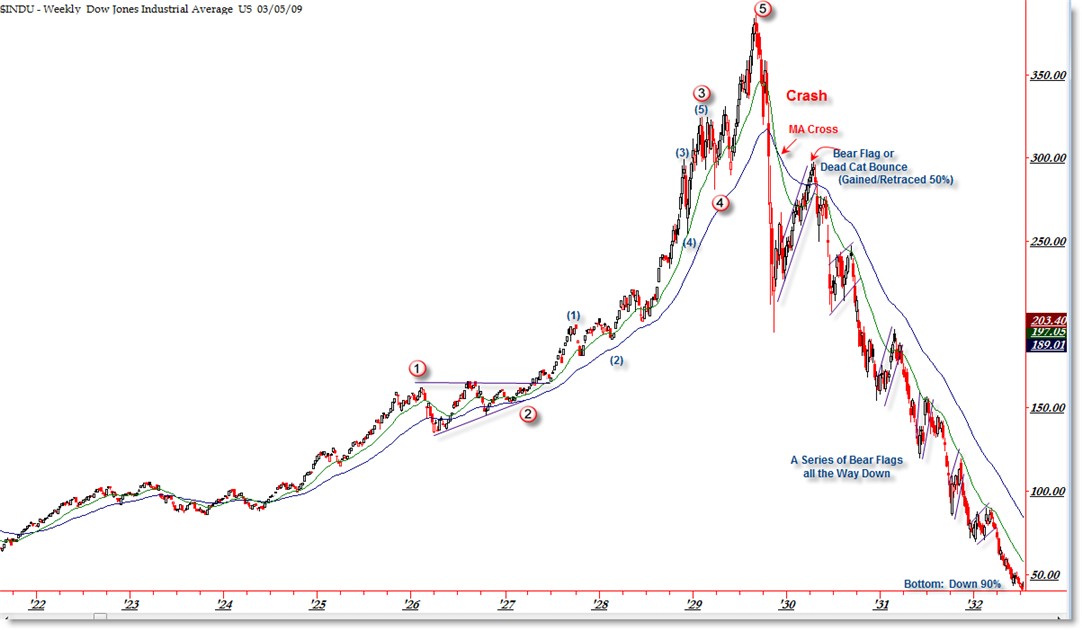
I think it’s important to look at 1929 and the wave structure (above and below), which was the same as 2007—to a point.
The wave structure of the 1929 crash was in 3 waves overall. There were 5 waves down from the top (the A wave) and then a very large B wave retrace. The final C wave down was a stair-step affair and lasted over 2 years.
In our current situation, we’ve had wave one down that’s lasted three months (May, 20, 2015 through Aug. 24). Then we had wave 2 up, which lasted from Aug. 24 through Dec 31, 2015 (approx. 4 months). I would expect the wave 3 sequence down (all the waves—the A wave) to last approx. 3 months. Next is the fourth wave (B wave), which should be at least 6 months, I think and then the final C wave to the bottom, which will likely last a couple of years.
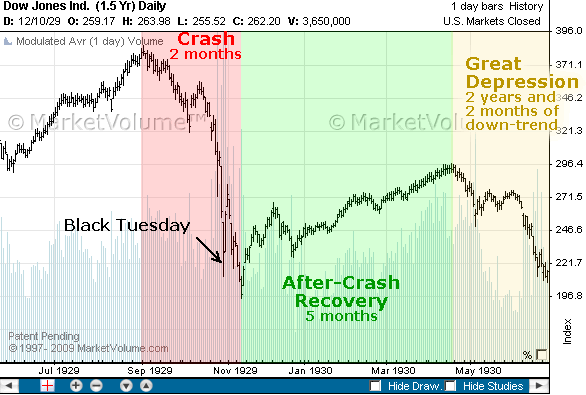
Let’s look a little close at the timing of the 1929 crash because the similarities to today are uncanny.
The market peaked on September 3, 1929 and then it took 2 months for the crash to actually happen (to reach the bottom of wave 5 of the A wave). The larger crash which we always hear about began on October 23, 1929. Then there was that large B wave, which lasted 5 and a half months and finally, the C wave which went on for more than 2 years. This might be the scenario we’re looking at going forward.


Last weekend I said markets had to go down. So they went up. And I was wrong. Or was I? Last week almost all of the gains were made in the future market, not in the cash market. Both in Europe and the US cashmarkets were flat after the gap up most of the week. If the herd is in the cashmarket, the herd wasn’t bullish at all. They must have read my analysis ;-). So, this rise was not caused by sentiment, it was technical. Very unhealthy.
Next, I was able to identify 2/17 as a major date, based on a long term natural square of nine. In this sqr9 2/17 is 90 degrees from the 5/20/15 high, This is very significant and should have brought a high. Gold made a low on Wednesday – as could have been expected. But the cashmarket finally went up on Wednesday when a high should have been set. Let’s call this a denial-rally. Thursday sentiment shifted again and remained week into the weekend.
Analysts that will tell you this move was strong are wrong. This move was unhealthy and screwed my forecast :-(.
Another major date I mentioned yesterday : 2/21. And this will be a capitulation point. So basically, the market is faced with 2 strong dates, 2/17 and 2/21. 7/17 caused a w3 of C high and 2/21 will cause a w5 of c on Monday. Gold and euro are up -as was to be expected and should peak 2/26- a date I mentioned before.
This weekend we see the full moon 90 degrees from the galactic center. And heliocentric Mercury forms a T-square with Jupiter and Saturn over the weekend.
Just remember that 2/17 was a really major date that the market had to test. This a long term natural date, coming from he heliocentric venus/Jupiter cycle.
So, the herd is already bearish, as my analysis last week revealed. Because the turn is so significant future traders pushed the inevitable ahead for a few days. But this can last only so long. Maybe this was just stop hunting to shake out weak hands; something you always see before major turns.
Prepare for a major move down. April, here we come.
Cheers,
André
Hey, your timing is getting better—you’re the first comment at the beginning of my post! 🙂 Thanks, as always.
Yes, we’ll see a major turn very soon. But we can’t go down until we see a motive wave and we don’t have one yet. We need a top … it’s on the way.
Thanks. Monday at the latest. Europe will do the w5 up but given the heavy downforce it will be weak. W5 can take many forms, but you are the expert on that. Anyway; next week will be volatile. Tomorrow I’ll give some more arguments why 5/21-22 is so important.
Cheers.
André
Actually, wave 5 can only take one form. It’s corrective waves that can take many. 🙂
Dear Peter and Andre,
I have read and subscribed to many newslettersand I dare say both of you are about as good as it gets.
The key difference is that both of you stick your neck out for your forecast and there will be be times when things are not exact but it is about there but there is nothing wrong about being missed 1 or 2 weeks , winter could have started in cash but not in futures or vice versa.
It is like trying to forecast which day winter started….
So keep up the good work and like I say I am a strong believer in both of you.
EWI Precter forecasted major bear turn dates in Nov 14 with 5-6 pages of theory and it blew.
Precter is still good but no one is perfect.
So guys, like I say both of you are about as good as it gets.
Vince
Thanks for the kind words, Vince. Well, we’re not making many bullish friends, at the moment … 🙂
Peter–In his latest letter, sounds as if Prechter is leaning bullish indicating on the blue chip indicies a triangle in progress or a completed flat or zig zag correction? Gary (Denver)
Hi Gary,
I’m in a meeting this morning, but had to go look anyway (didn’t know the Theorist was out). First look, I have a challenge with the triangle idea (it’s not currently a triangle). I’ll take a closer look a little later today at the flat idea, but that requires 5 down (and we don’t have that, either).
It’s not making much of an impact on me at the moment …
Thanks—interesting idea. I’ll check it out further.
Gary,
After looking closer, I don’t “get it.” It’s neither a triangle nor a flat consistently on all the indices. Interesting idea, but I can’t make it work. At the very least, we’d need to go to a new low to create a flat (3-3-5 configuration) but that would likely create a first wave down. I don’t understand where he’s going with this …
PLUS … the most recent wave up is not motive, so it has to retrace to a new low … hmmmm.
First down now into 3/4, in 3 waves 2/26 low, 2/29 high 3/4 low.
andré
Peter,
I think “Chasing the Maverick” would be the best title for this post.
http://streamcomplet.com/chasing-mavericks/
Peter – heard your interview Friday. It was really good. Like most interviewers, like on CNBS, you were interrupted often, but you held your own and made really great points. Other rub – it wasn’t nearly long enough. Toward the end I was wanting more and more, but times up! Good job! Left me wanting more!
Thanks, Charles, for the kind words. Well … there’s lots more. I think Dale wants to continue the conversation. Hope so. I see you joined the forum. I hope to dump in some starting info this weekend and make it a place where we can all learn from each other. Thanks for getting on board!
Nick,
If you read this – I’ve sent you 5 emails from different addresses and your mail system is blocking them all, so that’s why you’re having a problem with joining the forum. Something going on with your carrier (AT&T).
thank you peter,,,nick
Peter,
No fixed forum link on the site? Decided to give it a try but can’t seem to find a link. Am I missing something?
André
Sorry, I’m working on this today. It’s in the menu on the forum page (forum signup). I will add a button in the sidebar today. I’m adding some info to the forum itself for the remainder of the day.
Some background to my outlook.
In the square of nine on the 2011 low we find 2/21 on 180 degrees. As 2011 was a low, 180 degrees should produce highs. Looking back this works most of the times +/- one day.
6/22/15 was a significant high (one of the notorious triple high). 180 Gann days further we find 3/9. Again, 180 should produce a low. This is a very heavy date and will pull down the market. We also find a total solar eclipse one day earlier and the anniversary of the 3/6/2009 low 3 days before. So my expectation is a low on Friday 4 or Monday 7. Lunar declination is headed south into 3/3, supporting this expectation.
Further ahead we find the 1800 gann days from the 3/6/3009 low by the end of april. As 1800 is 5 times 360 this should be a low.
After the early march low we’ll be up into the strong 3/26 date, when Saturn turns retrograde. And 3/23 we have a lunar eclipse.
This will be a strong pull back but after that we are down again. Next weekend I’ll give the in between dates.
Cheers,
André
The turn will come after the close. Europe will start the decline into Fridaynight.
Andre
Which of the turns are you referring to here Andre? mentioned quite a few dates so i am a little lost.
That would be the turn 2/22-23.
Cheers,
Andre
Monday, March 7 would be an interesting date for a low…Tuesday, March 8 is a Berg Astro Indicator day (they often mark changes-in-trend)…Thursday, March 10 is the next Governing Council of the ECB meeting (the prior meeting was January 21 and we know what occurred the day before)…March 15/16 is the next FOMC meeting…
Fifth waves (of the first wave) typically fall quite quickly, so these dates are certainly viable. Then we will have a second wave that will come right back to where we are now. At the bottom, I would expect central banks to react in some way to get the second wave back up. Will be watching for that.
However, I’m not going to speculate any further ahead than that. I want to see a complete first wave first, as it confirms the direction.
Peter, et al: Would certainly appreciate your count for the 10-yr yield (e.g., http://stockcharts.com/h-sc/ui?s=%24TNX) .
Paul,
I’m not going to be much help on this, based on its current position. I had to go to a quarterly chart to see that it looks like it’s in a corrective wave. When it ends is a guess. I would be looking for a double bottom at some point and would expect it will test $14 but beyond that, not much info. RSI divergence is not severe so not much of a clue there, either …
Peter-
With futures on the S&P 500 approaching 1940 already, does this change the probabilities of any of your scenarios? I see the EURUSD Low of 1.1062, so it seems to still be in the realm of the 4th wave for the equities.
No, this is exactly the scenario I’ve been forecasting.
🙂
At this point tonight (4:30am EST), we’re looking very good for a morning turnover. ES is rallying in 5 waves (it’s an ending wave we want, so this fits a high at 1940-45 or so in ES).
Still I wonder, your wave 4.C is done now or my wave 2.A… I am still in doubt!!! Well, the coming 1-2 weeks will guide us. If we go super low we know it is the 1.5. 🙂
Cheers,
W
I posted a chart of ES at the top of the post.
Both Wednesday and Thursday show tidal inversions. So a low and a high. The basic force is down into Saturday but 2/26 is a powerful gann date. So I expect a low Friday night. 2/29-3/1 show confluence in natural timing and will cause a pull back. After that it is down again.
As we are still heading for apogee 2/27 the downforce is limited this week. Next week will be more volatile.
Still think 3/4 will be a low but the final low may come as late 3/9 before we get some serious retracement into the last week of March.
In other words; I agree with Peter 😉
André
Thx 🙂
I think SPX is targeting 147.20
No idea where that number came from … try 1947.20
CAD is almost at a double bottom and AUD at a double top.
I hope Peet will be right because hat would clear up everything! And finally that DAMN first wave will be done than. 🙂
No worries; within the next 12 to 14 hours everything changes.
André
Hi André,
I love to read that you are so confident in that prediction.
It is a pitty that Joe is not arround anymore he also made some good bottom calls.
Anyway Mahendra is getting bullish for 3 months after March 4 at the latest he sees new highs for the indices..
Strange world will see what will happen.
So now I wonder John, do you believe Mahendra or is Peter (in combination with André) on the right track in your believes? I believe Astrologers can do very good in the markets (André is one I guess looking at his Gann/astro knowledge), but new highs??? 1987 Scenario that would be right…???
Personally I don’t believe in that scenario because the markets are hurt to much and the ECB/FED cannot save them! More important: EW and cycles are telling us…….
Like to hear about your vision for the coming months!
Cheers,
W
And yeah, where did Joe go??? 🙁
Joe works offshore on a boat and so is often “out-of-touch” so that may be the extent of it.
I put NQ and YM near the end of ending diagonals.
Ending diagonals seems to be forming everywhere now. I still count one more small wave up.
Ty for the update Peet! 🙂
Have you considered the forming of an expanding triangle in the S&P 500 (since triangles are common for W4 right)? In that case it will take even longer before the 1.5 wave ends. 😉 Or am I talking crap now? 🙂
Cheers,
W
I have and don’t see one. I think SPX just has a final 5th wave up. Not sure exactly what it’s doing at the moment, but the wave down is in 3. Looks right now like a 4th wave.
The Nasdaq could have a first wave down on the 1 min chart, although it may be a fourth wave (NQ looks like an ending diagonal with one leg up to go).
We’re so close to topping. We technically could start down tonight because the second wave will come right back up to this area and will likely fill any resulting gap from a slide tonight. I’m not sure what we’re going to do if we top at the end of the day (or for that matter, what we’ll do if we don’t …). We may just hang in here until the morning …
My primary target for SPX is still 1947.20. But if this fifth wave extends to its full length (1.618 X wave 1 of the C wave), that gives me a target of about 19961, which is at about the 50% retrace level.
It looks like tomorrow will be “the day.”
Boy, I’m good with numbers! 1961 is that secondary target.
Peter,
We are still in line with Jan/Feb 2008 almost exact last bottom Feb 11, if it continues we will top at Feb 27 after that the sell off..
There was a fade though from 2/20/08 HI $137.60 to 2/22/08 low $132.86 which was slightly higher than the 2/7/08 low 131.73. I’m going to wait to see if the hi today can be retested tomorrow before I short. Probably the 24th is the safer day to short.
Could be we are close Bradley has a turn 24/25 and Alphee too
Good luck..
My cycle turn is 23-25 so we’re a little early. We will definitely retest because the most recent wave down is in three and we don’t have a full 5 up. Wait to short.
The previous fourth wave is one of two points, the higher one being the 1961 number I mentioned. That seems to most likely target now.
That’s the SP500.
Liz, great minds think a like. Lol I have that precise day at the latest to short going into the first few days of March. good luck.
Dave, at the latest? You’re thinking of the 23rd? I just looked at the SPY 60 min chart including the extended hrs, there seems to be some symmetry with the price action on 12/24/15, 12/28 & 12/29 with 2/18, 2/19 & 2/22.
Thank you Peter for the possible 1961 price target.
LizHM,
Deep retrace but I think it’s over (based on a turning eurusd). My targets have changed based on this morning’s action. SPX 1950 and ES 1947. eurusd should target 1.085 (second wave retracement).
I don’t think we’ll hit the target today. Tomorrow is more likely, which hits my cycle turn date exactly.
Nice observation LizHM ,
Let’s wait and see
I think the second shoe is dropping Peter would be surprissed if we rally again but everything is possible..
No, I’m expecting a rally. We’ve completed the fourth wave. We still need to make our targets and I expect them to be met tomorrow.
In fact, this was such a deep drop, that it suggests the possibility of a longer C wave, but as I’ve explained before, I think we have a fourth wave here rather than a second wave.
Apparently today was the second slowest day of the year so far in volume.
My expectation now for the Nasdaq (after today) is that it will also extend the fifth wave to full length. 1.618X the first wave takes it exactly to the previous high at about 4640.
I’ve posted a 15 minute ES chart at the top of the post.
I’m being challenged to figure out exactly what we’re doing at the moment. Both the Nasdaq and SPX have retraced exactly 62% of the previous wave up. However, this doesn’t look like a motive wave to me and it’s coming down way too tentatively (and doesn’t measure correctly).
It’s looking at the moment like a b wave, but it’s messing with the targets I mentioned. It’s also dropped into the area of the previous first wave and is suggesting a longer wave up, so maybe we are heading towards a second wave …
I’m still expecting a rally, but not sure now where it’s going.
An ending diagonal is an option, and maybe I should put that at the top of the list, as it seems to be the most common wave ending, given recent history (although not usually all that common …). If so, I won’t have a target top, but this rally wave would go up in three waves to a new high.
I can make it work for the futures and Nasdaq, but converging lines is a bit of a problem for the DOW and SPX (I don’t think these two have travelled into the area of the first wave, so we may see them just head to a slight new high. Hard to say more without more clues.
I just posted a new chart of ES showing the possible ending diagonal.
The final moves of the session reinforce the DOW and SPX drops as being in three waves. We should have one final move up to the top, based on this and the possible ending diagonals.
Peter,
I didn’t wait for 1961. Based on various povs posted last night, I just bought weekly spy puts after the open and sold them when they doubled. I hope mkt goes up again tomorrow so I can buy cheap puts again. 🙂
ES closed the Feb. 19 gap 1914.25.
LizH,
Yeah, it’s going up … should be the last time for a little while. eurusd is in a large 4th wave triangle, so it’s heading down tonight (opposite equities, as usual). Futures are just beginning to turn. Everything’s lined up.
I’m looking forward to having a motive first wave behind us. 🙂 This one’s been a bugger.
We’ve come down enough that we’re not in an ending diagonal. ES and NQ look like fourth waves … so far. Still down in 3 waves, so somehow we need to properly top.
No new top; just consolidating in time. 2/26 strong date as mentioned before; is pullling the turn a bit forewards. Tomorrow around noon in europe the downtrend resumes and now with more force. I think.
André
At times, I honestly don’t know why I try to teach EW.
Don’t worry, Peter,
we appreciate a lot your effort and try to learn.
Absolutely : )
Sure appreciate a lot Peter but Gann is also interesting
Dimitri,
5 waves up. I know you know what that means. 🙂
Wave 2 target: 1896, Wave 3: 1932. I thought I posted this but my comment seems to have disappeared.
Wave 2 ES target: 1896. Wave 3: 1932. My measurements, anyway.
5 waves up morphed into what looks like ending diagonals (again) on all these waves up. We’ll have to see if we put in that second wave now, or if something else is going to happen.
Yes, that’s what I was thinking.
A classic motive wave.
Just I have been waiting for 62% retrace of this first wave up.
But nope. It continues up.
There are always 10 reasons when it goes down.
But I always scratch my head for the reason of the reverse up
And now it looks corrective in ABC.
May be it will stop here at 62% retrace of the wave down from SPX1946
Right now, unless it continues up, it’s corrective. However, it also could have gone right int a third wave (an extension), or it could be a b wave with a c to come (down). I’ve never seen a more confusing market.
That’s why I stay in shorts to keep following the trend.
So for me 50 points up-n-down is simply a noise.
Just I recharge some higher at the levels you give and resell them when it resumes down.
I think this market will just drop one day without opportunity to get in
I can see us continue up to the top from here. This is set up as an ending wave (potential 5). The first wave went right to 38%. It’s motively shaped (a perfect first wave). I’ve seen an ending wave head up like this before and then just roll over for good at the top. But this is purely speculation at this point.
Odd. Hanging in mid air.
The clue that the euro is giving me is the fact that it seems to have bottomed and is a little over half-way to doing a 62% retrace, which put it in the same position as the indices if it follows through (in reverse, of course). It should head into a third wave up after this retrace.
I would expect we’ll see the scenario I described. We need a fourth and fifth wave overnight. Perhaps a turn first thing tomorrow. This is a motive wave (it’s perfectly formed, so far). There is no b wave. We’re close to the end of the third wave, I think. Therefore, the probability is for a continuation up to a top and then a turn down.
There is still an option for it to continue up as wave 2 rather than just wave 4, but we’ll wait to see how the wave unfolds.
Peter,
I hope you see the value of combining things. There is more than just ew.
Let me give you an example. At the 2009 low Uranus was at 352.19797 degrees. And S&P mad a low at 667. Taking the square root from 667 gives 25,8263. Add taht to the Uranus degrees and we get 18,024313. Look where Uranus is now : today 18,00857, tomorrow 18,0538.
So the S&P PRICE predicted the Uranus DEGREES. I have other indicators that confirm this date.
You teach EW; I teach Gann. Don’t see the problem 😉
André
Lol… I love reading these comments and will watch what will come out of this,
Andre in summary I m short Aex puts so what is the best time to sell them short term tommorow end of the day I guess..
By the way solunar map is also on track at the moment if it stays we will see a low at friday and a high next Tuesday ?
http://time-price-research-astrofin.blogspot.nl/2016/01/solunar-map-february-march-2016.html
I urge you one and all to take a minute and review this. I’ve followed Tom since 1982 or so. His recent calls have been spot on. What I am seeing in the metals is confirming Tom’s suspicion.
Gary (DC)
http://www.zerohedge.com/news/2016-02-23/tom-demark-warns-if-sp-closes-below-level-it-could-wreak-havoc-downside
The S&P 500 did indeed close below DeMark’s crucial 1,926.82 level today…
I urge you one and all to take a minute and review this. I’ve followed Tom since 1982 or so. His recent calls have been spot on. Waht I am seeing in the metals is confirming Tom’s suspicion.
Gary (DC)
http://www.zerohedge.com/news/2016-02-23/tom-demark-warns-if-sp-closes-below-level-it-could-wreak-havoc-downside
The S&P 500 did indeed close below DeMark’s crucial 1,926.82 level today…
Yawn. Yup. But we’re actually going to 1620.
1620 Indeed! We are at ES 1899 (9:15am EST). Your position is that we are headed to ES ~1947 before turning down. Is it possible the “turn down” is in effect right now because we closed below SnP 1926?
fyi… My interest in the ES is academic as I am expecting silver to more than double in the very near future. However, these markets are all intertwined. Also expecting bitcoin to move from $418 to $650 before the middle of March.
since the beginning of the year the counts on the 120 minute SPX chart have been clear…on alert for a very, very short term bottom today or tomorrow (wave 1)…good luck with your trading…
After measuring ES and NQ (the futures), It looks like this is a first wave down. The EW entry point is after a 62% retrace—the second wave. (ES: 1922.47, NQ: 4178.40, SPX:1926). I will post on the weekend.
It is difficult to analyze the cash indices at the moment, for rather obvious reasons.
Hi Peter, A retrace to ES 1822’ish would make a nice right shoulder to the head at 1943.xx ES from a couple of days ago.
Oops. Typo. Should have been 1922’ish.
eurusd has reversed. Same 62% entry: long 1.0987
Cash indices don’t measure correctly and the overall wave in SPX is quite short, so we may just be seeing a b wave with upside correction still in progress. Be careful.
The last wave in all cash indices and futures is in 3 waves, which is not motive, so something else is going on. None of the waves overall look correct to me, so I’ll wait to see the outcome before making any calls.
perhaps it is too simple, in my naive level of EW, but could this be an ending diagonal in es with over throw? Five waves of three?
http://invst.ly/159pj
amb,
No, this is not an ending diagonal. Ending diagonals are ending waves.
There are too many problems with this wave down for it to be a first motive wave down, imo. SPX has retraced finally to the 38% level I called for last week. I put this is a fourth wave, or b wave, since the overall structure from 1800 or so is corrective.
If you look at your chart, you will see that wave 2 is way bigger than wave 4 of the wave down. That means it’s in 3 waves. Wave 4 also did not retrace at least 38%. The final wave is in 3 waves. I won’t list all the problems but they go on …
I expect a new top. I may be the only one.
I like your creativity amb! ^^
+1 Peet, I am with you! These waves are crap, we still need to go some higher levels, stupid tradingrange market!
Cheers,
W
could this be an inverted H & S, embedded within a larger inverted H & S?
one hr chart, neckline es 1938
http://invst.ly/15kea
4 hr chart, neckline es 1943
http://invst.ly/15kg0
break up thru both neck lines and this thing might take off…..
SPX 1939 was the measured top of wave 3.
Peter,
may be it was the 2nd wave retrace (in three) after the 1st of the 5th down?
You would need to suggest what asset you’re referring to.
You might want to keep your eye on eurusd, which has completed 5 waves up at very small degree (10 min. chart) and is attempting to turn at the 62% retracement level. I consider it a bellweather for the turn in equities. On a larger scale, it has retraced 62% of the first wave up.
If SPX turns here (1925 or so) it projects a top of 1961 (that same old target).
SPX and ES seem to be tracing out a fourth wave triangle. I would guess this last wave will take us to tomorrow. Fridays are generally good days for tops.
Fourth wave triangles forecast one final wave to come before a trend change.
I added an SPX chart at the top of the post.
This website is for educational purposes relating to Elliott Wave, natural cycles, and the Quantum Revolution (Great Awakening). I welcome questions or comments about any of these subjects. Due to a heavy schedule, I may not have the time to answer questions that relate to my area of expertise.
I reserve the right to remove any comment that is deemed negative, is unhelpful, or off-topic. Such comments may be removed.
Want to comment? You need to be logged in to comment. You can register here.