Update Thursday, March 24, 11am EST
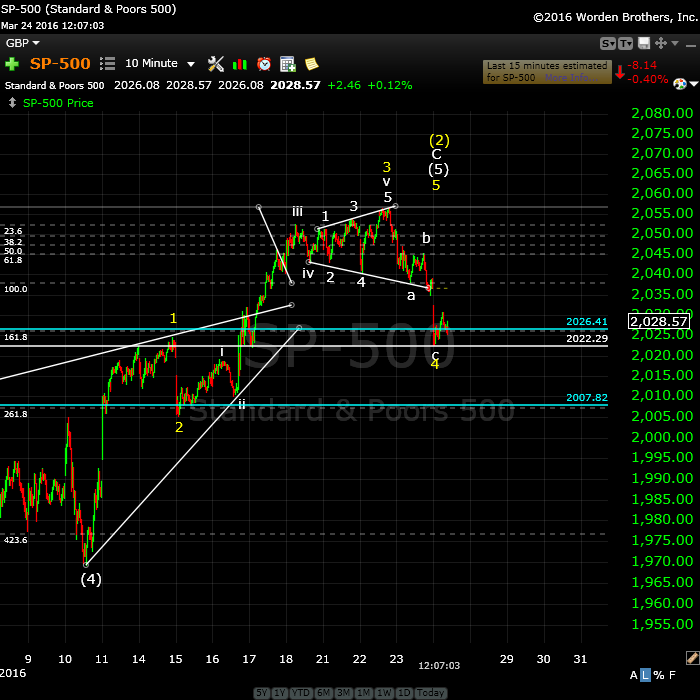
Above is the 10 minute chart of the SP500 updated through this morning. Comparing this chart to the one below, you can see that we’ve fallen out of the ending diagonal into a full fourth wave. This will be the final 4th wave, correcting the entire 5th wave up. I’ve relabeled the chart so you can get a better idea as to where we are.
I’m labeling the smaller ending diagonal as the termination of the third wave.
The wave down yesterday and today is a corrective wave, denoted by the abc labels. There are a number of reasons. The length isn’t as expected, there’s no adequate 2nd wave of the fifth, and the first wave isn’t motive.
In terms of the length, I’m referring to wave ratios. I’ve place a fib tool on the chart to shown that when you measure wave a, wave c doesn’t come down to either of the expected blue lines. It’s an odd length. A motive wave always hits those wave ratios.
This means that over today and the weekend, we should climb back up to a new high (in a five wave sequence). I don’t have a target for a top. Each of the preceding waves are getting shorter. As a result, I wouldn’t expect this fifth wave to go much further than a new high before turning down.
__________________________
Update: Wednesday, March 23, 3:15PM EST
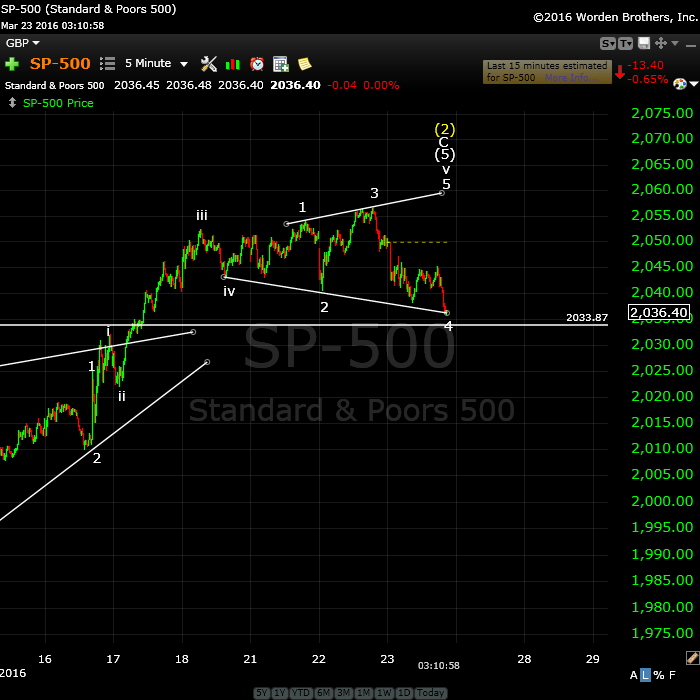
Above is the 5 min chart of the SP500 showing the latest drop, which seems to have confirmed what was shaping up as an ending expanding diagonal. It required one more wave up to a new high and then we’ll have a dramatic reversal. The wave up should be in 3 waves.
It may do a throw-over, meaning it will likely exceed the upper trendline.
One more thing I’m noticing, which speaks to opportunities in currencies.
USDCAD looks to be near the top of a fourth wave. When it ends. it should retraced to a double bottom.
EURUSD is in the same position, but in the opposite direction.
____________________________
Trunews Interview:
Here’s a link to my interview today on trunews.com, for anyone interested. We focused mainly on Global Cooling, but also covered a fairly wide range of cycle-related areas in a short amount of time.
Update: Monday, March 21, After the Close
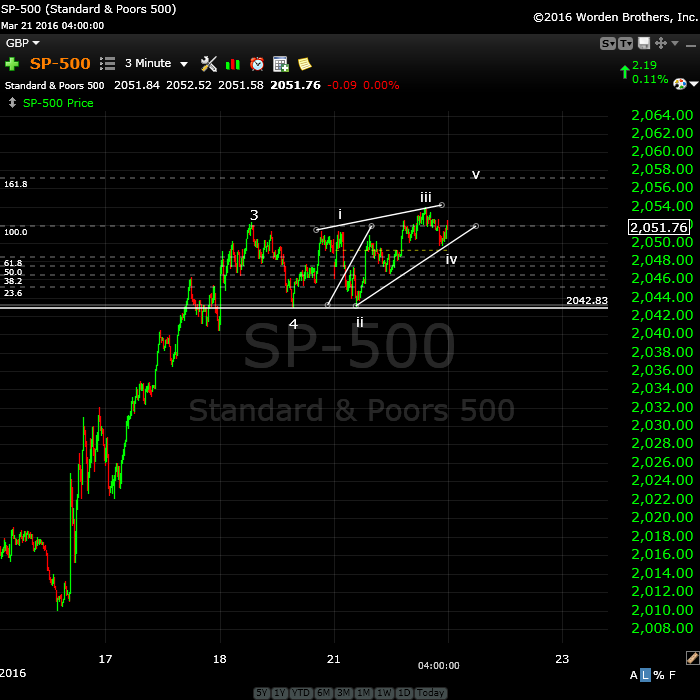
Above is a 3 minute chart of the SP500. Well, we’re certainly into the weeds at this point—the small stuff. I see an ending diagonal taking shape with one more wave up to go. We’ll need to watch the opening as we could reverse immediately, if we’re sitting at a new high in the 2058+ area.
The indices and futures are all at similar relative levels. The top is high. The cycle turn date is tomorrow, the 22nd of March.
________________________
Original Post (Saturday, March 19):
When bears roll over, watch out! They crush anything underneath them.
Bear markets come down far faster than bulls head up. In the coming third wave, surprises are going to be to the downside, so be very, very careful if you decide to play a retrace up. Also keep in mind that “waves in 3” retrace completely, so you want to count three waves up before entering a short trade. We call third waves the “nowhere to hide” wave.
Late in the week last week, bullish sentiment rose to 81%. That’s the highest it’s been since November 26, 2014. It’s consistent with a top. Volume continues to be about the lowest it’s been all year. The VIX looks ready to give a sell signal, which happens when it hits new lows.
Currencies also are at an inflection point, and have been close for a few days now. They’re hanging around highs just waiting to turn down. Gold is also at an inflection point and should turn back down, along with oil (which is in an ending diagonal).
Today’s video is a bit longer than usual (18:03) because I wanted to spend some time on an alternate scenario I deem to be very low probability. Nonetheless, I wanted to give you a head’s up that it exists and also give you a “wrong count level,” which is 1900 in the SP500. If we happen to turn at this level and head up substantially, we are not in a third wave down.
I also wanted to provide the reasoning behind why I consider it low probability. The key is that a final wave of a sequence has to be in 5 waves. The wave up from Feb. 11 is in 3 waves, and the structure of it will always be a “3.” The only way that wave can be part of a new high pattern is if the patten is a triangle. Only three indices could possibly fit that scenario (NDX, Nasdaq Comp, and the DOW). All the rest have come down in other configurations that would require a fifth wave to the top (in 5 waves). However, the current wave up from November 11 is in 3 waves, so going by EW rules, a new high is highly unlikely.
GDOW also does not support the new high scenario (chart at the bottom of the post).
The strongest cycle turn date of the entire month is Tuesday, March 22. That fits the current scenario. There’s a penumbral lunar eclipse on March 23 (Wednesday). “Penumbral” means the moon will completely disappear as the Earth completely blocks the Sun’s light.
Here’s a video overview of the market for Monday, March 21:
MReport for March 21 |
_______________________________
First Wave Down – What to Watch For
This weekend we’re dangerously close to a top of a second wave.
Let’s look at the SP500. When we turn over, we should drop like a stone.
The first wave down will be in 5 waves and will likely drop to at least 1968 SPX (previous 4th wave). After that, we should get a second wave that will retrace in 3 waves about 62%. That’s the preferred EW entry point. So don’t feel you have to rush in. There’ll be a much better opportunity at the second wave level than at the top and the risk is substantially reduced.
The Charts
The vigil continues ….
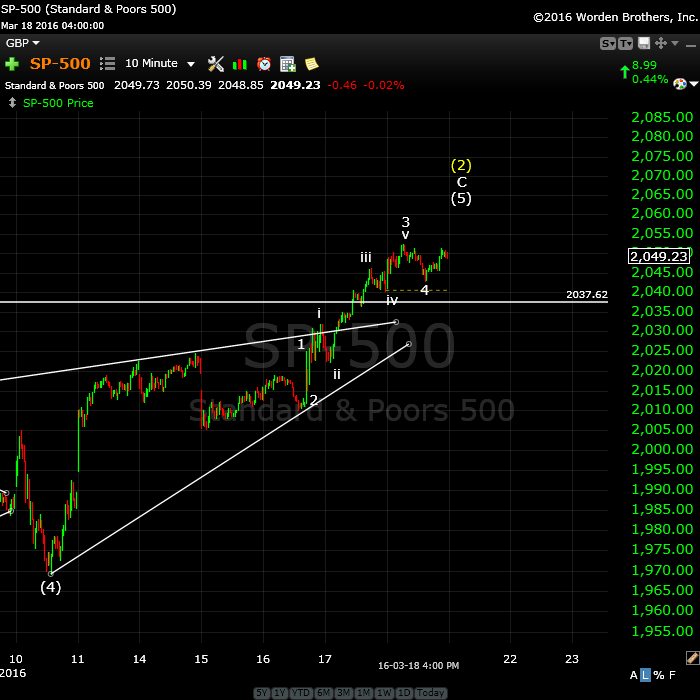
I know this is making us all crazy, but we’re really, really close. Above is a 10 minute chart of SPX. Looking closer at this final wave up, it appears to be not quite complete. The wave down on Friday looked motive but turned around and headed back up, so it must have had a problem (it was not long enough, for one thing). You find that as we get closer and closer to a top, the waves down (4th waves) start to look more and more motive. When you get into one minute charts, they’re extremely hard to analyze.
The waves are getting smaller and smaller. They cannot get larger than the EW count allows, so the maximum this final wave up can be is 1.618 X the first wave and that comes to 2064 SPX. I’ll post targets for the bottom of the third wave once we’ve seen a top.
On Friday, IWM (Russell 2000) hit its target of $110.00, so this adds credence to the top being in place, or almost so.
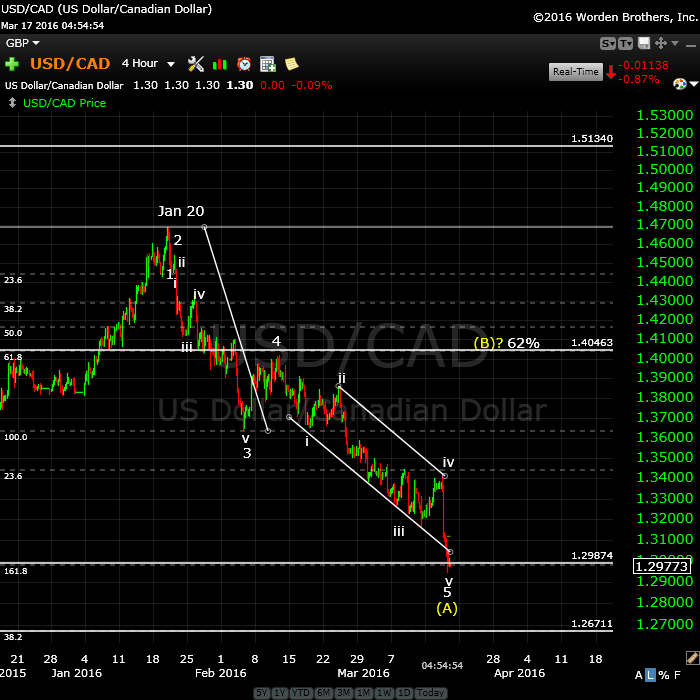
Above is a 4 hour chart of USDCAD. I have been watching this first wave down unfold and it’s met the target. The wave measures and numbers as a first wave (and A wave in this instance). It has retraced right to the area of the previous fourth. It should now correct to the 62% level in a wave B.
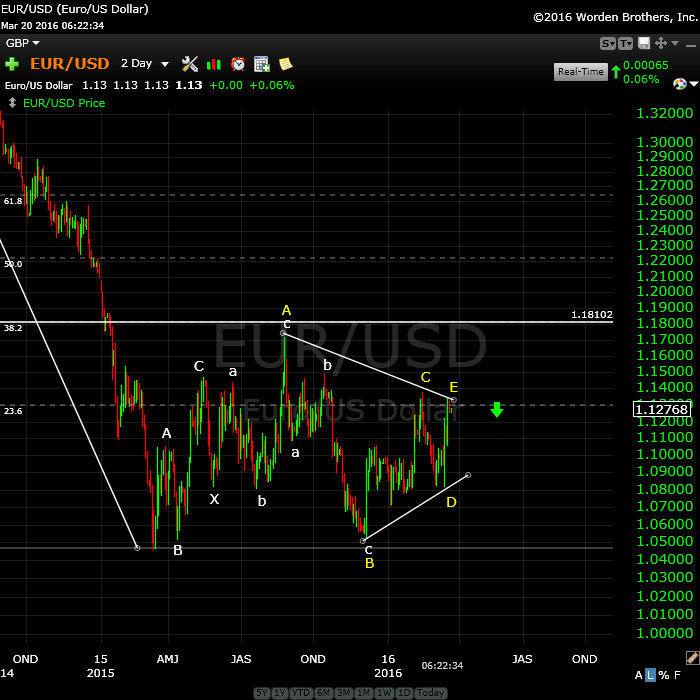
Update (Sunday): Here’s the daily chart of EURUSD showing the waves up over the past few days that suddenly turned corrective. I was expecting the motive waves to continue, but this flashes a warning.
After watching the video I posted, Joe (regular comments contributor) pointed out that my first take on this (wave 2, with three down to follow) looks more like a triangle. He’s right—something I should have caught but didn’t. So thanks to Joe, I’m bearish the euro. It should head straight down from here.
But a word of caution: A fourth wave triangle forecasts a final wave is left to go. While it may be long, there should be a reversal at the end of it.
The dollar should do the same thing but in the opposite direction (up).
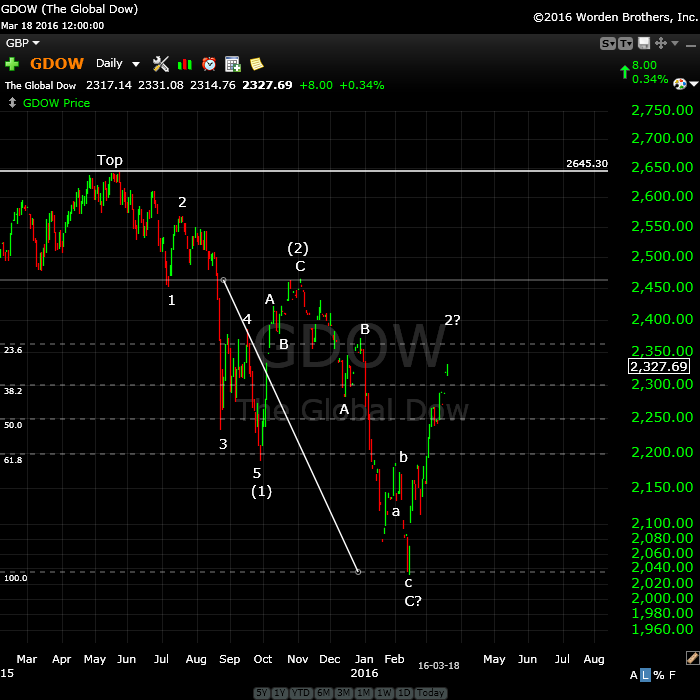
Above is the daily chart of GDOW (Global DOW) showing the current count. It looks to me like we’re tracing out a second wave after an ABC lower part of the wave. This wave will likely stop very close to the 23.6% retrace level (or 76.4%) from the bottom of the wave. This should lead to a very large and strong third wave down.
I do not see a path to a new high for GDOW and, in my opinion, this strongly lowers the probability of a new high for the main US indices.
________________________


Thanks for the updates Peter. It’s the last trading day before Easter. i don’t think it’s going to be a down day tomorrow. Most likely an inside day if we don’t get AZ’s fork target and Peter’s fifth target.
LizH,
Yes, tomorrow would be an alternate for me because this weekend is so psychologically positive. but it could happen. We’ll know soon enough.
Purim started yesterday based upon the Full Moon, I think.
Hi Peter
I will be very careful if i go short .
the expanding triangle concerns me
Joe
The summation index and McClelland Ossilator gave sell signals today. Sell into strength, it should really. finally be over.
The 1929 crash bottomed on the lunar eclipse. Most others have their secondary top on the eclipse which is where the real crash begins. We are there, worth keeping an eye on.
The 1929 crash phase was 22 trading days – 360 to 195 which was down from the top of 386. almost 50% I am not expecting that, but if the two waves from the top work out to be 1-2, 1-2 watch out below.
Andre’
You have put a lot of work into astro timing, so I am interested in your view on whether or not the Moon’s southern most declination is highly associated with bottoms in the equity markets (S&P). If you believe it is, would you go as far as to say it is a necessary, but not sufficient, condition to be associated with market bottoms of greater or lesser degree. I would note that we have southern declination coming up from March 28 to April 1. Thanks in advance
Steve,
The association you mention is not strong. The fact that declination extremes cause a change in trend is much stronger. The september 2014 high came with south declination and the october low with north.
The next max south will be 3/31.
Lunar extremes either in declination, moonphase or apogee/perigee are strong confirmations of a turn. But I use them only in combination with other timers.
Hope this is an answer to your question.
André
Andre’
It does, much thanks.
The ending diagonal has broken … that’s good thing. However, I can’t make a motive wave out of the waves down. They’re in 3, particularly futures.
And none are the right length. To me, we have a large 4th wave. Anyway, we’ll see where the bounce takes us.
To me it looks like a big 4th as well… Especially when looking at Europe!
Cheers,
W
Plus, I’m expecting USDCAD to do a double bottom and EURUSD to do a double top.
I posted a new chart of the SP500 showing the latest count.
Peter,
this 4th of the 5th in your new chart of SPX has gone in the area of the 1st of the 5th ?
Good of you to catch this. The entire wave up is corrective, so you expect that kind of overlap. If we were thinking this was part of a wave 5 up (a motive wave 5), it would be breaking a hard EW rule. That’s one of the key rules to tell if the wave up is motive or corrective. Motive waves can’t overlap. Corrective ones usually overlap.
Thanks
it might be a 4th wave , if so it should be a weekly decline
and today is last of trading for the week .
im no longer short ,
the short term 5 day adv decline line still has room for more downside
as does the 10 day , yet i see mostly buying this morning and its been
a long morning .
lots of triangles in the overnight session and this drop is close in terms
of points as the previous drop march 7-10th.
Joe
SPX, ES, and NQ (haven’t checked the others) have all retraced 38%. They should know back off in a second wave. I suspect the earliest day for the turn will be Monday, the 25th.
I just took a closer look those indices. I only glanced at them when I wrote the previous not. We’ve actually done a second wave in the three indexes I mentioned. So we’re in the third wave of the fifth.
Looking at the major indices as a whole, I wouldn’t be surprised at all to see us trace out a final triangle. That would add on a few more days before we see a top. It certainly wouldn’t do the wave E theory any good.
I’ll put together a new video on the weekend.
Any thoughts on the russel 2000 60 minute chart
from late feb to date ?
i covered shorts based on that index ( TF futures symbol )this morning
joe
Not any different than my comments in posts. Same structure as other indices.
Peter,
Like to wish you , your family & all your readers a wonderful and a Happy Easter
Regards
AZ
Thank you, Mr. Fork. Very thoughtful, as usual. And to you and yours. 🙂
Happy Easter to all! 🙂 Especially to you Peet, ty for all the work!
Cheers
W
New post live: https://worldcyclesinstitute.com/market-in-denial/
This website is for educational purposes relating to Elliott Wave, natural cycles, and the Quantum Revolution (Great Awakening). I welcome questions or comments about any of these subjects. Due to a heavy schedule, I may not have the time to answer questions that relate to my area of expertise.
I reserve the right to remove any comment that is deemed negative, is unhelpful, or off-topic. Such comments may be removed.
Want to comment? You need to be logged in to comment. You can register here.