
Update Thursday, March 24, 11am EST
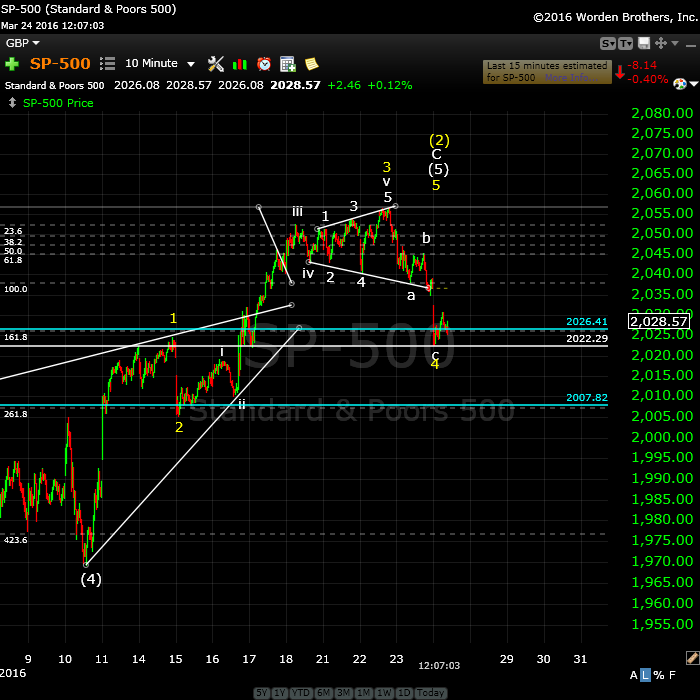
Above is the 10 minute chart of the SP500 updated through this morning. Comparing this chart to the one below, you can see that we’ve fallen out of the ending diagonal into a full fourth wave. This will be the final 4th wave, correcting the entire 5th wave up. I’ve relabeled the chart so you can get a better idea as to where we are.
I’m labeling the smaller ending diagonal as the termination of the third wave.
The wave down yesterday and today is a corrective wave, denoted by the abc labels. There are a number of reasons. The length isn’t as expected, there’s no adequate 2nd wave of the fifth, and the first wave isn’t motive.
In terms of the length, I’m referring to wave ratios. I’ve place a fib tool on the chart to shown that when you measure wave a, wave c doesn’t come down to either of the expected blue lines. It’s an odd length. A motive wave always hits those wave ratios.
This means that over today and the weekend, we should climb back up to a new high (in a five wave sequence). I don’t have a target for a top. Each of the preceding waves are getting shorter. As a result, I wouldn’t expect this fifth wave to go much further than a new high before turning down.
__________________________
Update: Wednesday, March 23, 3:15PM EST
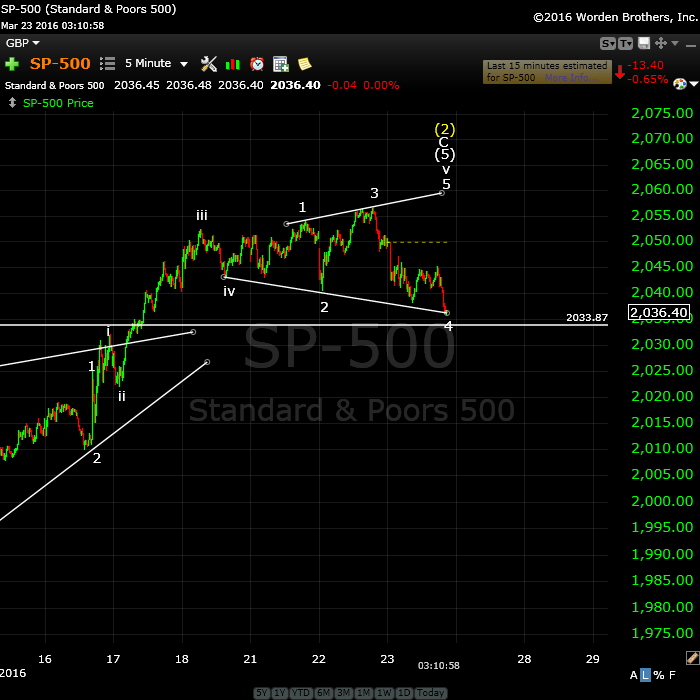
Above is the 5 min chart of the SP500 showing the latest drop, which seems to have confirmed what was shaping up as an ending expanding diagonal. It required one more wave up to a new high and then we’ll have a dramatic reversal. The wave up should be in 3 waves.
It may do a throw-over, meaning it will likely exceed the upper trendline.
One more thing I’m noticing, which speaks to opportunities in currencies.
USDCAD looks to be near the top of a fourth wave. When it ends. it should retraced to a double bottom.
EURUSD is in the same position, but in the opposite direction.
____________________________
Trunews Interview:
Here’s a link to my interview today on trunews.com, for anyone interested. We focused mainly on Global Cooling, but also covered a fairly wide range of cycle-related areas in a short amount of time.
Update: Monday, March 21, After the Close
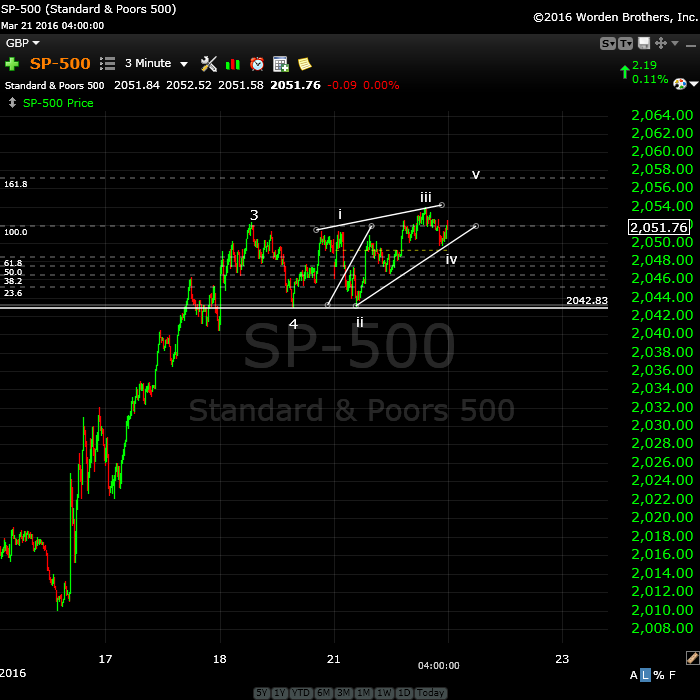
Above is a 3 minute chart of the SP500. Well, we’re certainly into the weeds at this point—the small stuff. I see an ending diagonal taking shape with one more wave up to go. We’ll need to watch the opening as we could reverse immediately, if we’re sitting at a new high in the 2058+ area.
The indices and futures are all at similar relative levels. The top is high. The cycle turn date is tomorrow, the 22nd of March.
________________________
Original Post (Saturday, March 19):
When bears roll over, watch out! They crush anything underneath them.
Bear markets come down far faster than bulls head up. In the coming third wave, surprises are going to be to the downside, so be very, very careful if you decide to play a retrace up. Also keep in mind that “waves in 3” retrace completely, so you want to count three waves up before entering a short trade. We call third waves the “nowhere to hide” wave.
Late in the week last week, bullish sentiment rose to 81%. That’s the highest it’s been since November 26, 2014. It’s consistent with a top. Volume continues to be about the lowest it’s been all year. The VIX looks ready to give a sell signal, which happens when it hits new lows.
Currencies also are at an inflection point, and have been close for a few days now. They’re hanging around highs just waiting to turn down. Gold is also at an inflection point and should turn back down, along with oil (which is in an ending diagonal).
Today’s video is a bit longer than usual (18:03) because I wanted to spend some time on an alternate scenario I deem to be very low probability. Nonetheless, I wanted to give you a head’s up that it exists and also give you a “wrong count level,” which is 1900 in the SP500. If we happen to turn at this level and head up substantially, we are not in a third wave down.
I also wanted to provide the reasoning behind why I consider it low probability. The key is that a final wave of a sequence has to be in 5 waves. The wave up from Feb. 11 is in 3 waves, and the structure of it will always be a “3.” The only way that wave can be part of a new high pattern is if the patten is a triangle. Only three indices could possibly fit that scenario (NDX, Nasdaq Comp, and the DOW). All the rest have come down in other configurations that would require a fifth wave to the top (in 5 waves). However, the current wave up from November 11 is in 3 waves, so going by EW rules, a new high is highly unlikely.
GDOW also does not support the new high scenario (chart at the bottom of the post).
The strongest cycle turn date of the entire month is Tuesday, March 22. That fits the current scenario. There’s a penumbral lunar eclipse on March 23 (Wednesday). “Penumbral” means the moon will completely disappear as the Earth completely blocks the Sun’s light.
Here’s a video overview of the market for Monday, March 21:
MReport for March 21  |
 |
Make sure you zoom the video to full size with frame expander (arrows) in the bottom right hand corner and also set the quality to as high as your web connection allows. This is an HD quality video so the best viewing is at that level. |
_______________________________
First Wave Down – What to Watch For
This weekend we’re dangerously close to a top of a second wave.
Let’s look at the SP500. When we turn over, we should drop like a stone.
The first wave down will be in 5 waves and will likely drop to at least 1968 SPX (previous 4th wave). After that, we should get a second wave that will retrace in 3 waves about 62%. That’s the preferred EW entry point. So don’t feel you have to rush in. There’ll be a much better opportunity at the second wave level than at the top and the risk is substantially reduced.
The Charts
The vigil continues ….
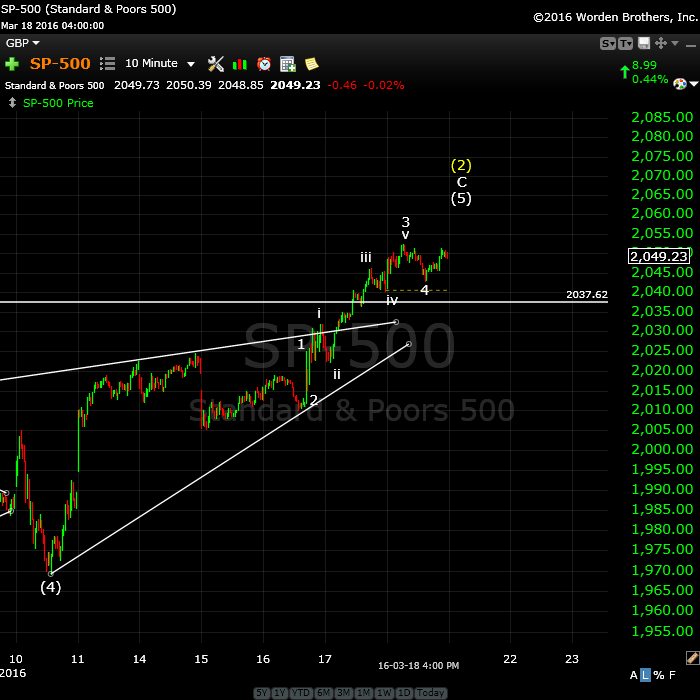
I know this is making us all crazy, but we’re really, really close. Above is a 10 minute chart of SPX. Looking closer at this final wave up, it appears to be not quite complete. The wave down on Friday looked motive but turned around and headed back up, so it must have had a problem (it was not long enough, for one thing). You find that as we get closer and closer to a top, the waves down (4th waves) start to look more and more motive. When you get into one minute charts, they’re extremely hard to analyze.
The waves are getting smaller and smaller. They cannot get larger than the EW count allows, so the maximum this final wave up can be is 1.618 X the first wave and that comes to 2064 SPX. I’ll post targets for the bottom of the third wave once we’ve seen a top.
On Friday, IWM (Russell 2000) hit its target of $110.00, so this adds credence to the top being in place, or almost so.
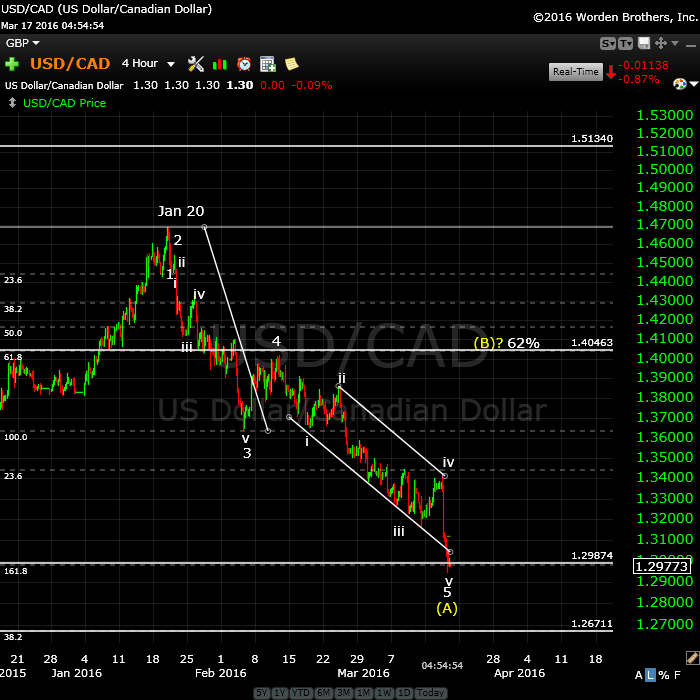
Above is a 4 hour chart of USDCAD. I have been watching this first wave down unfold and it’s met the target. The wave measures and numbers as a first wave (and A wave in this instance). It has retraced right to the area of the previous fourth. It should now correct to the 62% level in a wave B.
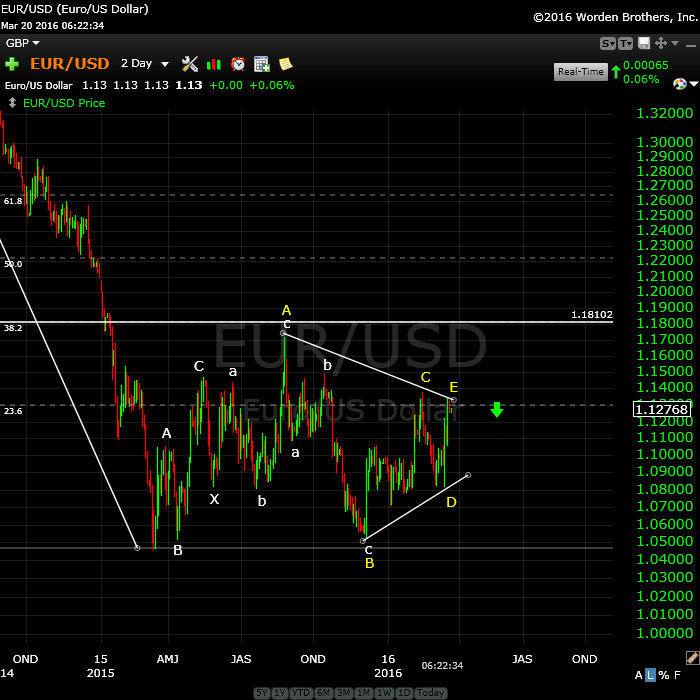
Update (Sunday): Here’s the daily chart of EURUSD showing the waves up over the past few days that suddenly turned corrective. I was expecting the motive waves to continue, but this flashes a warning.
After watching the video I posted, Joe (regular comments contributor) pointed out that my first take on this (wave 2, with three down to follow) looks more like a triangle. He’s right—something I should have caught but didn’t. So thanks to Joe, I’m bearish the euro. It should head straight down from here.
But a word of caution: A fourth wave triangle forecasts a final wave is left to go. While it may be long, there should be a reversal at the end of it.
The dollar should do the same thing but in the opposite direction (up).
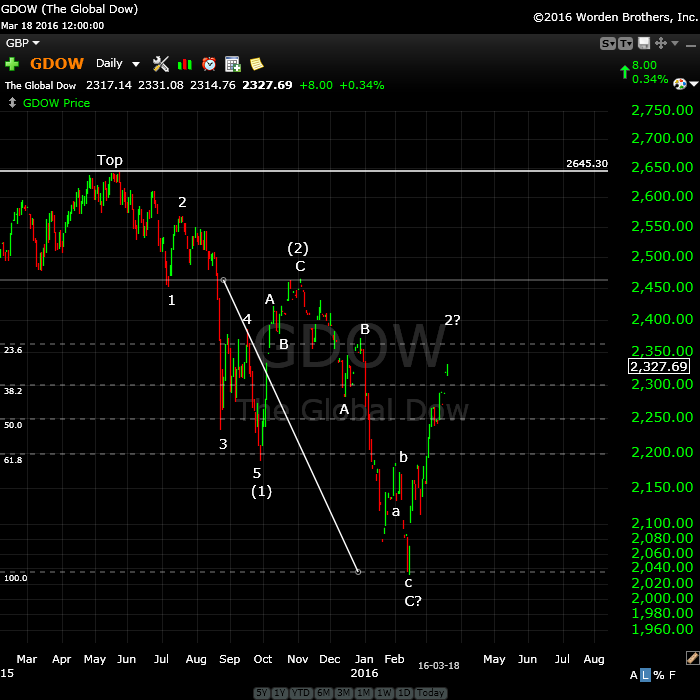
Above is the daily chart of GDOW (Global DOW) showing the current count. It looks to me like we’re tracing out a second wave after an ABC lower part of the wave. This wave will likely stop very close to the 23.6% retrace level (or 76.4%) from the bottom of the wave. This should lead to a very large and strong third wave down.
I do not see a path to a new high for GDOW and, in my opinion, this strongly lowers the probability of a new high for the main US indices.
________________________


Really great stuff this week, Peter. A couple of comments/questions…
First, I’m glad I watched the entire video for the currency bit. If we do head down determinedly this week, it would make sense to see a revitalization of the US dollar as a perceived safe haven.
Second, I find the ambivalence of EW to be one of its strengths. The fact that there are possible alternative counts allows for freedom for the market watchers and the market.
Mike,
Thanks! Was there a question, or are you OK?
Yeah, I guess they were more comments than questions. Thanks!
There was a reason the market had to go on untill this weekend. I created a new indicator with the square of nine and this indicator clearly showed the peak in momentum 3/15. After that 2 more dates : 3/17 and 3/20.
The delta system / solunar model gave the turn between 3/13 and 3/20. Very different technique; same results.
Thursday we had a Jupiter lattitude extreme and Friday Mars at 19.850 degrees declination. Both very strong and long term indicators.
Next week will be special and Wednesday will show capitulation. First we’ll set a low on Monday/Tuesday and then one last desperate test on Wednesday before the collapse.
In my mind there are no alternatives. Pressure down is getting stronger, so volume will dry up and return big time next week.
We are down into 4/7-9 for the first leg.
Cheers,
André
The S&P weeekcount gives 3/22 and 4/12. There is nothing in between. The sun at 75 degrees of outer planets is 3/21-22. The 209 degree angle gives 3/21-22.
Bayers “A times and times and Half a time” system gives 3/21 and 4/8.
The venus lattitude cyce gives 4/9.
Everywhere I look I keep seeing the same dates. 2 or 3 more days of bouncing around and there nothing to stop it.
Using a weekly sqr9, the 6/22 high gives 3/21 and 4/12. The 8/24 low gives 3/21 and 4/11. There is simply no way of avoiding these dates.
Calculating the weekly square 9 on the last 25 turns of last year gives a very clear cluster 3/21-22.
I rest my case…..
One very last remark, but very fundamental.
Gann said that when price and time square out, change is inevitable.
And what do we see ? The weekly s&p count – using price – gives 3/21. The weekly square of nine- using time- gives 3/21-22. This is what gann meant with squaring out.
The turn is inevitable…..
Peter, thanks for great stuff.
I think the market will levitate now until the end of March in order to close the quarter positive.
But after …?
Why Peter is right about 3/22.
The 2000 high in s&p came in at 1530 on 9/1/2000. The square of nine using these numbers shows 3/23 on the 122.1 degree crash angle. So a weekly squaring out of time and price confirms the crash date. I have more arguments but my position is clear; Wednesday is a major crash date.
relative to the target price identified in the video for the SPX wave 3…2000 top was 1527.46 and 2007 top was 1565.15…
CORRECTION…according to yahoo finance, 2000 top was 1552.87 on March 24 and 2007 top was 1,576.09 on October 11…
Using the real actual trading days instead of an average we see 3/23 will be 210 td from 5/20 and 60 td from 12/29.
The 360 td flash crash cycle calculated on the 10/15/14 low give 3/24.
Hi Peter
that was an excellent video .
ill admit i do not follow currencies very closely at all .
your chart of the eur/usd made me think of a triangle ?
maybe i just watch for them more than i should but is that a possibility ?
you are an excellent Elliott wave technician and i want to thank you for
all your posts .
Something Jerry Favors used to say was that every bear market in history has
begun with the prior years lows being taken out. this year the markets have
accomplished this which is a big warning to me regardless of my bullish bias .
so i respect your wave counts both the bullish and the bearish .Your arguments
are valid .
Thank you
Joe
Thanks, Joe. Coming from you, high praise (as Nicolas Cage used to say, I guess … haha).
In eurusd, it could be a triangle, you’re right. I didn’t notice it (should have). It’s going to lead to the same outcome.
But it would forecast a final wave down.
I have made an update to the eurusd chart in the post. Thanks to Joe, I’ve drawn in a most obvious triangle. This doesn’t change the original outcome, but the wave down may not be as long as originally thought.
This is looking very “toppy.” Watch for a top here.
So far, I only see 3 waves down everywhere.
One or two of you have mentioned the Puetz research on correlations between market crashes and celestial eclipses. The original work was conducted in the early 1990s and suggested by a Prechter article on such correlations. I thought it might be helpful if you knew some of the salient facts derived from the Puetz research.
“Puetz attempted to discover if eclipses and market crashes were somehow connected.
He emphasized that he was not contending that full moons close to solar eclipses cause market crashes. But he does conclude that a full moon in general, and a lunar eclipse in particular, seem to be the triggering device that allows for the rapid transformation of investor psychology from manic greed to paranoia. He asks what the odds are that eight of the greatest market crashes in history would accidentally fall within a time period of six days before to three days after a full moon that occurred within six weeks of a solar eclipse ? His answer is that for all eight crashes to accidentally fall within the required intervals would be .23 raised to the eighth power— less than one chance in 127,000.”
“[Puetz] used eight previous crashes in various markets from the Holland Tulip Mania in 1637 through the Tokyo crash in 1990. He noted that market crashes tend to be lumped near the full moons that are also lunar eclipses. In fact, he states, the greatest number of crashes start after the first full moon after a solar eclipse — when that full moon is also a lunar eclipse
.. Once the panic starts, Puetz notes, it generally lasts from two to four weeks. The tendency has been for the markets to peak a few days ahead of the full moon, move flat to slightly lower — waiting for the full moon to pass. Then on the day of the full moon or slightly after, the brunt of the crash hits the marketplace.
The “panic phases” of all the crashes he studied were entirely encompassed within one of the following periods: 1) February 4 – April 5, 2) September 3 – October 29.
Subsequent Puetz studies also showed a correlation between crashes and both spring and autumn equinoxes.
Background pertinent facts: Solar Eclipse: March 8/9
Lunar Eclipse: March 23
March 20
The March 20 date at the bottom is, of course, the date of the spring (vernal) equinox…
Draw trendline from Sep29 cash low at 1871.91 to Feb 11 low of 1810.10. It cuts through the low of Jan 20 which was a spike low. Parallel that line to top of 2116.48 on Nov 3. On an hourly (65 min) cash chart , last period today so far on the upper channel saw the line at 2053.89. Now compare the sep 29 to nov 3 move in raw S&P cash points to the current one. The prior was 244.57 cash points. So far to today’s high, the move has been 243.81 points!
Yeah, I would watch for a turnover right about here. We might put in a small 4th wave down and another small 5th wave, but I wouldn’t expect too much more upside. If we come down in 5 waves to 2043 or so, that would be a good indication that we could be done.
I still have tomorrow as the cycle turn date, but it doesn’t mean we couldn’t get started today.
It looks to me that we’ve completed waves 1-4 of the final small 5th wave and have only one more small wave up to go. We’re down in 3 waves so far, we we might not see the top in SPX until tomorrow, which fits the schedule perfectly.
All the indices are lined up in similar positions.
I added an end of day chart of SPX at the top of the post.
There’s an outside chance we may have a 1st wave down and that we’ll only retrace 62%. I don’t think so, but it’s hard to be 100% sure when you’re down to 1 minute charts.
The possible ending diagonal in SPX is no longer.
Peter,
do you mean ES ?
No, I posted a chart last night of SPX in an ending diagonal.
Just notes with no comment
The first Mercury Retrograde for 2016 occurs in the sign Aquarius (1o 3″ ) on January 5 at 1:05 pm Greenwich or Universal Time, 8:05 am Eastern Time and 5:05 am Pacific Time.
Mercury enters Direct Station in Capricorn (14o 55″) on January 25 at 9:50 pm Universal Time, 4:50 pm Eastern Time and 1:50 pm Pacific Time.
Mercury first enters the Pre-Shadow on Dec 19 2015, the previous year, and is last in the Post-Shadow on Feb 14 2016.
—————————————————–
Puetz cycle ends late april .
The second Mercury Retrograde of 2016 occurs in Taurus (23o 36″) on April 28 at 5:20 pm Universal Time, 1:20 pm Eastern Daylight Time and at 10:20 pm Pacific Daylight Time.
Mercury goes direct in Taurus (14o 20 minutes of arc) on May 22 at 1:20 pm Universal Time, 9:20 am Eastern Daylight Time and 6:20 am Pacific Daylight Time.
Mercury enters the Pre-Shadow on April 14 and is last in the Post-Shadow on June 7.
——————-
Jan 20 2016 0945 West coast time
Feb 11 2016 1137 west coast time .
529 hours
529 hours * 2.2 = 856 hours
feb 11 1137 Plus 856 hours = March 30 1125 west coast ( needs 1 hour adjust)
dow
jan 20 low 15450.56
feb high 16510.98
Feb 11 low 15503.01
16510.98-15450.56=1060.42*2.2=2332.92
15503.01+2332.92=17835.93
trade days
jan 20 plus 16 tr days = feb 11 plus 16 tr days =march 7 plus 16 tr days=march 29
jan 20 Low feb 11 low march 7 high march 29 high ? ( top of 3rd ?????)
feb 11 plus 8 tr days feb 24 plus 8 tr days march 7 plus 8 tr days march 17 (failure)
plus 8 tr days = march 29.
March 8 closing low plus 5 tr days = march 15 plus 5 tr days =march 29
march 8 Low March 15 Low March 29 HIgh ? ( top of 3rd ?????)
March 29=17835.93
Im becoming very careful because to many things are not adding up
at this juncture timing wise .im missing something
Joe
ES is having a difficult time getting past the 62% retrace level. NQ at a possible double top. And SPX has all but filled the gap. Maybe we’ll see a turnover before another top.
Whenever I say what I’m thinking out loud, the opposite usually happens. 🙂
Looks like we’ve got a final top to put in.
The wave down really doesn’t look motive.
correction
March 8 closing low plus 5 tr days = march 15 plus 5 tr days =Today
Plus 5 tr days =march 29
Today can be part of a smaller low to low to high count
if today is a low it can be some sort of 4th wave from
what began on march 8-10th
its a perfect set up for a top
but my gut tells me to be careful
sorry for the typing , just getting my head straight
Joe
ES is now @ 2040.40
The High today was @ 2044.50
If the Top is not in yet , then next stop should be @ 2054 – 2056
AZ
Tomorrow will be 360 td from the oct 14 low and 211 td from the 2015 may high.
211 is 225 degrees in the square of nine and that is 90 degrees from the august low.
Tomorrow could be volatile (down).
André
Watch for a turn here as we hit a double top. We’re almost at five waves up across the board.
The high from the morning is gone now .
I think we are now heading to the 2056 – 2058 … I think that will give us the TOP
Feels like Death of a thousand cuts
Sorry missed to say the target is for ES
Another thing of note, it looks like we have hit the trendline that connects Nov 3rd and December 2nd on SPX. I don’t think i saw anyone else mentioning that.
Hopefully we’re seeing a second wave on the 1 minute chart of SPX.
on the 15 minute SPX chart one can clearly identify five waves up from this morning’s low…further, technical indicators on the 15 minute SPX chart have turned down…
Yup, looking good. We’ve passed the previous smaller fourth. Won’t call a top just yet …
Inconclusive so far. The wave down looks motive, but didn’t follow through.
It looks to me like NQ and ES are slightly out of sync. NQ just completed a second wave, while ES may be in a fourth. If so, the trend is down. It should be. We’ve completed the necessary waves up if SPX is an ending diagonal (3 waves). If not, we have a wave left to go.
But since this is our cycle turn date, I would lean towards a top being in. We’ll need to see what tomorrow brings. The waves up are corrective.
Event Time in New York
Moonset Mar 23 at 7:00:00 AM
Maximum Eclipse Mar 23 at 7:47:14 AM
Penumbral Eclipse ends Mar 23 at 9:54:53 AM <———24 minutes after the open!
Times are local for New York (EDT – Eastern Daylight Time).
The setup I have looking good to hit my target ES @ 2058
Gann next important date for change of trend is March 28 – 29 , however due to holidays , I think we might reach the target earlier , and could be today / tomorrow .
On Andy’s first page, it’s today. On his internal document chart, it was yesterday, so I’m awaiting clarification. In an email last night, he says it’s today.
I agree with AZ, I am going for a top on 24 March.
Cheers,
W
NQ, YM. and ES all did double tops overnight. SPX did one yesterday. I’m expecting it to be a top.
It is possible Peet. 🙂
3 waves down. The first wave is not motive.
Looks like 5 up from the bottom today, so we should keep going, but I don’t see a top today. Likely tomorrow, as you suggested. This fourth wave needs to get to a new high.
I can count a possible 5 down in cash, but not in futures. However the length of the wave in cash doesn’t conform to what I’d expect. NYSE is definitely 3 waves down. Overall, expect a new high.
Peter
If price does not reach my target … then I am giving my fork to Neptune … he might use it for fishing .
AZ
the 10 minute dow cash chart
the past few days looking like an expanding triangle into this mornings low
how this plays out im not sure yet went long near this mornings lows
will place a break even stop
Joe
pushing 3 to 1 neg on the adv dec line
expanding triangle wave 4 ? or Broadening top formation ?
took my nickle and will remember i was looking for a top
Yesterday qualifies as a low to low to high count
slightly short yet a bit nervous about it
cash dow needs to break below 17444 to give me more confidance
expanding triangle still valid
done for the day with 7 hard earned pt gain
The wave up today seems to be tracing out a motive 5 waves, so it should be the ending wave. Wave 3 should end at 2043 ES, 2051.50 SPX. These are measured at 1.618 X wave 1.
So tomorrow the top was not that of a stupid idea Peet. 😉
Nice interview btw, I listened to it while chilling. 🙂
Cheers,
W
Obviously my upside targets are no longer valid. What we have now in SPX and ES appears to be an expanding ending diagonal. It doesn’t change the prognosis. We still need one more wave up to finish it. It’s an extremely bearish pattern.
3 wave down for sure now.
I posted a chart of SPX showing the expanding ending diagonal pattern we seem to have now.
we have 9 waves in the expanding triangle which is rare as is the pattern.
The final leg fell in 5 waves . the high was 17578.67
the low 17486.27 ( that was the final 5 waves )
i know this is not textbook but a failure to get back above 17578.67
and a break back below 17486.27 must be considered very bearish
and 3rd of a 3rd like .
failed triangles tend to be extremely bearish .
Joe
Hi peter
I spent some time on the daily spx chart
I’m beginning to think this market is topped .
there is a plethora of time lines on march 22
also the wave count while subjective looks complete .
the Fibonacci retracements have pretty much nailed
all of the short term peaks from the nov high to feb lows.
.382 .50 .618 and the latest at .786 .
each time has brought a drop ( even if short term )
time wise there is way to many time lines to note yet
every time i look i find more .
im expecting a 3rd of a 3rd down tomorrow .
ill admit my big issue with being bearish is my planetary model
and its been accurate for years . it was calling for a low today with
a further move higher next week.
the puetz cycle ends in late april just as mercury goes retrograde .
in sept last year the lunar eclipse drove stock prices higher
and in January this year mercury retrograde drove stocks lower .
strictly from a wave count point of view this market is done .
and I’m the bullish guy lol
looks like ill be watching the overnight market this morning .
lastly .
Take a 1 bar moving average on the daily spx chart and offset it
93 bars forward ( i used OHLC/4 ) .
the march 10 close march 11 low has a gap which should become a magnet
if were heading lower .
Joe
Well, that’s the great thing about EW. I spent no time on it—just looked at the waves. We haven’t topped, but if you’re going short, be careful.
I agree Joe,
It is over I predict we will go down till end of March after that we will retrace once more till April 18 after that the mercury retograde will finish this insane market behaviour
The most important date for a low will be May 9 of this year.
Peter – Your posts are fascinating and constantly evolving. I continue to learn from your work. Thank you!
A few weeks ago I suggested that the inverted H & S pattern could potentiate a substantial rise, possibly even a 100% retrace to 2075 SPX. I did not personally believe my own post…..too wild…..how could it rise so high? Now, I wonder……if the expanding triangle has an overshoot…..could it actually reach 2075? Time will tell……fascinating. Unfortunately, I have a hard time resisting my urge to enter a position too early. I need to enforce more self-discipline.
amb,
Yes, it could. However, it will be exceptionally brief. Yeah, wait for the wave up. It’s so obviously down in three waves today.
This website is for educational purposes relating to Elliott Wave, natural cycles, and the Quantum Revolution (Great Awakening). I welcome questions or comments about any of these subjects. Due to a heavy schedule, I may not have the time to answer questions that relate to my area of expertise.
I reserve the right to remove any comment that is deemed negative, is unhelpful, or off-topic. Such comments may be removed.
Want to comment? You need to be logged in to comment. You can register here.