

Fireworks Ahead!
The Fireworks I’m expecting won’t be limited to year-end. I’m expecting an even more volatile January, as a result of what’s happening on the ground. However, forces from our solar system have a lot to do with how we react here on Earth.
Our solar system also often has a dramatic affect on the stock market. However, recently, that hasn’t been the case. It’s perhaps because all major asset classes internationally are all moving together, as one. They seem to be moving in alignment with the US Dollar, and I suspect much of what’s going on is about the deleveraging of debt.
This weekend, we appear to be on the verge of an announcement of a new stimulus package (the latest I hear is that there could be a vote on Sunday, Dec. 20). That will likely send the market up in what would currently be the fifth wave of an ending diagonal. It may be a short-lived rally and result in a turn to the downside (a dramatic turn, as that’s the expectation of the end of an ending diagonal pattern. That turn could take place on Monday.
The Solar System is Missing in Action
We recently experienced a full moon and lunar eclipse (November 30) and then a total eclipse of the Sun (December 14). Neither seemed to have any affect on the market. Now, we have an even more major event to start the coming week and it remains to be seen whether it will have any affect on the market.
This Monday (December 21) marks a major event in our solar system. We have a combination of winter solstice with “The Great Conjunction,” which is the close encounter of Jupiter and Saturn on the same day, an event on its own that occurs about every twenty years.
However, this year it happens at 0 degrees Aquarius, and most astrologers will tell you it ushers in the Age of Aquarius, which is all about change. It begins a new era of awakening. Astronomers will tell you that this is the closest these planets have been in 400 years. The last time they were this close in the sky was in 1623.
“Although these conjunctions of Jupiter and Saturn occur every 20 years, the last time it was this close was in 1623. And the last time we were able to see a conjunction this close was in 1226 (also in Aquarius). The next time won’t be until 2080.”
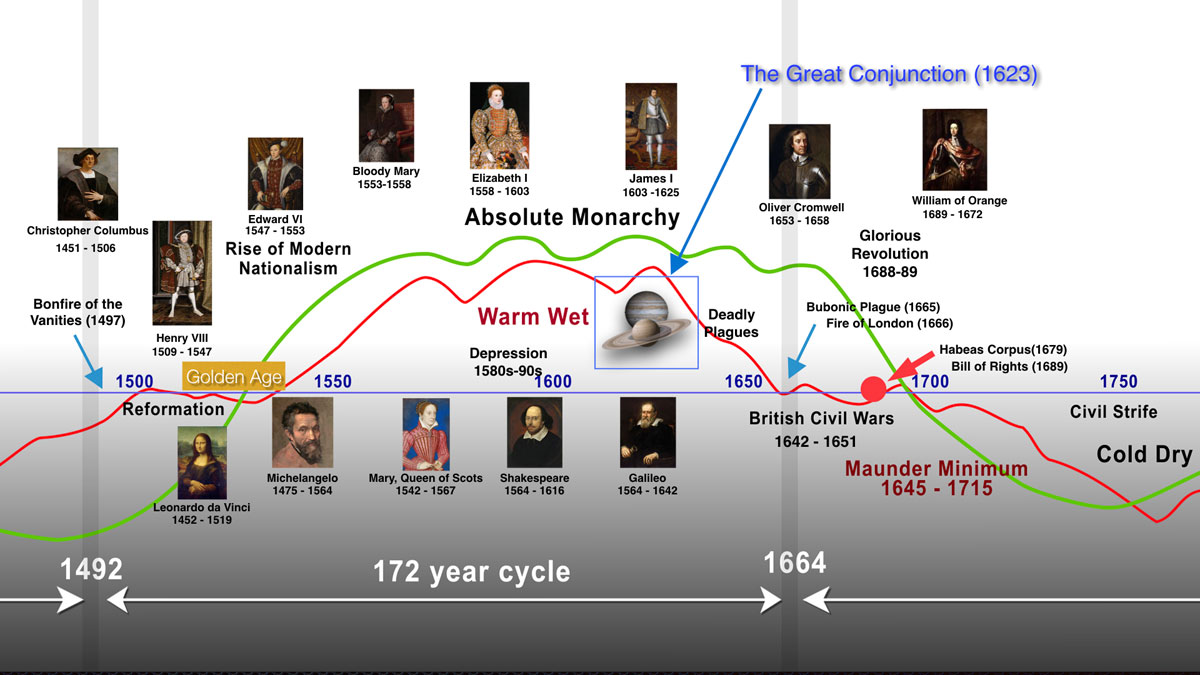
What’s interesting to me is that 400 years ago, when these two planets met at a similarly close proximity to each other was in 1623, and exactly 20 years after the death of Queen Elizabeth I. Above is a climate chart showing that era. For a more in-depth run-through of the significance of the Elizabethan area in terms of cycles, see my video, Cycles of History, part 1. (you can click the above chart to expand)
What followed the conjunction in 1623 was a series of civil wars in most countries across Europe, famines and pandemics, and finally a revolution (the Glorious Revolution). While revolutions also erupted across Europe, the one in England was bloodless. It was also the start of a colder, dryer climate, a periods dubbed “The Maunder Minimum.” We’re expecting a turn down in temperature similar to this period, a phenomenon that will likely last at least 500 years.
What’s especially interesting about this conjunction is that it’s unfolding in an air sign, more specifically Aquarius. (In fact, it’s a common astrological belief that this will usher in the Age of Aquarius, which poses to impact society as a collective.) “This means that the underlying themes of the Aquarius Great Conjunction will be resilience, liberation, and replacing toxic systems with healthier, inclusive, and unifying alternatives.”
The prediction is that the Great Conjunction of 2020 will bring about karma-rooted developments; innovations in science, medicine, and technology; and a general step away from rigid perspectives and favor of forming our own paths. This event also foresees themes of control—perhaps a rise in surveillance through social media—and community, with everyone feeling a deeper need to belong, be free, and to accept one another.
That’s from an astrology perspective, but it also parallels history, and the same prediction is part of the top of this current cycle, as it moves from warm-dry through to cold-dry over the next few years. This 1000 cycle top that we’re experiencing predicts similar social traits, based upon history. Dr. Wheeler referred to it as a great new awakening.
We’re at a major turning point in history.
 “Current events show that another world convulsion is occurring second only to
(1) the emergence of rational thought in the sixth century BC,
(2) the fall of Rome and other ancient civilizations in the 5th-century and the beginning of the medieval world based on feudalism, and
(3) the final collapse of the Middle Ages in the 15th-century.
(4) The current convulsion is comparable to the birth of Christianity in the first century and to the birth of the modern nation as a feudal principality in the ninth and 10 centuries.
All of these reorganizations of society were marked by spurts in the evolution of democratic institutions.” — Dr. Raymond H. Wheeler, Ph.D
Christmas Advisory:
This is an advisory that you’d should pay attention to if you live in the United States. I’m getting this information from people like Lin Wood (an attorney fighting the election fraud in Georgia), intel and military people who are monitoring the situation in the US, and even generals, like General Flynn.
I don’t think it’s a coincidence that the Trump administration has told many staff to leave the Washington DC area as of Monday, and has given government employees the day off on December 24. There are many other signs that something is about to happen, and there have been many calls for the Insurrection Act and the implementation of at least partial martial law. Whether they’re invoked, or not, is the big question. This cycle top is a willing enabler of just such actions.
PLEASE ECHO THIS ADVISORY TO ALL PATRIOTS— Make sure that you and your family have an adequate 10 day supply of food and bottled water. You may also want to purchase an old school (CB) radio for communication purposes, while you can still get one. At some time between December 18 and 24th, President Trump will tactically implement the sanctions from his 2018 Executive Order on Voter Interference. This will freeze the money and assets of people and entities to include Facebook, Twitter, the Fake News Corp, AND Chinese U.S. financial accounts. (Also why we have prepared our land and sea borders against invasion). Be prepared to assist the National Guard and othe military commands in defense of Our nation. Make sure that you have your weapons at the ready. But DO NOT interfere with the operations of the military. During this time, local law enforcement will have no authority. So, assemble small Patriot teams to patrol and secure your own and surrounding neighborhoods.
____________________________
NYXBT (Bitcoin)
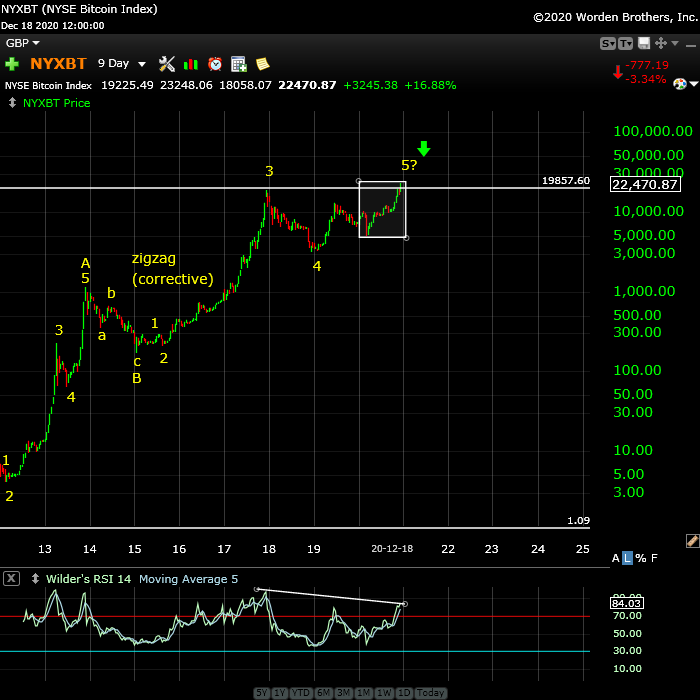
Above is the 9 day chart of NYXBT, a NYSE bitcoin ETF.
I’ve long maintained that bitcoin is a “fiat bubble” atop a 500 year fiat currency bubble (the stock market, as a whole). Since the entire stock market is moving “as one,” that means a change is trend is probably getting close at hand.
The chart above supports this theory, as it’s a zigzag, a corrective pattern. We arguably have a full five waves up, but we could have one more smallish down-up sequence before the pattern completes. It looks like this asset is moving similarly to equities. I would expect to see tops at close to the same time, but it may still be a few weeks away.
The RSI divergence is strong for a 9 day chart, so if you’re long, it’s time to be prepared for a possible trend change.
Zigzags are corrective patterns and will eventually completely retrace.
Know the Past. See the Future
_____________________________
Free Webinar Playback: Elliott Wave Basics
 If you’re new to the Elliott Wave Principle, or even fairly comfortable with it, this webinar will give you a solid introduction and comprehensive understanding of the difference between trending and counter-trend waves, the various patterns for both types of wave patterns, and a good overview of how fibonacci ratios determine trade targets.
This is link to the YouTube playback video, allowing you to review, stop and start, etc.
____________________________
Want some truth?
My new site now has several extensive newsletters in place. Videos now explain the banking system and deflation, and I’ve provided lists of what to do and what the start collecting in preparation for the eventual downturn, which will last for decades. The focus of my new site is now to retain your wealth, plan for deflationary times, and stay healthy in the process. I’m also debunk a lot of the propaganda out there. It’s important to know what’s REALLY happening in the world today. This has all been predicted and we know how it’s going to play out. Getting to the real truth, based on history, is what I do, inside the market and out.
To sign up, visit my new site here.
All the Same Market.
I’ve been mentioning for months now that the entire market is moving as one entity, the “all the same market” scenario, a phrase that Robert Prechter coined many years ago, when he projected the upcoming crash.
We’re in the midst of deleveraging the enormous debt around the world. Central banks are losing the control they had and we’re slowly sinking into deflation world-wide, with Europe in the lead.
The US dollar is fully in charge of both the equities and currencies markets. They’re all moving in tandem, as I’ve been saying since September of 2017. Over the past three years, their movements have been moving closer and closer together and one, and now they’re in lock-step, with the major turns happening at about the same time.
it’s challenging because often times currency pairs are waiting for equities to turn, and other times, it’s the opposite. The other frustrating thing is that in between the major turns, there are no major trades; they’re all, for the most part day-trades. That’s certainly the case in corrections, where you very often have several possible targets for the end of the correction.
We’re now close to a turn in the US indices, currency pairs, oil, and even gold. Elliott wave does not have a reliable timing aspect, but it looks like we should see a top very soon.
_________________________________
Rise above the rest … SM 2
Rise above the rest …I have only ever met a few people who, in their chosen fields (astrology, medicine, music, martial arts, technical analysis), rise above all the rest and you are one of them…you have ‘the gift’…and that’s why I’m a Trader’s Gold member. —SM |
Tops in your field DZ 2
Tops in your field …You are tops in your field. Tried to follow Elliot Wave international for years. They were always behind the market. After discovering you, I perceive that you are an expert in reading the waves, which puts you way ahead of the rest of your peers. And you can read the Waves like you are reading tomorrow’s financial section. I pray you stay healthy. —DZ |
Couldn’t be happier … KK 2
Couldn’t be happier …The analysis and insight you provide is simply amazing! I’ve been trading the futures and equity markets for well over thirty years and usually average around 5% monthly. Since joining your Traders Gold Service two months ago, that number has better than doubled. I couldn’t be happier.—KK |
the real deal SM 2
The real deal …‘Educational, insightful and thorough market analysis for all levels of traders. It’s Elliott Wave at its best….Peter Temple is the real deal’ —SM |
Get an upper hand … JC 2
Get an upper hand in trading …Seeing all the different currency pairs and the wave structures and hearing you explain why this has to do that on a nightly bases gives one a upper hand when trading. Elliott Wave applies to all stock and indices and can be applied to any candlestick chart. If someone ask what you want for Christmas – Tell them a membership to Peter’s “Traders Gold!”—JC |
A true expert in Elliott Wave FL 2
A true expert in Elliott Wave …You are a true expert in EW analysis. What you provide is not available anywhere and is priceless. Subscription on your services is the best thing I have ever done. Many thanks for your effort to make me a better investor. I now have more trust in my investment decisions. I hope you will continue the excellent work! —FL |
Have not had a losing week RW 2
Have not had a losing week …I have been with Peter almost a year. The only thing that matters is have I made money with his service. I think I have finally turned the corner using Peter’s EW. I have not had a losing week in the last 5 months. Thanks Peter, for your amazing amount of hard work. —RW |
The best of them JL 2
The best of them …Last couple of years, I subscribed to several ‘market traders’. You are by far the best of them and the personal contact is awesome. Daily and daily updates are very well written! Besides your expertise in EW, I also like your cycles analysis. Best investment I ever made! —JL |
US Market Snapshot (based on end-of-week wave structure)
This chart is posted to provide a prediction of future market direction. DO NOT trade based upon the information presented here (certainly NOT from a daily chart).
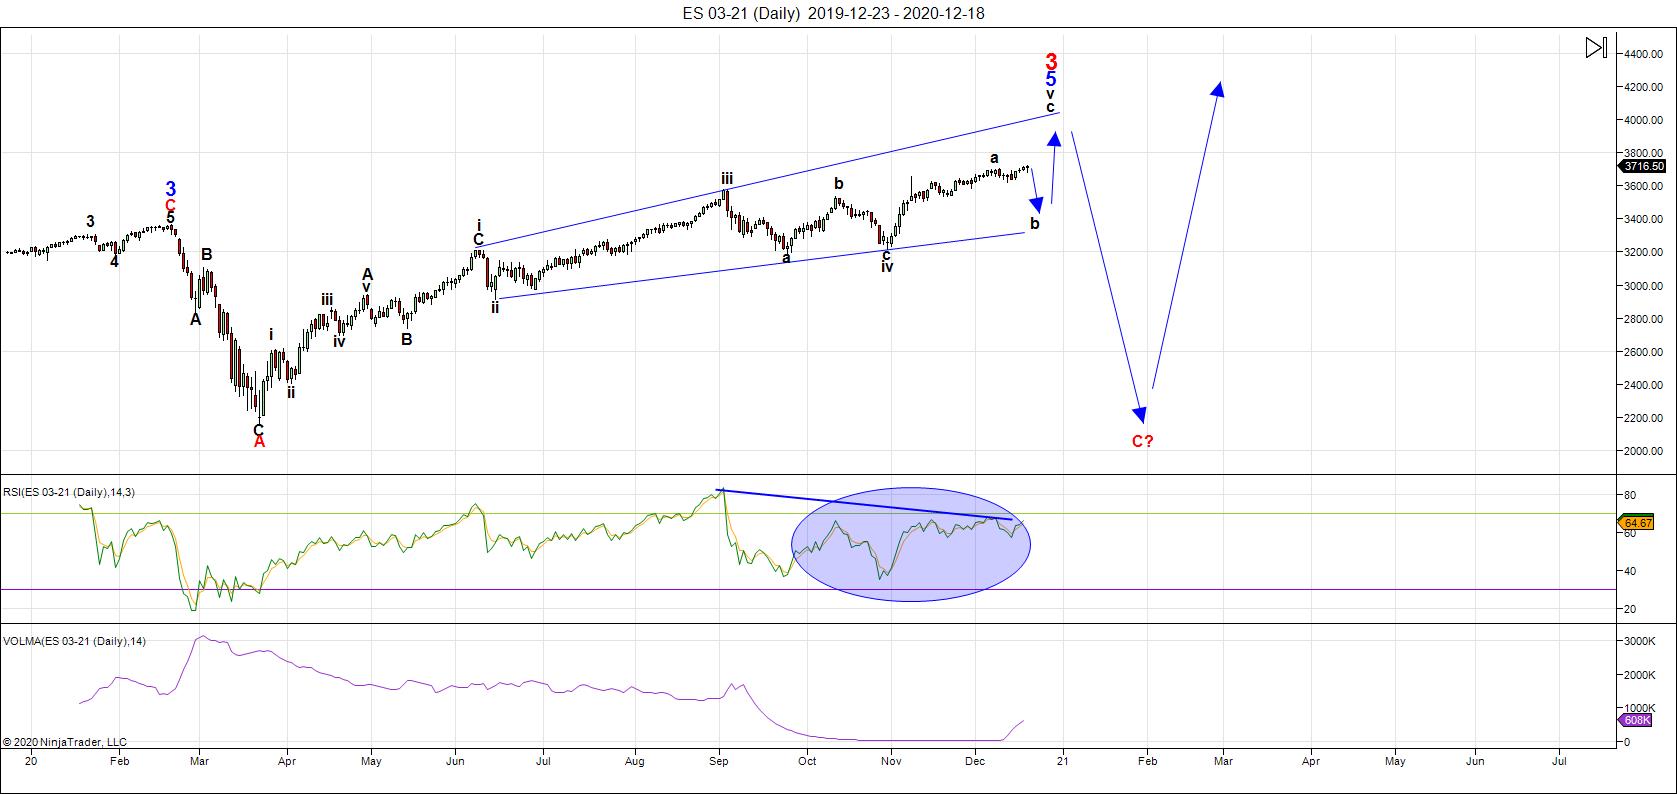
Above is the daily chart of ES (click to enlarge, as with any of my charts).
I've never seen so many ending patterns in a row in ES. The week before last, on the hourly chart, we had an ending expanding diagonal at the top of the third wave of this final fifth wave rally.
Then, in the next wave, down, the fourth wave, we ended with another ending expanding diagonal. This week, we've been tracing out a regular ending diagonal as a fifth wave rally, and on Friday, we completed its fourth wave to the downside. At the end of the day on Friday, ES rocketed upwards in the start of the final fifth wave of this larger A wave rally.
Diagonals almost always advance the trend beyond the measured targets, and that's the case at the moment. However, we're in the final subwave, so I'd expect a turn into a B wave down perhaps in the first part of this week.
This weekend, of course, Congress is working on a stimulus package and it looks like that may well help mark the top of the hourly chart ending diagonal. Together, this set of ending patterns in both directions is one for the record books.
Back to the daily chart. This A wave up as part of the final wave of a larger degree ending expanding diagonal. This being an A wave, I'm expecting a large B wave down before completing a final C wave up. That would complete the ending expanding diagonal shown on the chart above. Then we'll see a much larger drop of almost 2000 points.
___________________________
Summary: The ending expanding diagonal pattern is playing out on the daily chart. We're in the final fifth wave, having completed the A wave and still waiting for a turn down into a B wave, as diagonals, one after another, complete their patterns.
The SP500 also appears to be in an ending expanding diagonal. Most other US market indices have similar patterns. Diagonals are ending patterns and warn of an impending, dramatic trend change after they're complete. This puts us in the final stages of this rally up from March of this year.
The resulting trend change will target an area under 2100 in SPX, and will likely be a combination pattern and, as such, may contain zigzags, flats, and possibly a triangle or ending diagonal at the bottom. However, I'm leaning towards a series of zigzags, which are corrective waves, and will likely come down fast.
Once we've completed the fourth wave down, we'll have a long climb to a final slight new high in a fifth wave of this 500 year cycle top.
______________________________________


