
 The Total Solar Eclipse
I’m a sailor and, because of that, am very aware of the power of Mother Nature. She’s part of everything that happens on Earth, more than most people know. We’re going to see her work over the next couple of weeks as we go through a solar eclipse and then solstice.
With the Texas Supreme Court challenge having been thrown out on Friday night, the big game in town on Monday seems to be the solar eclipse. That doesn’t mean the fight for freedom isn’t going to play out over the next two months; it will in fact be an entry into the history books. The US is in a cyber warfare situation, something I’m going to cover extensively later today on my site, thetruthsage.com.
On Monday (Dec. 14), the total solar eclipse of 2020 will sweep across South America’s Southern Cone, through Chile and Argentina, turning daytime into twilight for up to 2 minutes and 10 seconds.
We’re poised this weekend to complete a small B wave correction to the upside (on an hourly chart) in futures, after an A wave down over the past two days. It’s likely the C wave down will take the rest of this coming week to play out.
There are lots of other events coming up this week which could be market movers.
Schedule:
- Monday, Dec. 14 — Solar Eclipse (approx. 8:30 am EST)
- Wednesday, Dec. 16 — Federal Reserve Announcement
- Thursday, Dec. 17 — Saturn exits Capricorn, where it has been delaying justice.
- Friday, Dec. 18 (or earlier) — Report on election fraud (DNI Ratcliffe)
- Next Monday, Dec. 21 — Solstice
We’re starting to get quite close to the end of this corrective rally. I’ve slightly re-worked the chart of NYSE below to change the ending diagonal to an ending expanding diagonal. You can see how close we are to a final top.
As I’ve been saying for the last couple of weeks, I’m expecting one more wave down and then one more wave up and that will end the trend. This week should give us the wave down; I’d expect the wave up to last into January, but that should be it.
NYSE – Ending Expanding Diagonal
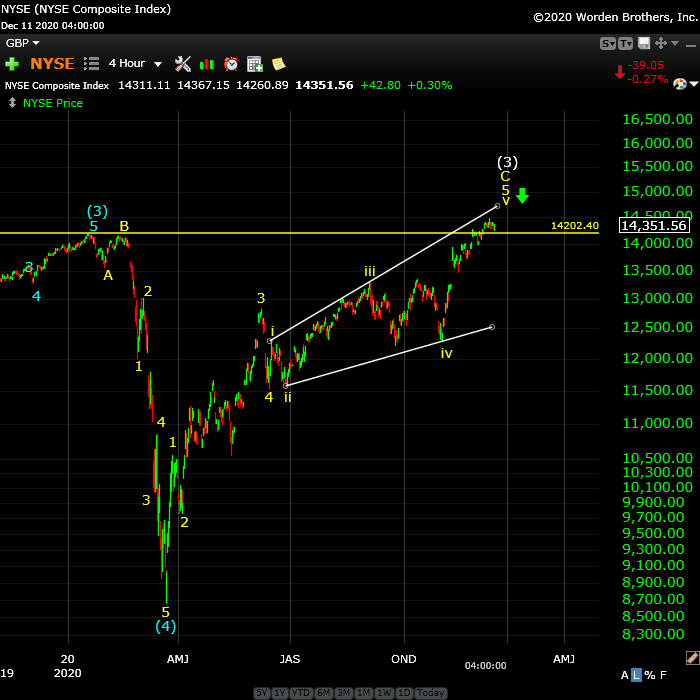
Above is 4 hour chart of NYSE showing us a very large ending diagonal. In fact, there are two of them!
The entire wave up from March, 2020 is corrective, telling us it must completely retrace to the bottom. It also means all the waves up in the sub-indices are also corrective.
I’ve made a slight change to the count here — changing the ending diagonal to an ending expanding diagonal. These are the rarest of patterns, but they happen to be all over the place at the moment. We just completed one in the hourly chart of ES (SPX eminis).
In the above chart, you’re seeing the entire wave up from March which has traced out an ending pattern, a large ending expanding diagonal at the top. When the entire pattern is complete, the trend will change to the downside. It looks like it requires a fourth and fifth wave to test the upper trendline before a final turn, a few weeks away.
There are no real rules within ending diagonals, other than the subwaves are zigzags, which are corrective three-wave patterns. Fibonacci measurements don’t necessarily work, so it’s impossible to know how long the waves will be. The fifth wave (that we’re currently in) needs to at reach the upper trendline, or get very close. That puts a cap on the market.
IWM — Russell 2000
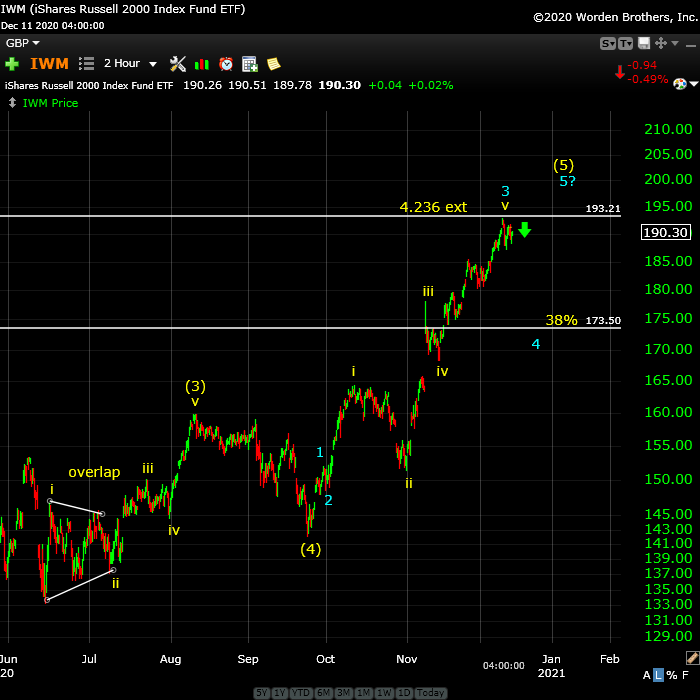
Above is the 2 hour chart of IWM (the Russell 2000).
There are two possible counts for this index. I’ve discarded the ending diagonal, which makes this index the only one of the NYSE indices that isn’t in a diagonal of some sort. Based upon the wave lengths and expected waves down in other indices, the ending diagonal went to the low probability count.
I can still count the current subwave structure in two ways. The difference is rather subtle. In the short term, it doesn’t make any difference to the overall outcome.
Where it does matter is in the length of the final fifth wave. But before we get there, we have a fourth wave down to play out. We’ve begun the process this week with what appears to be a small first wave down (an ‘A’ wave, because it’s corrective). I won’t have a target for the final fifth wave until the fourth wave is in place.
Currently, I put us at the top of the third wave and expecting a fourth wave down to an area around the 38% retrace level shown on the chart.
The turn to the downside has already begun. It’s likely it will last most of the coming week.
Know the Past. See the Future
_____________________________
Free Webinar Playback: Elliott Wave Basics
 If you’re new to the Elliott Wave Principle, or even fairly comfortable with it, this webinar will give you a solid introduction and comprehensive understanding of the difference between trending and counter-trend waves, the various patterns for both types of wave patterns, and a good overview of how fibonacci ratios determine trade targets.
This is link to the YouTube playback video, allowing you to review, stop and start, etc.
____________________________
Want some truth?
My new site now has several extensive newsletters in place. Videos now explain the banking system and deflation, and I’ve provided lists of what to do and what the start collecting in preparation for the eventual downturn, which will last for decades. The focus of my new site is now to retain your wealth, plan for deflationary times, and stay healthy in the process. I’m also debunk a lot of the propaganda out there. It’s important to know what’s REALLY happening in the world today. This has all been predicted and we know how it’s going to play out. Getting to the real truth, based on history, is what I do, inside the market and out.

To sign up, visit my new site here.
All the Same Market.
I’ve been mentioning for months now that the entire market is moving as one entity, the “all the same market” scenario, a phrase that Robert Prechter coined many years ago, when he projected the upcoming crash.
We’re in the midst of deleveraging the enormous debt around the world. Central banks are losing the control they had and we’re slowly sinking into deflation world-wide, with Europe in the lead.
The US dollar is fully in charge of both the equities and currencies markets. They’re all moving in tandem, as I’ve been saying since September of 2017. Over the past three years, their movements have been moving closer and closer together and one, and now they’re in lock-step, with the major turns happening at about the same time.
it’s challenging because often times currency pairs are waiting for equities to turn, and other times, it’s the opposite. The other frustrating thing is that in between the major turns, there are no major trades; they’re all, for the most part day-trades. That’s certainly the case in corrections, where you very often have several possible targets for the end of the correction.
We’re now close to a turn in the US indices, currency pairs, oil, and even gold. Elliott wave does not have a reliable timing aspect, but it looks like we should see a top very soon.
_________________________________
A true expert in Elliott Wave FL 2
A true expert in Elliott Wave …You are a true expert in EW analysis. What you provide is not available anywhere and is priceless. Subscription on your services is the best thing I have ever done. Many thanks for your effort to make me a better investor. I now have more trust in my investment decisions. I hope you will continue the excellent work! —FL |
Have not had a losing week RW 2
Have not had a losing week …I have been with Peter almost a year. The only thing that matters is have I made money with his service. I think I have finally turned the corner using Peter’s EW. I have not had a losing week in the last 5 months. Thanks Peter, for your amazing amount of hard work. —RW |
the real deal SM 2
The real deal …‘Educational, insightful and thorough market analysis for all levels of traders. It’s Elliott Wave at its best….Peter Temple is the real deal’ —SM |
Get an upper hand … JC 2
Get an upper hand in trading …Seeing all the different currency pairs and the wave structures and hearing you explain why this has to do that on a nightly bases gives one a upper hand when trading. Elliott Wave applies to all stock and indices and can be applied to any candlestick chart. If someone ask what you want for Christmas – Tell them a membership to Peter’s “Traders Gold!”—JC |
Rise above the rest … SM 2
Rise above the rest …I have only ever met a few people who, in their chosen fields (astrology, medicine, music, martial arts, technical analysis), rise above all the rest and you are one of them…you have ‘the gift’…and that’s why I’m a Trader’s Gold member. —SM |
Tops in your field DZ 2
Tops in your field …You are tops in your field. Tried to follow Elliot Wave international for years. They were always behind the market. After discovering you, I perceive that you are an expert in reading the waves, which puts you way ahead of the rest of your peers. And you can read the Waves like you are reading tomorrow’s financial section. I pray you stay healthy. —DZ |
Couldn’t be happier … KK 2
Couldn’t be happier …The analysis and insight you provide is simply amazing! I’ve been trading the futures and equity markets for well over thirty years and usually average around 5% monthly. Since joining your Traders Gold Service two months ago, that number has better than doubled. I couldn’t be happier.—KK |
The best of them JL 2
The best of them …Last couple of years, I subscribed to several ‘market traders’. You are by far the best of them and the personal contact is awesome. Daily and daily updates are very well written! Besides your expertise in EW, I also like your cycles analysis. Best investment I ever made! —JL |
US Market Snapshot (based on end-of-week wave structure)
This chart is posted to provide a prediction of future market direction. DO NOT trade based upon the information presented here (certainly NOT from a daily chart).
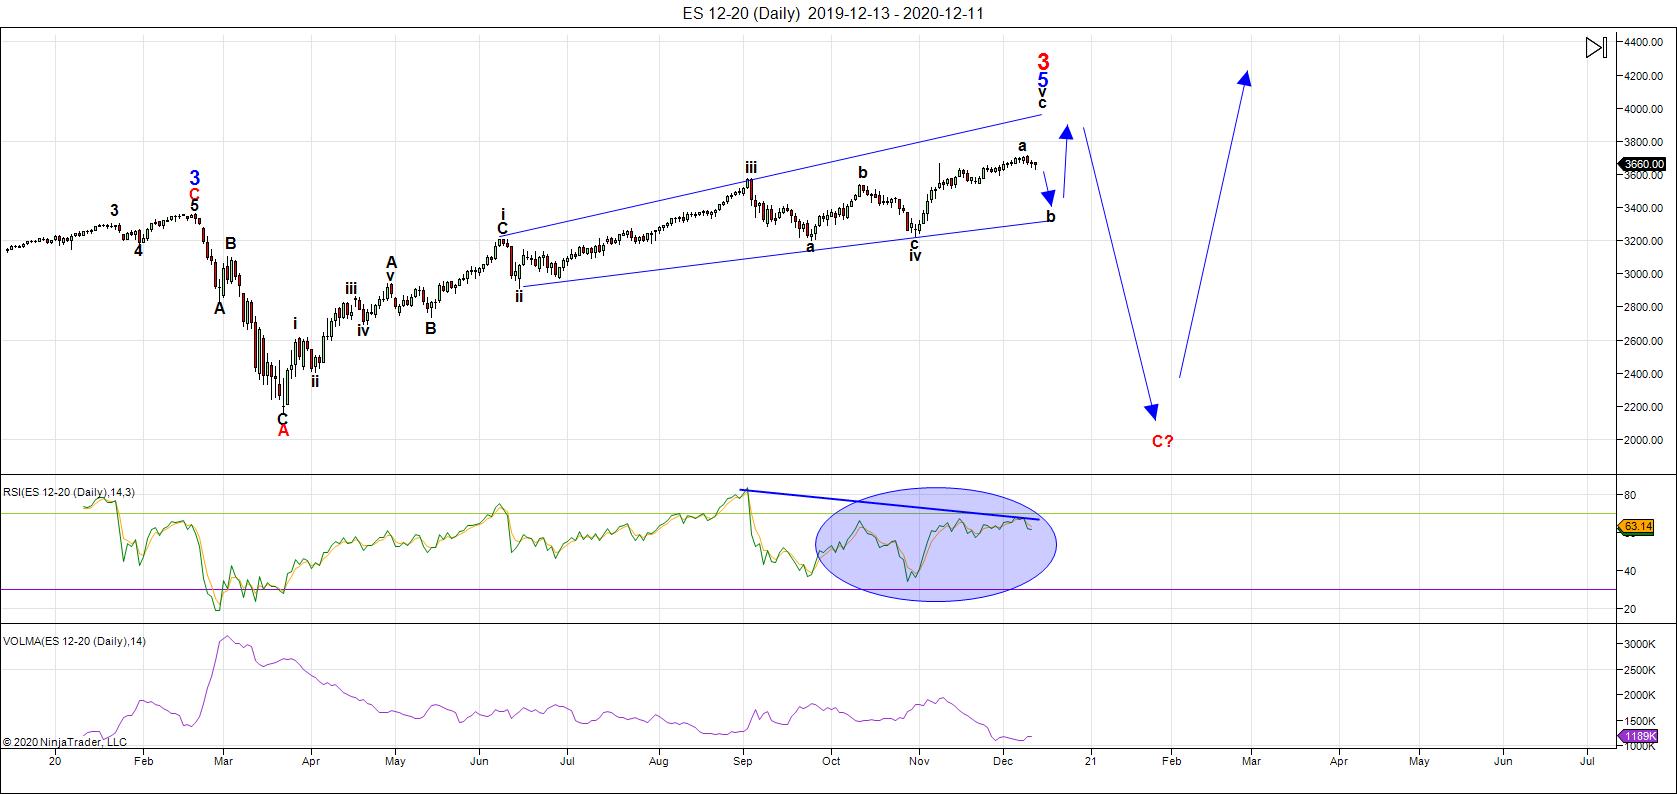
Above is the daily chart of ES (click to enlarge, as with any of my charts).
This week, we saw an ending expanding diagonal in ES that turned slightly early (it didn't test the upper trendline on the final wave), and so we've begun the expected B wave correction to the larger pattern, which is a larger ending expanding diagonal.
These patterns are exceptionally rare (and it's not a good idea to call them early for that reason), but they're all over this market at the moment.
We're currently sitting with an A wave to the downside complete and a B wave in its final stages this weekend. I would expect the C wave down to take most of the rest of the coming week.
After the C wave is complete, we'll be in the final leg of this fifth wave of the ending expanding diagonal, with the upper trendline (or close to it) as the ultimate target.
NQ is in an ending diagonal and appears to have begun a bearish fourth wave, which should also take most of the week to complete. Then, it's up in a final fifth wave.
___________________________
Summary: The ending diagonal pattern is playing out. We're in the final fifth wave, having completed the A wave and turning down into a B wave.
The SP500 also appears to be in an ending expanding diagonal. Most other US market indices have similar patterns. Diagonals are ending patterns and warn of an impending, dramatic trend change after they're complete. This puts us in the final stages of this rally up from March of this year.
The resulting trend change will target an area under 2100 in SPX, and will likely be a combination pattern and, as such, may contain zigzags, flats, and possibly a triangle or ending diagonal at the bottom. However, I'm leaning towards a series of zigzags, which are corrective waves, and will likely come down fast.
Once we've completed the fourth wave down, we'll have a long climb to a final slight new high in a fifth wave of this 500 year cycle top.
______________________________________


