
The Road Ahead
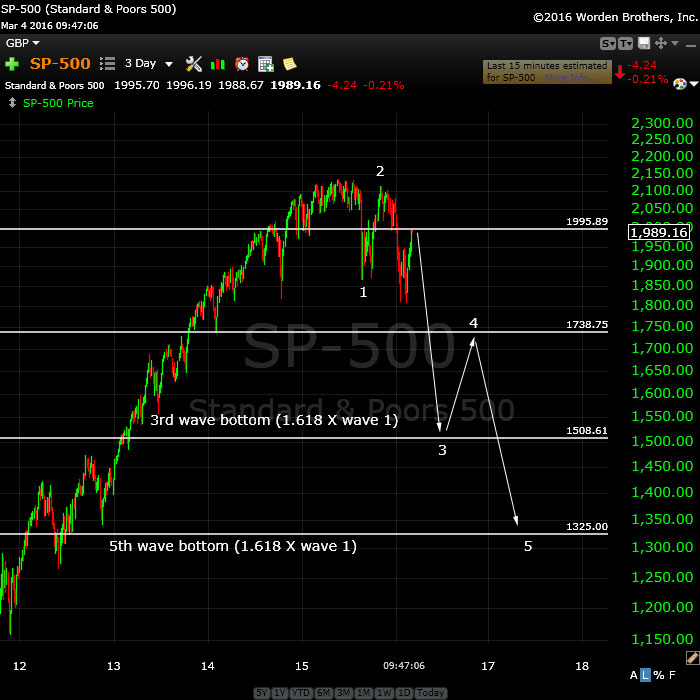
Above is a 3 day chart of the SP500 showing the road ahead. This would be the third wave of the first (of the third) down. You can can see the first and second wave marked. We’re beginning the third wave down.
_____________________
Update Friday, March 4, 9 AM EST (before open)
This is exactly what I was expecting. Eur/usd turned yesterday. It has now done one motive wave up in 5 waves and with the labor report, retraced 62% in 2nd wave. It’s poised to head up in a third wave.
Futures popped to a new high. For “pioneers,” I would wait for futures to either do a 62% retrace or a double top (more likely). Cash has to now get to the target and I’d expect that to happen shortly after the open. Then it should be down, down, down in both cash and futures.
USD/CAD should also head up from here.
_______________________
First Wave Down – What to Watch For
Tonight we’re dangerously close to a top of a second wave (in some cases, a 4th wave).
Let’s look at the SP500. When we turn over, we should drop like a stone. A good index to look at in terms of what motive looks like is IWM – perfectly formed motive waves.
The first wave down will be in 5 waves and will likely drop to about 1890 SPX (previous 4th wave). After that, we should get a second wave that will retrace in 3 waves to about 1958 (62%). That’s the preferred EW entry point. So don’t feel you have to rush in. There’ll be a much better opportunity at the second wave level than at the top and the risk is substantially reduced.
______________________________
Targets
Here are the targets for the major indices as I see them. We’re on our way in SP to a second wave (62% retrace) while NDX seems to be focused on a 4th wave. Both turnovers lead to dramatic drops.
Keep in mind that they all have to get to their targets. The more bullish assets may exceed them, but the stragglers are the ones to watch. I’m projecting Friday morning as a most probable turn date. There’s a labor report due out an hour before market open.
ES: 1988
NQ: ~4367 (revised as it’s a fourth wave)
SPX: 2000
DOW: 17,005
SPY: 200
IWM: 110.19 (IWM tonight is at the 38% retrace level of the entire wave down). I’m not sure why that is, but it could be the turnover level for this index—we’ll figure out the numbering later.
NYSE: 10,000
GDOW: 2244
This is a corrective wave we’re in. There is nowhere else to go but down (after it gets this rally out of its system). As they might say in some US election campaigns … there’s is no path to a new high.
____________________________
Update Wednesday, March 2, 730 am EST
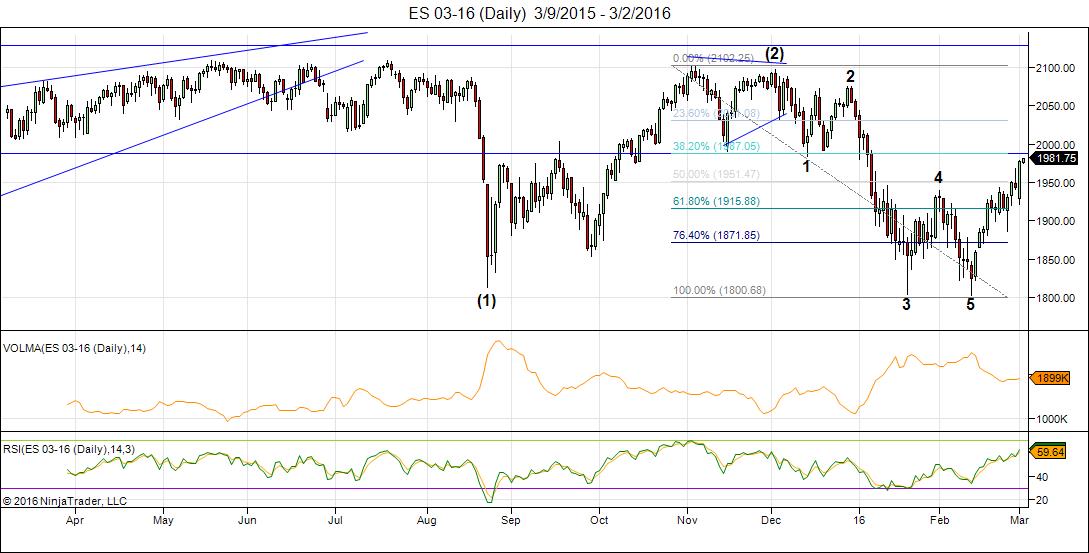
Here’s the daily chart of ES (SPX futures) I happened to “back out” the ES chart to a daily and found that it’s the best daily chart of all of them because it has a really clear picture of where we are. We’ve completed a full motive wave down (again the 5th wave is short and overlapping—could be an ending diagonal, but in any case, suggests this is a fourth wave). The large retrace we’re at the top of has now retraced almost 62% to 1984. However, the 62% market is at 1988, so this is not technically a second wave although exceptionally close.
The other thing that happened is that there was a bit of a “rejection” at 1984 and I’m sure this has to do with the fact that the bottom of the first wave is at 1983.50. So we’ve retraced into the area of the first wave but only by 50%.
This is important because if we retrace into the first wave, this wave up can no longer be a 4th wave; it has to be a second wave and that would mean a third is to come. So it still makes it questionable as to what wave we’re in. Perhaps we’ll get a better idea this morning.
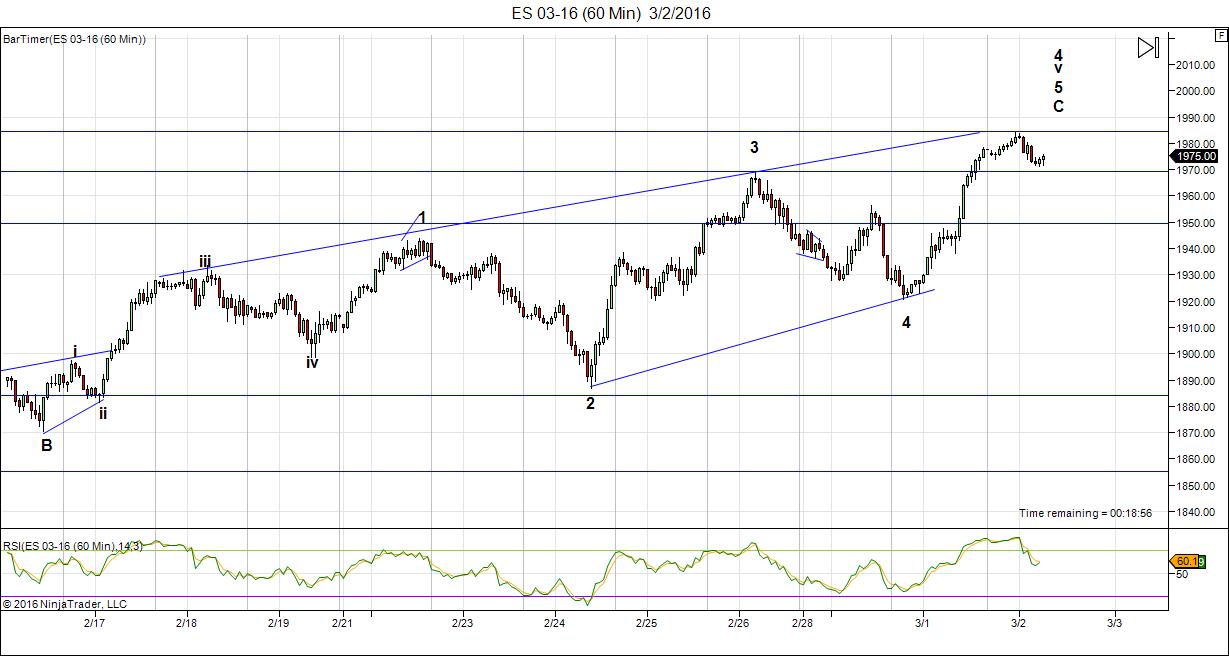
Above is the 60 minute chart of ES showing what we accomplished overnight. You can see the large ending diagonal. We appear to have done a small 4th wave in the last few hours and are poised to do the fifth wave up. Because of the nature of ending diagonals, I have no firm upside target. We should at least meet the upper trendline and usually we’d exceed it.
The DOW appears to have another small leg to go to hit the upper trendline. I also note that eur/usd may have bottomed (it still could spike down one last time while equities spike up, but it’s close to a bottom, nonetheless). USDCAD looks like it has one more spike down to go.
Note that I had a cycle turn date yesterday and there’s a stronger one of March 5, which is Friday. So there are a few options in terms of what happens next short term and I’m afraid I can’t offer much more insight than this.
If you’re looking for a stop entry, it would be just below the fourth wave, slightly below the previous high, at about 1967 ES.
Good luck!
__________________________
Update Tuesday, March 1, 12:15, EST
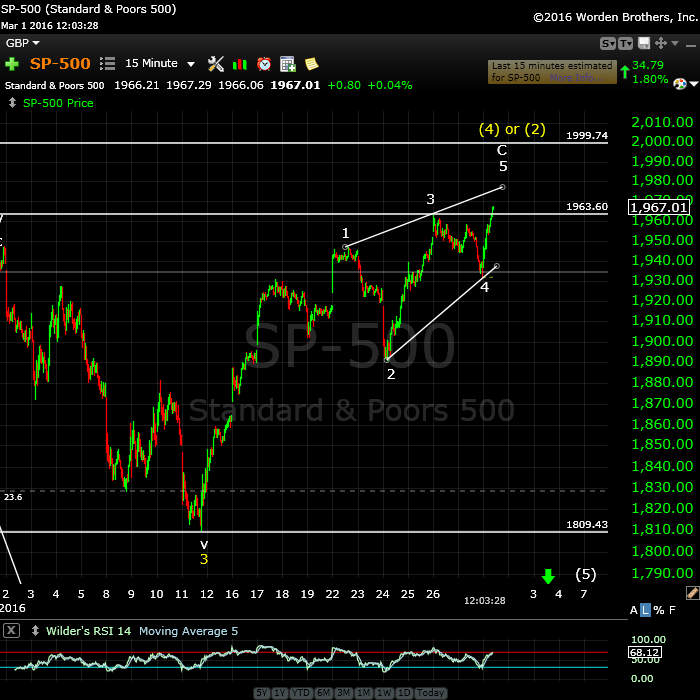
The 15 minute chart of the SP500. Now I’m seeing ending diagonals forming on all the cash indices (as well as futures). I don’t have upside targets for these as they generally exceed the upper trendline (they do a “throw-over) and end sharply. They can immediately retrace to the bottom of the pattern (in this case 1890 or so).
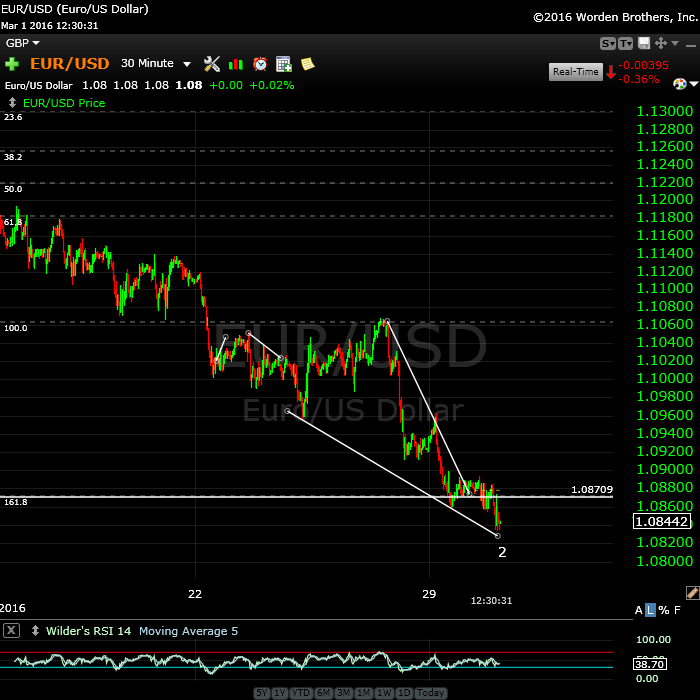
And here’s a chart of the euro (3o min) with it’s incredibly sharp ending diagonal that’s virtually at an end and just over the measure target (horizontal line).
_______________________
Update Tuesday, March 1, 10:15, EST
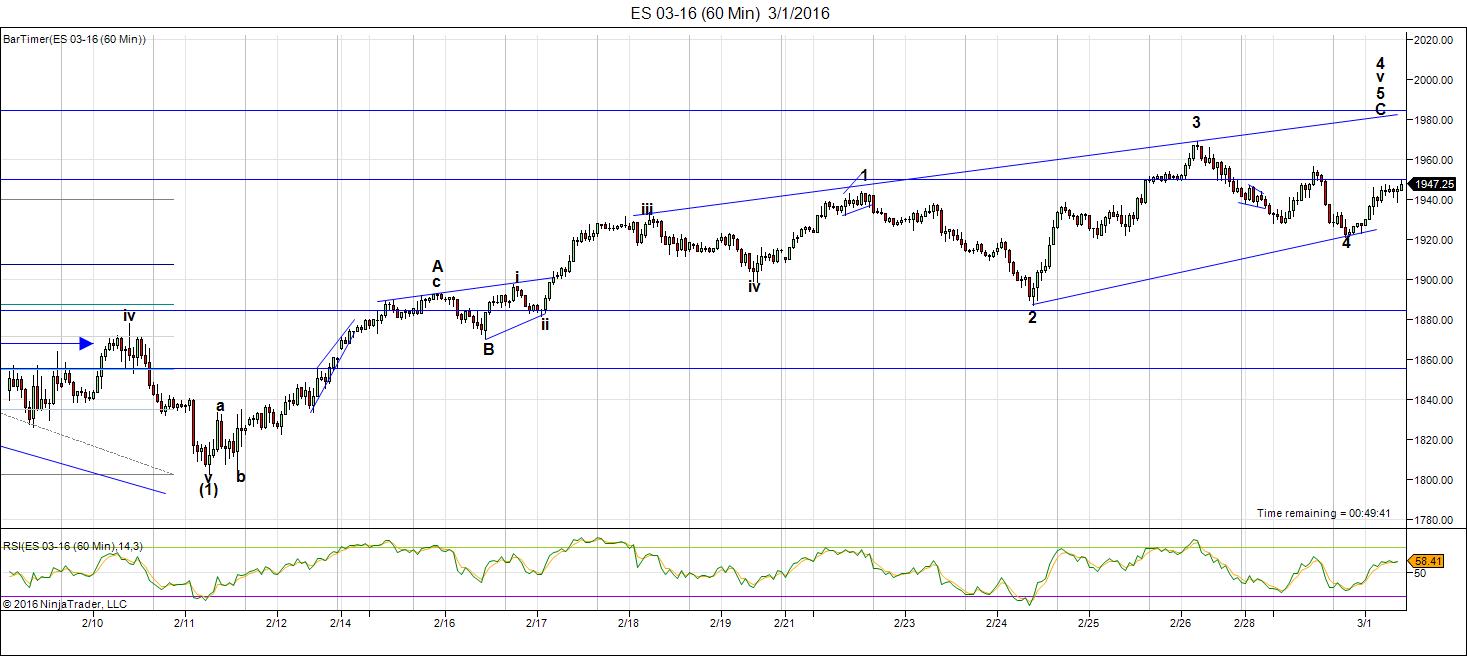
Above is the 60 minute chart of the final leg of ES. I am still counting one more leg up to go in an ending diagonal. The first wave down from 3 looks motive (the closer you get to a top, the more motive waves tend to look), but has a B and C leg down after it, which makes it a 3. There is an outside possibility, that we could just correct to the top of the B wave and create a double pronged wave 2 and head down. I think that a much smaller possibility as I don’t see another obvious option for the ending diagonal.
Currencies appear to be bottoming.
____________________________
Update Monday After the Close, Feb 29
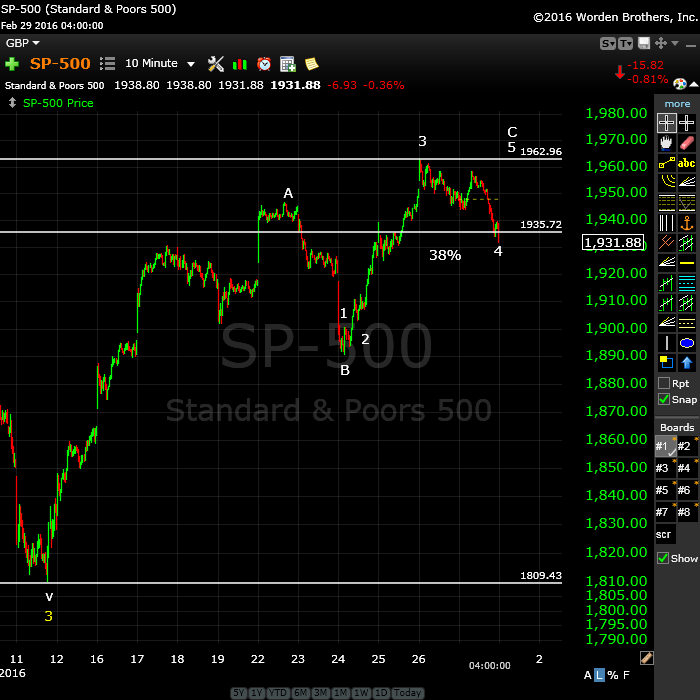
Above is the 10 minute chart of the SP500. We have a corrective (ABC) wave up in 3 waves. The C wave shows 5 waves almost complete. The horizontal line at 1935.72 is at the 38% level, which is a common retrace level for a 4th wave retrace. We’ve come down in a very clear 3 waves. Watch for a turnover if we reach a new high first thing tomorrow.
I now have a cycle turn date for both March 1 and March 4 for equities.
_____________________________
Update Monday at the Open, Feb 29
This continues to be the most brutal market I’ve ever seen (mostly in futures and currencies, like the euro).
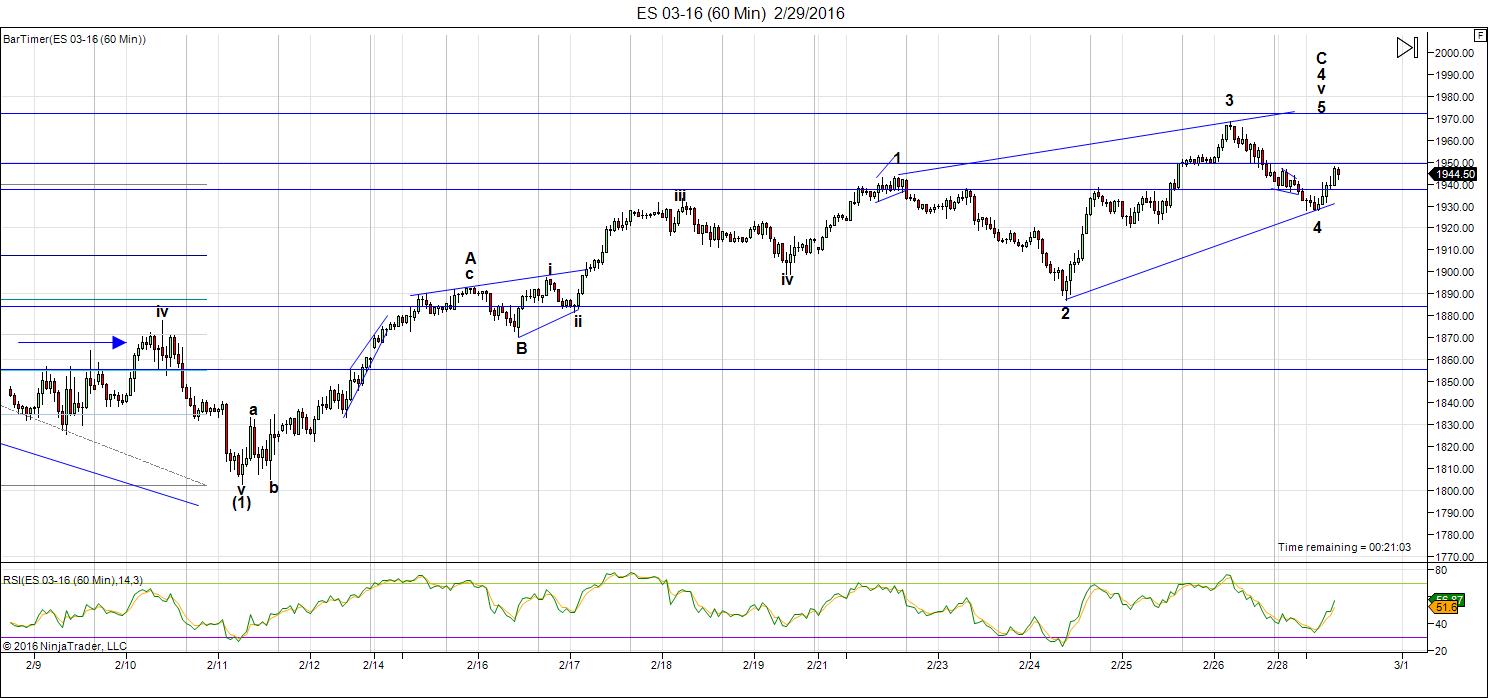
Futures overnight completed an ending diagonal to the downside (as part of a wave 4 leg down) and now are completing what appears to be an ongoing ending diagonal to the upside. Above is the 60 minute chart of ES (emini SPX futures) showing the large ending diagonal. These things keep appearing at just about every wave end and it makes this market extremely difficult to call and trade. Be really careful. I expect a new top here but I don’t have an upside target, as ending diagonals stop when they want to and do a dramatic reversal. You just have to look at the euro from last night at about 3am EST to see the sharp reversal (below).
This last wave up should be in three waves. We are close to a major top.
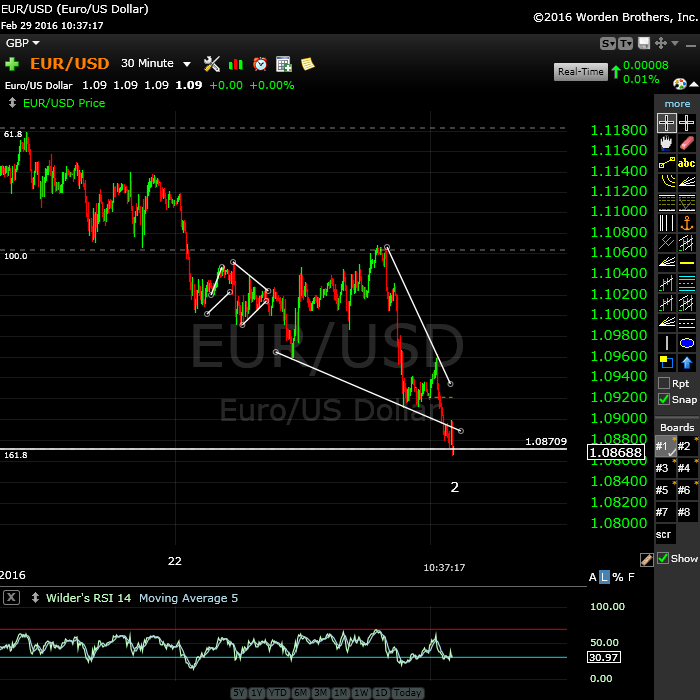
Above is the 30 minute chart of the eurusd. It’s at the projected target I noted in my the video on the weekend.and putting in yet another ending diagonal. It also finished a smaller ending diagonal to the upside overnight and you can see the sharp reversal just above 1.096. I think we’ll see one more small spike up within the trendlines before a final leg down to a new low. Then everything should reverse.
SPX; My projection for the SPX hasn’t really changed. It appears to be in a final fourth wave. It’s come down so far in 3 waves, which means it should retrace to the top. It may come down a little further before it heads up.
___________________________
Original Post (Saturday, Feb 27)
Governments and Our Money—A Really Terrible Cocktail
Well, the G20 concluded and absolutely nothing happened, not that I was expecting anything. You can read about it in zerohedge. The market was likely expecting a lot, but now cycles have taken over, the mood worldwide has turned decidedly sour, and central banks are simply out of ammunition.
It’s absolutely scary when governments get their hands on our money, as they’ve had outright since 1971. Inflation has been rampant right across the world and now, of course we have the largest debt bubble in history on our hands. It will unravel in its own time (over the next 5 years or so), but it will do it in a predictable manner in the major markets … and Elliott Wave manner, with motive waves down for the first leg, then a large B wave, and a final drop to the bottom.
Governments have now destroyed our currencies, are in the midst of currency wars, and have no idea of the damage they are doing to international relations, which will eventually lead to another world war, even though its happened over and over again in history … yawn.
Can we do anything to stop it? Likely not, but we can take steps to get out of the road and ensure that those around us stay safe and sound while our politicians act like “children let loose.” I think the opportunity is to use this new resource (the internet) to help educate all those who want to learn the truth and perhaps the truth will win out.
I would also like to have some long term affect on the banksters continually stealing from us.
If you want to know more, this past week I happened across the very best explanation of the international monetary system, its history with gold, and how governments inflating for their own ends have destroyed our future. The world is in one hell of a mess.
It’s free, only about 130 pages, an easy read and from the Mises Institute. It’s entitled “What Has Government Done to Our Money?” I’ll add the link to the appropriate spot in the forum.
Global Cooling
If you missed my interview on FXStreet with Dale Pinkert, it’s here (and in the forum). He ended up calling it “Global Cooling,” although I had no idea we were headed in that direction.
The Gap
If you were with me in November of last year when we were watching the NYSE and GDOW trying the reach a 62% retrace level, you may remember my comments about all the major indices having to eventually reach their targets before they turn down en masse. Here we are again.
We’re so close to a turn down, but there are still some stragglers. The Nasdaq has not quite tested the previous 4th wave high. Neither has GDOW. IWM is just shy of the 38% retrace level (cents away), but yet we’re not going to turn until they get there. So stand by. It won’t be much longer.
For over a week now, I’ve been advocating we’re headed for a fourth wave top in the US indices and that the SP500 is about to drop 300 points. This is still my position. The count continues to support it. In fact, the entire market (currencies, gold, etc.) is supporting it. I look at a lot of charts when I do my work and, as I stated in a comment Friday (and have been saying since last fall), the markets are all moving as one. That being the case, it takes them longer to turn (because ‘the whole world’ has to turn) and head in the opposite direction at the same time. This is what I believe we’re witnessing now.
Full moons always elevate the psyche and this week, we certainly saw that in the blog. Let’s just keep our eye on the ball. EW analysis works. I’ve never seen it fail.
Summary
Here are the indices that are at the top of what appears to be wave 4: NQ, ES, YM, SP500, IWM, NDX, Nasdaq Comp, RUA, DOW, SPY, NYSE, GDOW, DIA … to name a few. Currencies appear to be at inflection points.
Stocks at the top of retraces: FB, AMZN, NFLX (wave 4), IBM, BLK
AAPL is in wave 4 of 3 with a long way down yet to go. So is GS (good!) There seem to be a lot of stocks in a third or 4th of the third at the moment.
Timing of the turn: I note that we have had a major turn at the beginning of every month since September of last year. Wave 4 came down in two weeks and it’s rallied to this point for the past two weeks. The time factors should be similar. We’ve completed 5 waves up in the most recent wave. 5 waves denotes a wave end and a trend change.
My Availability
With that in mind, I will answer blog queries if they ask reasonable questions and don’t make me guess what asset you’re talking about, or suggest that I go and do some work looking up old information. I’m here to help understand the market, and more than that, have a dialogue about the larger implications of the meltdown we’re in (on the world, and you) in general. That’s what the forum is for, in particular.
I’m more than willing to give of my time and knowledge in understanding Elliott Waves and how cycles affect all aspects of our lives, but quite frankly, I get tired of the comments suggesting I have no idea what I’m talking about. Save them.
I will likely be available less frequently during market hours, as my book is getting further behind and I must get it finished. Distractions must be put on the shelf for the moment. I will answer what I can after hours.
That you Wouter for stepping in and attempting to bring back some sanity while I reviewed some charts.
The video this weekend focuses on the tiny gap that still exists between our target in some indices and where we left off Friday. I’ll also post a couple of pertinent charts below.
Here’s a video overview of the market as at Saturaday, February 27:
Market Report for Feb 29  |
 |
Make sure you zoom the video to full size with frame expander (arrows) in the bottom right hand corner and also set the quality to as high as your web connection allows. This is an HD quality video so the best viewing is at that level. |
_______________________________
Here are some pertinent charts relating to “the gap.”
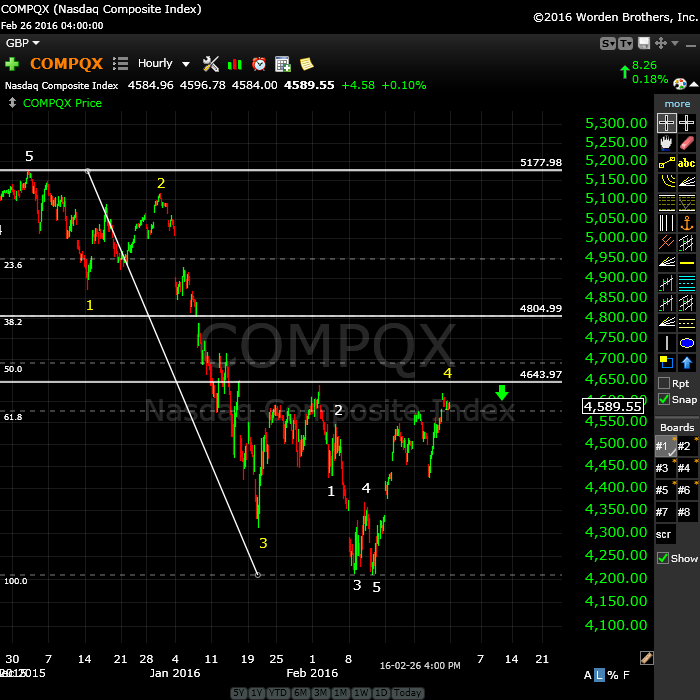
Above is the one hour chart of the Nasdaq. You can see that the 4th wave (yellow) is sitting just below the previous fourth wave high. It’s one of the “stragglers” I was talking about. It has the straddle the gap. I expect it to get there sometime early this week. The downside target once it gets there is 3611.
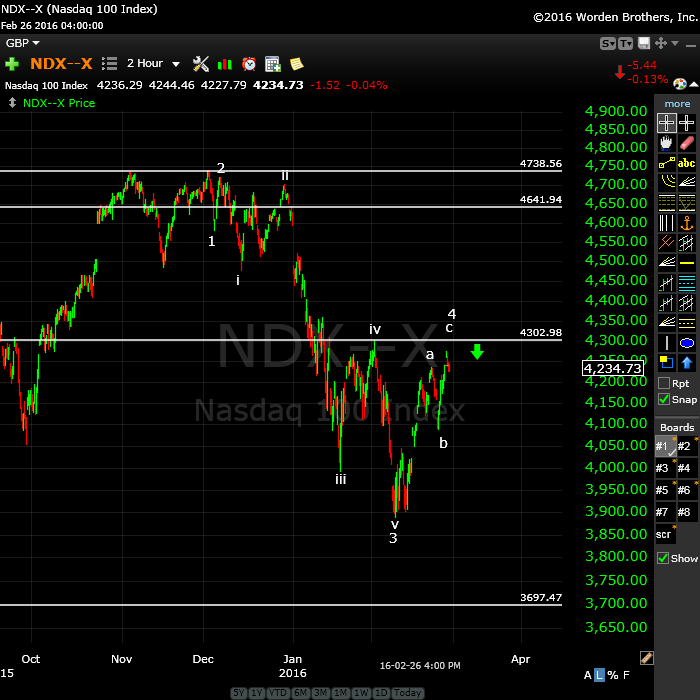
Above is a 2 hour chart of the NDX (largest 100 stocks in the Nasdaq). It has a very clear motive wave down from the top of the market. It shows that we’re completing wave 4 and should head into wave 5 down shortly. We need to reach the previous high just above 4300.
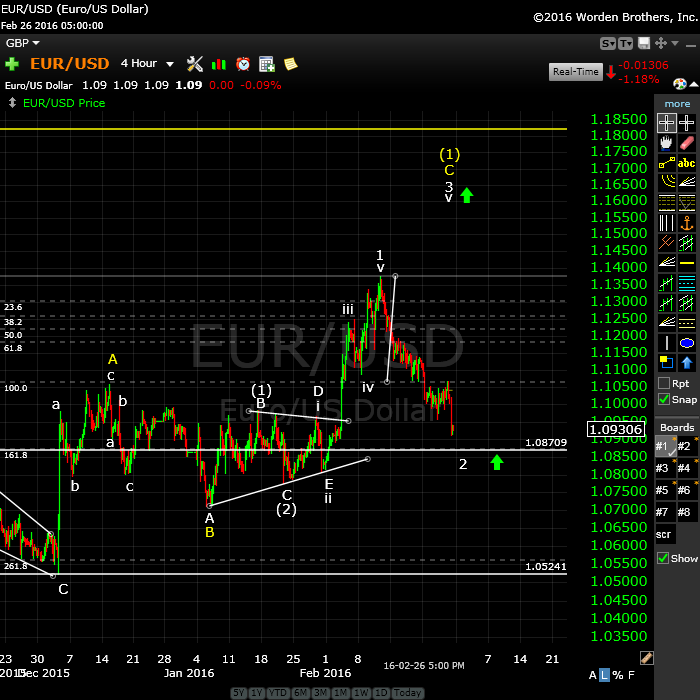
Above is the 4 hour chart of the Nasdaq. The horizontal line at 1.08709 is the 62% retracement level, which would represent wave 2. You can see the existing gap. We need to get to the 62% line at least before turning up into a third wave of the C wave up.
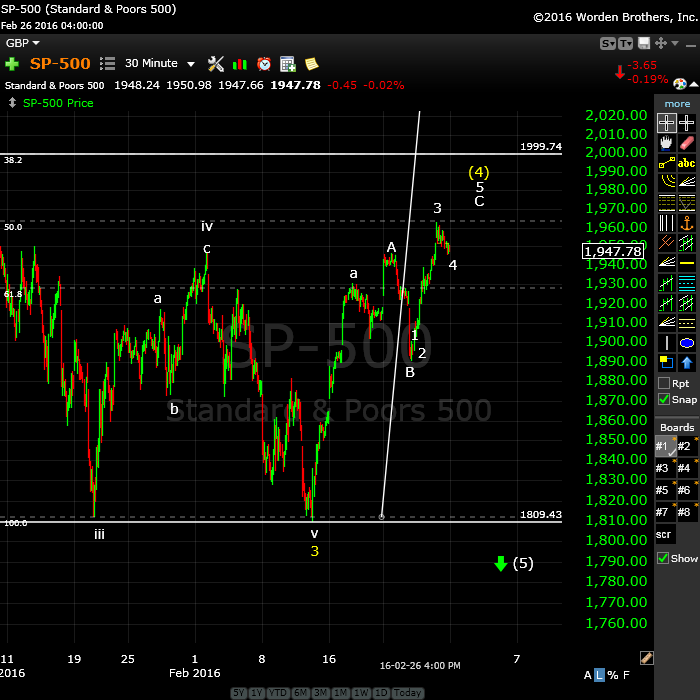
Above I’ve drilled down to the 30 minute chart of the SP500, so that you can see the wave structure. The final wave up is in five waves (subwaves) and a larger 5th wave up to a new high is needed to finish off this wave. If we measure wave 1 of that C wave, 1.618 right now takes us to a double top with the existing wave 3 high on the chart. The horizontal line at the top of the chart represents the 62% retracement level.
The downside target for wave 5 is 1620.
Good trading.


Oops; somebody got Peter upset. Sure hope it wasn’t me. Anyway; as I said yesterday, we are stuck between apogee and last quarter. The only tradingday in between is Monday. I see very strong vibrations 2/26-27-28 and 3/1. So that is a nice confirmation.
After analysing some more – and sleeping on it – I have to present an alternative scenario. I had seen that early april we have a very strong date 4/4-6, but wasn’t sure what to do with it. But now I see a new possiblity. It goes like this. Monday will be a severe turn day and we will be down in 3/9 – close to the solar eclipse. But after that we may retrace into 3/22 – close to the equinox. After that it would be down again into 4/5-6.
What doesn’t change is a strong down move this week.
Cheers,
André
André!
I would say: 4 or 7 March a high, mid March a low, begin April a high so the exact opposite of your alternative scenario. 😉 However, you are way more specialized in moon/planet/sun stuff than me. I am just a practical guy. 😉
Cheers,
W
Whazzup,
With the new moon at perigee 3/9, gravity is strong. So a low is a reasonable expectation. Besides, The turn this weekend is really heavy, so the market needs some time to digest. Can’t imagine it will turn within 2 days.
We’ll see.
Tomorrow vedic moon in Scorpio. Usually bad for markets.
André! 🙂
I think a downwards movement first as well. But still we need to finish the wave up as Peter has shown us in his video. If we go down hard first and not reach the targets, I still see it turn in 2-3 days since these environments are volatile as hell and everything is possible as we have witnessed the last few weeks… Again, not understanding all the planets stuff etcetera allthough the moon is not totally new for me. 🙂 Thanks for your reply!
Cheers,
W
Whazzup
3/5 is a strong mastertiming date. 3/4 we have the jobreport. This would be my first scenario. Down into 4, up into 9, down into 12, up into 15 and down again into 3/18. 3/18 is a very strong date and will be tested for sure. It could even be a major crashdate. This would fit the scenario for a low by the end of April.
SPX confirmed intraday sell Friday at 11:29am…after a dip into mid-March (16?) we should see a high in the April 5 time frame at approximately the February 1 and February 26 levels…thoroughly enjoy Peter’s videos and analysis…thanks for sharing!
Thanks for the update Peet! This week will bring us some clarity about when the stupid wave 4 will finish. 🙂 Let’s wait and find out! 🙂
Cheers,
W
Peter,
thank you for your patience.
Some our posts may bother you, but believe me it’s not intentionally from our side.
Just this market frustrates all of us.
One thing is clear now that the market will be waiting at least ECB until the 10th of March or may be even the FED on the 19th. It may consolidate for a while next week and spike up before ECB but the high should be made on the 10th of March or few days after depending upon the ECB decision.
I suspect not. I note that we have had a major turn at the beginning of every month since September of last year. Wave 4 came down in two weeks and it’s rallied to this point for the past two weeks. The time factors should be similar. It’s similar to what happened at the top between Nov 3 and Dec 1. We’ve completed 5 waves up in the most recent wave. 5 waves denotes a wave end.
Peter,
Any projections on timing on start to finish on leg 5.
Thanks
R
I have nothing specific. However, the 5th wave of the first is a rather sharp drop usually. It has to travel as far as all of wave one to the bottom of 3 of 1. Wave one came down from the truncated top in 1.5 months. Perhaps take that as a guesstimate. (Dec 2 – Jan 20)
As a summary, here are the indices that are at the top of what appears to be wave 4: NQ, ES, YM, SP500, IWM, NDX, Nasdaq Comp, RUA, DOW, SPY, NYSE, GDOW, DIA … to name a few. Currencies appear to be at inflection points.
Stocks at the top of retraces: FB, AMZN, NFLX (wave 4), IBM, BLK
AAPL is in wave 4 of 3 with a long way down yet to go. So is GS (good!) There seem to be a lot of stocks in a third or 4th of the third at the moment.
I added a chart of NDX, since it has such a clear, motive wave count down from the top of the market.
Thank you for the excellent education and forecasts.
We’re back into ending diagonals everywhere, which makes this market very hard to forecast. I’ve added two charts at the top of the post with some comments on the overnight market.
Looks like the IWM hit the 38.2 retracement. At least one more index has gotten to the target.
Ted,
4th waves have to get to at least a 38% retrace, but the target is typically the previous 4th wave, which in the case of IWM, appears to be at about 1.05. I’m watching closely today. We could get a turnover. I expect the main cash indices to do a double top (at least).
I meant 105, of course … 🙂
I was assuming the 1.05 was your 5 year out target on the IWM 🙂
Thanks for pointing me to the previous 4th wave
Haha! That’s very funny!
I put us at about the half-way point for today’s session (in time). It looks to me like we’re working on completing the fourth wave and that would leave us with just the 5th of 5th to go (cash indices).
Major currency pairs have hardly moved. The question is whether we can make it up to test the previous high before the end of the day (the last day of February).
In the SP500, the current wave down (I’m suggesting it’s the fourth, as it seems to be dropping to the previous fourth) is in overlapping waves. It’s essentially a 3-waver. Expect a retrace to the top.
Futures will be putting in their B wave.
I don’t expect us to turn over today. But I’ll certainly be focused on the opening tomorrow.
Hi Peter,
What today would be a reasonable sign that the top is in and the morning retrace was sufficient?
My interest from a fundamental (yeah i know.. off limits : ) point is that the PM’s have shown decent strength today as the market went higher. Most unusual in the recent market. There is a fair amount of talk that the global banking scene is about to go nuclear with derivative debt that can never be repaid. We know that has been spoken of a lot. But, if a bona fide report /confession comes out, the markets will slide and not recover. This is what I am trying to catch a forewarning of…
thx..
Gary G.
The latest drop in 3 waves tends to point even higher. And no, fundamentals are not off-limits, but they don’t affect intraday movement. We’re really close to a top, but I don’t see anything that tells me we’re there yet. It requires a double top at least to wipe out this corrective wave down. I would consider the next new high as ripe for a turnover. So far, nothing has changed in the technical analysis.
Frustrating, I know.
For the SP500, the appropriate level for a fourth wave to stop is at the 38% level, which is at 1935. This would suggest a fifth wave up to come.
Below that level, we might start to question the structure. However, it’s still down very obviously in 3 waves now.
We took all day to put in a fourth wave in the cash indices (a C wave down in ES). As I’ve mentioned earlier, my focus in on the open tomorrow. Being the last day of the month, window dressing is the norm.
We’ve had a turn in the first few days of every month since September. Timing of the waves is also right. So sometime in the next short while we should get our wish …
I posted a new chart for the SP500 at the end of today’s session.
Peter-
Looks like we are roughly half way back to the previous highs from the overnight lows on the S&P 500 Futures. One of your notes from yesterday’s update at the open said that the expected move up in futures would be in three waves. Are you expecting three waves to finish this move up or did the new lows mean we should expect 5 waves?
I’m expecting three waves up in futures, as they appear to be in an ending diagonal. Ending diagonals are all in 3’s. I expect the usual 5 up in cash. In futures, we only have a C wave left to go this morning.
Ted,
There is a chance that futures have already topped. The first wave down looks motive to me and then there’s a B and C wave, which could be part of the second wave. If the wave up now in futures simply tests the top of the B wave from yesterday at the 62% level, we could consider it topped. Cash needs new highs.
It’s just that the A wave down in futures looks motive and futures have a lot further to go up than cash … so I wonder if we did indeed top there. Currencies are very near a bottom.
Looking again, I’m a little concerned that ES may turn at theh 62% level, based on where everything else is. That would be about 1957-60. It’s lagging the others.
A lot less concerned about ES now. But it may only make a double top … we wait to see.
I posted a chart of ES.
Eurusd is at the bottom of a very large ending diagonal. I think usdcad has bottomed. I’m seeing five waves up and three down, with a turn.
We’re very close to a turn all around.
Peter,
Does your ES chart at the top imply the ES may go to ~1982?
As a true ending diagonal, that’s what I would expect, but it could also just do a double top at about 1970. Cash indices are getting close to their targets, so I think ES will end earlier than the ultimate ending diagonal expectation. Five waves up in the C wave should mark the top, as with just about everything else.
DOW to about 16,795. I called CAD a bit early. It’s in a throw-over ending diagonal (of course). My measured target is about 1.34
I haven’t been watching all the indices, but I took a look at them all and they all look to be in ending diagonals (cash), so I don’t really have an upside target in that case. They will all likely exceed the upper trendline. I will post a chart of SPX in a few minutes. I suspect we’re going to see these ending diagonals all the way down … oh, yey!
I always put my focus on the weakest one of the batch. They can all exceed the target, that’s no problem. But they all have to at least get there. So once the weakest one makes it, then I look for a turn.
I posted the chart of SP500.
Otherwise, it looks like everything is at the target … even GDOW. So it’s a case of looking now for the rollover. In EW terms, that would be 5 waves down and then three up. For pioneers, it’s a lower high.
For me the big question is are we likely to turn here (ES 1968.75) which was a perfect FIB retrace from Feb., 26th. OR are we likely to continue up to ES ~1982?
I would guess we’re going to the upper end from everything I see in futures and cash. And we could exceed the upper trendline, but this is a weak market, so I don’t expect it to go far. However, this begs the question, “Is this wave 4 or 2?” I haven’t had time to figure that out and it doesn’t make any difference at the moment.
Also, currencies are pretty much “done.”
I DO NOT like ending diagonals!
Peter, Excellent analysis and charts…going forward I intend to to ‘listen’ and watch…thanks for sharing!
Thanks and you’re welcome. 🙂
I also added the eurusd chart at the top.
Peter good work I just came across this site are you looking top this week in spx? And then hard drop still lower low? You mention that had a usdcad 134 target hit are you looking usdcad higher from here ? Thanks
usdcad higher. Yes. You can go through the latest post for the rest.
SPX now @ 1968
High today @ 1970.22
We either did hit the TOP at 1970.22 , if not then next BIG stop will be 1979 – 1981
AZ
Ah … Mr. Fork! Right on time. I would say the higher level. We need to hit the upper trendline and exceed it at least a bit.
Peter … I like my new name :-))
Yes, I think it will be the 1979 – 1981
Let us wait and see
Regards
AZ
AZ,
Thanks for this. Nice to have supporting info. Especially in ending diagonals.
This wave today up from SPX1941to 1971 looks pretty motive and completed
I place us now in wave 4 of the final 5th wave up. Another length of the third wave (the fifth) would end us at about 1975.50 ES.
It’s difficult getting good measurements on 1 minute charts. I think now, backing them out a bit, it’s more likely we just finished the 3rd wave of the C wave and we have a fifth to go. If that’s the case, the top of 5 is more likely around 1982 ES, which is where it should be by the pattern (and pitchfork). I question whether we’re going to finish up today.
This certainly is a frustrating market. Another day with no resolution.
Not all the indices have completed the ending diagonal pattern. We’ll have to see what happens overnight. We’re now also getting close to a possible 2nd wave in some of the indices.
However, currencies appear to be at the ends of diagonals themselves and I don’t see much more leeway before they turn.
Ending diagonals are my least favorite pattern, as there’s no EW end projection. They typically do a throw-over (above or below the trendline) and immediately reverse and there’s little warning.
The key here in the turn is that the wave down has to be a motive wave and that means after one wave down (of five waves), there will be a 2nd wave up (of 3 waves), wave 2, which is the ideal entry point.
I’m going to be out-of-service tomorrow morning (trying to blast a kidney stone to dust), so if anything happens in futures tonight that looks important, I’ll attempt to post something about it in the blog early in the morning.
I hope all goes well, Peter.
Mike,
Thanks, I have a long history with these things. My concern is that I really think the market will turn tomorrow morning. Don’t want to miss it. Looking around tonight, there are so many assets at inflection points.
Peter
I hope your operation will go well tomorrow .
I still feel SPX should stop within our target , then we go down.
Regards
AZ
AZ,
It’s actually ultrasound, I think. In any event, non-intrusive. They simply try to blast it with a wave … another kind of wave from what we’re used to … haha.
I think we’ll turn tomorrow morning. I’m trying to figure out how to set up a trade in ES … I will have to leave an hour before the market opens. We could actually get an opening gap reversal tomorrow. We’re that close to a top.
Good luck Peter,
I hope you will be better soon.
For anyone not a fan of Facebook (I call it “the look at me!” site), FB is right at a 62% retrace after 5 waves down.
AMZN looks to be in a similar position.
I hope Joe will return in the boathouse soon we need more guidance after March 8?
Peter has been spot on…excellent analysis and charts…it may be best if we minimize the posts and just let Peter do his thing!
Oh no, don’t do that! This is an educational site. Gotta keep the dialogue going … and the cycles info coming in!
gotcha…again, thanks for sharing!
🙂 At the same time, I have no idea why you’d need “guidance” after March 8, since when we top, that wave down will tell us where we are, complete or confirm a first wave down (of the third), and set up the path for the next 5 years or so …
I’ve posted two new charts of ES this morning early.
Oops. My stop entry point in the post had a typo. It’s 1967 ES. I changed it at 8:30 am EST.
Peter,
I admire your work no doubt but to stay open minded is in my experience the best way to play this market.
So I will not be surprissed if the market makes new highs in April like Mahendra is predicting nobody is expecting this but I leave it open as an option that it might happen.
Just got back – a “non-event” this morning in terms of stones.
This wave down does not look motive, so I suspect another high. Maybe we hang around here for another couple of days …
Looking around the market, it’s getting more obvious to me that SPX is going for a second wave. The NDX side of the market may only do a fourth. This means we’ll have a longer wave down, which in SPX, should be 1.6 X the length of the first wave down. That would take us down to about 1520 (at least). We don’t have far to go to reach our targets, so we’ll just grind away until the turn.
The next cycle turn I have is March 4/5 – could be Friday.
Nothing changed in my forecast today. We’re grinding higher. I’ll place likely targets in the blog tonight. My preferred turnover is Friday morning. I think we have another day of the grind. Again, SP indices appear to be doing a second wave and the NDX types are headed for a 4th. Big wave down to come. A little more patience.
On the currency side, euro and CAD are near lows, but they’ll likely turn with the market. Candy store time just around the corner. 🙂
😀
Jobs report could be the catalyst. Or not. Never can tell these days.
It likely will be simply because of the timing.
to any computer guru out there –
My Win 7 laptop is now on its last gasps of life, so I gave in and ordered a replacement, but it comes with Win 10.
When I run investing.com live feed streaming chart on futures on the dying Win 7 machine, it runs within minutes of real time, However, on the Win 10 machine, I have about a 55 minute delay, regardless of browser used – whether Firefox, Chrome or Explorer. I believe I have the updated Java and Shockwave installed.
Is this really due to Win 10, or am I missing something somewhere? Any suggestions on what I am doing wrong to cause the streaming chart to run a 55 minute delay?
I welcome any suggestions….
TIA
If have been using IE before the Edge that has replaced it doesn’t execute java anymore. Try another browser.
Should be the same for Mozilla or Chrome because of security probleme
Thx Dimitri – thanks for the suggestions. streaming real time quotes run fine on the dying Win 7 and on my wife’s Win 8, but i can’t figure out what i need to do to the new Win 10 to make quotes real time; they run consistently one hour delay, even with machines running side by side. Disabled anti-virus and firewall to no effect. I think it is something in Win 10, perhaps as you suggest Win 10 inhibits Java – i gotta find a work around…..
Chrome and Edge under win10 have both the issue with Java.
Firefox is still supporting
I run Win10, with Chrome, and have no issues with that website..
Quotes run neck-and-neck with my older Win7 laptop as well, and run closely (enough) to think of them as almost real-time…..
I doubt it’s in the Win10 software, as it’s an operating system and not the website…
Stupid question, but are your clock and timezone sync’ed up?
Sorry I can’t be more helpful, and while others have complaints about running Win10, I’m happy with it…
Trying to install Win10 onto an older Toshiba laptop created a key/keyboard issue for me, but uninstalling it fixed that… Running Win10 on the new Toshiba laptop has created no problems at all…
Barry – You are a GENIUS! and I am oh, so stupid…… yes, the time zone and clock were out of sync – I must have hit a default in set up. Seems to be working great now….. and even ‘on time’!
I LOVE this forum even more now!
Thank you, Barry!
amb
🙂 I’m sure plenty of people would argue the genius part – hahaha – but glad that fixed it… I love simple solutions!
I posted some likely targets.
In terms of time I expect the first low 3/23. My april low has shifted a bit; I now see 5/13. In between we will see some retraces. I’ll post them this weekend.
André
I think the uptrend is exhausted for now and we will decline a bit into the march 10 timeframe after that it’s up again direction March 23.
Peter-
While most of the indices are 1~1.5% of the targets, the IWM is about 3.6% away. Since you mentioned looking at the weakest index, does the percentage that IWM still has to move give you any concern for the turn date tomorrow? Everything else still seems very reasonable.
Two other thoughts for conversation.
1. Is there another potential turn date next week?
2. Is the 105 target that you mentioned still potentially valid (though a secondary option) and therefore IWM could be considered met? We therefore may see a IWM underperform today and tomorrow, pointing internal weakness.
All of the other indices targets makes sense via timing and distance, and is very helpful. Thanks as always.
Hi Peter
Nice to have you back safe & well :-))
My target of 1979 – 1981 ( SPX ) has failed . So I think we will be going higher .
I feel the TOP will be next Thursday 10th March , for the following reasons .
As you may well know that we are dealing here with 7 years cycle , one of Gann’s most important cycle .
So Let us see some facts about this cycle
Oct 11 , 2007 High TO Oct 15, 2014 Low = 1765 TD ( Trading days )
May 19, 2008 High TO May 19, 2015 TOP HIGH = 1762 TD
July 15, 2008 Low TO July 20, 2015 High = 1765 TD
Now please let us look at this next one , which I feel it is a very important 28 years cycle ( 4 x 7 )
Aug 25 , 1987 High before the crash TO Aug 24 , 2015 A Major Low = 7057 TD / 4 = 1764.25 TD
If we take March 6 , 2009 Major low + 1765 TD = Thursday March 10 , 2016 ( Allow + / – one day ).
I can’t guarantee anything , but what I am showing is a good possibility that the future will be a repetition of the past and we might get our TOP on or around that date , plus or minus one day . So any day between Wed 9th – Friday 11th MARCH .
Now since we have almost a week left to reach our target , then I feel we might go higher than your target of SPX 2000 / SPY 200 …. I feel we might go up further to fill the GAP !!! yes, yes , I know you love it :-))))))
The Gap on SPY @ 203.8 which I think will be around SPX 2020 – 2025 .
Regards
AZ
last week i made the ridiculous suggestion that we may be seeing an inverse head and shoulder pattern. if this is possible, it potentially projects a lot higher – perhaps a full retrace???
http://invst.ly/19bvi
of course, i have been wrong before and i will be wrong again, and again , and again….
amb
Good stuff AZ! I like Gann. 🙂
However, if you check comment number 2, you see the turndate that I gave. 😉
Cheers,
W
I’m going to suggest we let the pattern play out, it’s almost done. I can offer you patience.
Wise decision, Peter
?
Agreed, a little over analyzing on my part
Peter, “congratulations”
It’s Official: Canada Has Sold All Of Its Gold Reserves
Great! Our government is SO INCREDIBLY STUPID!
You must be proud being Canadian Peet. 😉
Don’t bug me. I’m boiling a puck to see it I can get it soft enough to eat.
I was actually writing an article on the “Sorry State of Canadian Finance.” We don’t seem to be able to do anything right. This just adds to to the dilemma.
Biggest real estate bubble in the world, largest household debt in the world, largest debt by a sovereign sub-state (our largest province, Ontario – more debt than California), a resource-based economy, one of the only public central banks (which borrows all its money from private banks), a child as a prime minister, debt that’s over 90% of GDP, and we’re embarking on a new plan to spend billions more … and introduce a carbon tax.
You couldn’t dream this country up … nobody would believe the incompetence.
Oh, and we’re one of about 5 countries in the world that doesn’t require our banks to have any reserves. Zero.
Well, you know where to keep your money
Wow! I had no idea.
Well, now USD goes down while the market goes up.
SPX2000 should be right around the corner
I revised a couple of targets and posted a note about the first wave down—what to watch. If you have any questions, let me know. This will be an important wave to catch. I expect to see 13,200 in the DOW.
Hi Peter
So far the low on jan 20th came on time , the run up from early feb to date
had a little twist in it yet the feb 8th target low low came 2 days late on feb 11th
and the feb 23 target date low came 1 day late on feb 24th .
the date which is march 8th is a target date high . from march 8th we should see
a down trend into march 23rd ( which could be 1 to 2 days late )
the entire structure ? when looking at the dow which is my primary index .
its been nothing but 3 wave moves going back as far as june 2014 .
this next down trend is going to give me the clues im looking for .
cycle wise the bear cycles don’t start kicking in until late june .
the present cycle that began feb 8th ends in late april .
Joe
Hey Joe,
Nice to see you back.
I try to understand what you are writing I have 2 questions:
Do you expect new lows on March 23 and another bottom Late April?
After that a run up till end of June?
Thanks John.
As a summary:
Whazzup: Target High is March 4 or 7, Low is mid-March
Andre: Target low is March 23
AZ: Target High is March 10
Joe: Target High is March 8, Target Low is March 23
New Moon is March 8, Solar Eclipse is March 9, March 10 is Perigree.
Lunar Eclipse is March 23, Apogee is March 25.
I can now see 3/5 was a magnet. 1929 calculation showed 5/20/15 was 90 degrees based on price. 3/5/16 is 90 degrees based on time.
I now analyze all the main indices. This is very revealing. S&P basically made a high 2/26 (price) and 2/29 (time). But Dax went for a high 3/2 (p) and 3/3 (time). Nikkei wants up into 3/4-5. So you see how different indices have different timing. Markets can turn only when everything turns. Nikkei is always the last. But this explains why the market is tired.
The shadow dates give a very strong cluster 3/3-7, of which are 3 highs.
The high angle gives 3/1-3.
Squared number timing gives 3/1-7 with 3/4 being 16-squared from the june high ,17 squared from the may high and 13 squared from the 9/17 high.
3/6 will be a crashdate based on the major 8/24 low. 3/2 a crash date on the june high.
3/3 and 3/4 are trading day fibo’s. 3/6 will be the anniversary of the 2009 low and a standard Gann potential turn date.
So 3/4 is a major squared number resistance on highs.
All techniques now in sync.
So this turn will be as important as the 2015 HOY high. 3/23 and 5/13 will be lows but there will be retraces in between.
I recalculated the date for the bearmarket low. I now see October/November 2020 as a major date. This confirms the 5 year period Peter talked about.
More datails this weekend.
André
Lizh, thanks for the summary! I say 4 / 7 because the turndate from my system is 5/6 (but this is the weekend so…). 🙂
André, thanks for looking at the stuff again. I think this anniversary will be important yes… It will be ‘the high’ for now. 😉
Peter, best EW stuff as always, thanks friend! Still it sucks that we don’t know for sure if we are in wave 4 or 2. How can we tell upfront?
– AEX tells me we made a big A wave down (overlapping 5 waves) from the high (end of november) till the low (11 february) and now a 61,8%-78,6% retracement back up. – Eurostoxx 50 tells me a motive wave 1 down from the top (made a higher top than the AEX and went lower on 11 february) and now a 38%-50% retracement back up.
– S&P 500 tells me we made a motive wave 1 down from the top on begin december (which was truncated). I am with you that 1600 S&P is a ‘normal’ target. Now it makes a retracement back up of 61,8-78,6% which is strong like the AEX.
So in conclusion, as Peter has been saying, all indices do other stuff… Same goes for Europe! One is stronger than the other so they all suggest other wave counts. Now what we have to do, is to find the one that tells the true picture. So Peet, what does NYSE, Russell 2000 and Wilshire 5000 say? 2 Or 4 now back up? I don’t have these charts in my chartingsystem…
Cheers,
W
I’ve told you what waves we’re in. I put up a chart of the daily ES and explained it.
SPX and the like are in wave 2. NDX and the like are in wave 4.
I’ve posted comments at the top of the post.
Keep in mind that this is the most devious market I’ve even seen.
I don’t think we’ve quite topped. 3 wave down so far. Also, the euro looks like 3 up, so I suspect we’ll see a new high in equities before this is all over. My cycle turn date is actually tomorrow (Saturday) so we’re a little early perhaps, but only by hours.
I posted a chart of the projected path once we top.
I see DOW and NYSE are slightly shy of the targets. I think everything else has made it. So we either top today or first thing Monday.
Oh, I see SPX hasn’t quite made it, either. 5 points or so short.
Peter
Are you using 5 minutes charts counting these waves down ( SPX ) ? or longer ?
Regards
AZ
If you’re talking the three waves down I mentioned, I’m watching ES. I have a 1 minute chart up but you can use a 5 minute chart – you actually see it better. On SPX, you have to get down to a 1 minute chart … and the waves are a lot harder to decipher.
Normally, I’d be looking for 5 waves up (and we may get that) but the bigger pattern is an ending diagonal so it will likely look like three waves but you should still get an out of proportion 4th wave and then a final fifth … and maybe a double top. The more important thing I’ll look for on a number of charts at the same time is everything coming to a stop at or slightly above the target.
Better than that is 5 waves down and three up (a second wave at very small degree).
Thank You
And there’s SPX at my target, so we can’t be far away from a turn, I don’t think. Looks like we still have another small wave up to go.
Right around here, I think. Possible double top coming in ES.
Peter,
Your double top. This may be it. I see topping tails on ES 15 min chart and SPY 30 min chart.
LizH
Looking good so far. Actually since it’s an ending diagonal, we shouldn’t get actual double tops.
Maybe we will get a double top. We’re certainly not going without a fight …
Starting to look like a triangle, which suggests one new high.
I think we need that one additional high as I don’t think NYSE has quite made it to 10000 (though very close)
My 62% line for NYSE is actually at 9994 and it’s done a double top there, so it should be done, I think. Yeah, I see I posted 10K but we don’t actually need to get there.
This website is for educational purposes relating to Elliott Wave, natural cycles, and the Quantum Revolution (Great Awakening). I welcome questions or comments about any of these subjects. Due to a heavy schedule, I may not have the time to answer questions that relate to my area of expertise.
I reserve the right to remove any comment that is deemed negative, is unhelpful, or off-topic. Such comments may be removed.
Want to comment? You need to be logged in to comment. You can register here.