
 Not Much Left to Say

I’m expecting an imminent downturn in the US indices, and just about everywhere else.
The small fourth wave from the week before last took 5 days to the downside. I predicted that the fifth wave up would take a similar amount of time, projecting a top either this past Friday or that it could last into Monday. Here we are.
Look for a turn down very early in the week (if we haven’t topped already).
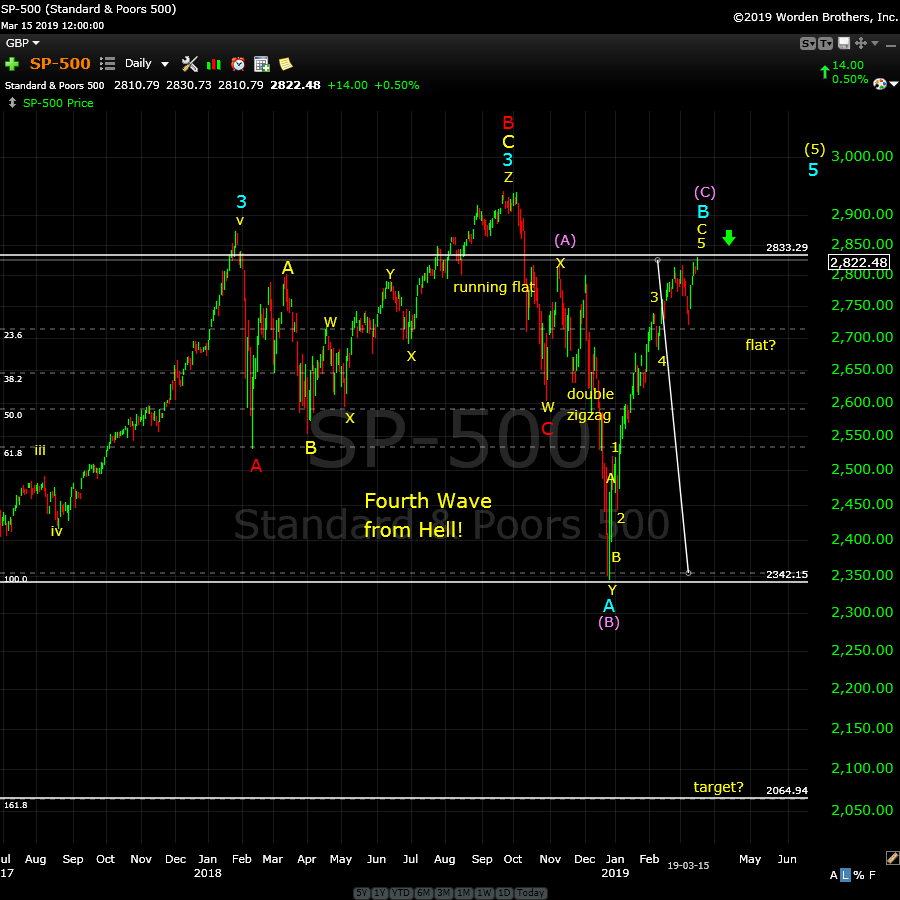
Above is the daily chart of the SP500. (click to expand)
I’ve labelled a possible flat in progress, showing a purple circle A, B, and C label on the chart. The C wave target is shown at 1.618 X the purple (A) wave, but the guideline is that the C wave can extend to 165% of the A wave.
The pattern to the downside can also be a set of zigzags. Less probably options are a triangle, or an ending diagonal.
The count on the upside is complete. Currency pairs are been oscillating up and down for weeks, as has oil. The US Dollar Index has retraced 62% of the previous wave to the upside and is ready for a turn up.
Everything is lined up (or almost lined up) for a turn. It’s now up to the market to follow through.
_____________________________
Elliott Wave Basics
Here is a page dedicated to a relatively basic description of the Elliott Wave Principle. You’ll also find a link to the book by Bob Prechter and A. J. Frost.
____________________________
Registration for Commenting
Want to comment? You need to be logged in to comment. You can register here.
If you register, it protects your information. It also allows you to comment without filling in your information each time. Once you’re registered, simply go to the home page and click on the login link top right in order to log yourself in. Usually, you’ll be logged in for several days before needing to be logged in again.
______________________________
Problem receiving blog comment emails? Try whitelisting the address. More info.
______________________________
Tops in your field DZ 2
Tops in your field …You are tops in your field. Tried to follow Elliot Wave international for years. They were always behind the market. After discovering you, I perceive that you are an expert in reading the waves, which puts you way ahead of the rest of your peers. And you can read the Waves like you are reading tomorrow’s financial section. I pray you stay healthy. —DZ |
A true expert in Elliott Wave FL 2
A true expert in Elliott Wave …You are a true expert in EW analysis. What you provide is not available anywhere and is priceless. Subscription on your services is the best thing I have ever done. Many thanks for your effort to make me a better investor. I now have more trust in my investment decisions. I hope you will continue the excellent work! —FL |
Have not had a losing week RW 2
Have not had a losing week …I have been with Peter almost a year. The only thing that matters is have I made money with his service. I think I have finally turned the corner using Peter’s EW. I have not had a losing week in the last 5 months. Thanks Peter, for your amazing amount of hard work. —RW |
the real deal SM 2
The real deal …‘Educational, insightful and thorough market analysis for all levels of traders. It’s Elliott Wave at its best….Peter Temple is the real deal’ —SM |
Get an upper hand … JC 2
Get an upper hand in trading …Seeing all the different currency pairs and the wave structures and hearing you explain why this has to do that on a nightly bases gives one a upper hand when trading. Elliott Wave applies to all stock and indices and can be applied to any candlestick chart. If someone ask what you want for Christmas – Tell them a membership to Peter’s “Traders Gold!”—JC |
The best of them JL 2
The best of them …Last couple of years, I subscribed to several ‘market traders’. You are by far the best of them and the personal contact is awesome. Daily and daily updates are very well written! Besides your expertise in EW, I also like your cycles analysis. Best investment I ever made! —JL |
Rise above the rest … SM 2
Rise above the rest …I have only ever met a few people who, in their chosen fields (astrology, medicine, music, martial arts, technical analysis), rise above all the rest and you are one of them…you have ‘the gift’…and that’s why I’m a Trader’s Gold member. —SM |
Couldn’t be happier … KK 2
Couldn’t be happier …The analysis and insight you provide is simply amazing! I’ve been trading the futures and equity markets for well over thirty years and usually average around 5% monthly. Since joining your Traders Gold Service two months ago, that number has better than doubled. I couldn’t be happier.—KK |
US Market Snapshot (based on end-of-week wave structure)
Here's the latest daily chart of ES (emini futures)
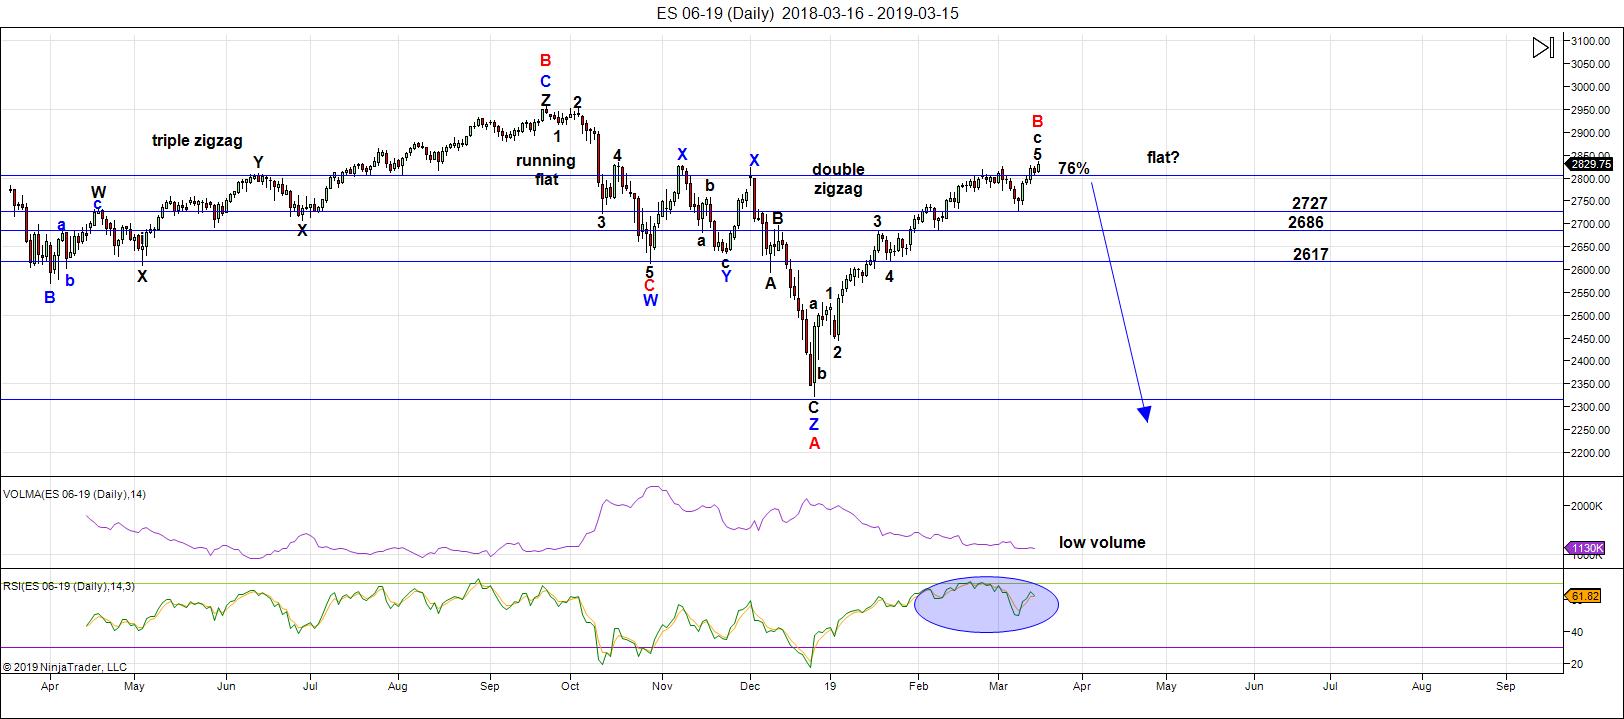
Above is the daily chart of ES (click to enlarge, as with any of my charts).
We're still sitting near the top of a B wave that's risen to about the 76% level of the height of the previous set of waves down from the all-time high at October 3, 2018. Almost all the other assets I cover on a daily basis are hovering at inflection points. The "greed factor" is elevated as we've all but finished a small 5th wave up to a new high at about 2836.
The next major move is to the downside.
After a fourth wave down last week, this week, we tracked a small fifth wave to a new high. I'm unsure of the short term direction (whether we have one more slight high to go) but other than that, this corrective pattern up is done.
As I've been saying, the wave up from Dec. 26 is clearly corrective and, as a result, must fully retrace. This is supported by the US Dollar Index, the major USD currency pairs, WTI Oil, along with DAX and other international exchanges.
Summary: My preference is for a dramatic drop in a C wave to a new low that should begin this week. The culmination of this drop should mark the bottom of large fourth wave in progress since January 29, 2018 - over a full year of Hell. It may be a dramatic drop that lasts multiple months, and will target the previous fourth wave area somewhere under 2100.
Once we've completed the fourth wave down, we'll have a long climb to a final new high in a fifth wave.
___________________________
Trader's Gold Subscribers get a comprehensive view of the market, including hourly (and even smaller timeframes, when appropriate) on a daily basis. They also receive updates through the comments area. I provide only the daily timeframe for the free blog, as a "snapshot" of where the market currently trades and the next move on a weekly basis.
______________________________________
Sign up for: The Chart Show
Next Date: Wednesday, March 27 at 5:00 pm EST (US market time)

The Chart Show is a one hour webinar in which Peter Temple provides the Elliott Wave analysis in real time for the US market, gold, silver, oil, major USD currency pairs, and more. You won't find a more accurate or comprehensive market prediction anywhere for this price.
Get caught up on the market from an Elliott Wave perspective. There’ll be a Q&A session during and at the end of the webinar and the possibility (depending on time) of taking requests.
For more information and to sign up, click here.
| "I think you are the only Elliot Wave technician on the planet who knows what he's doing.” |
| m.d. (professional trader) |
All registrants will receive the video playback of the webinar, so even if you miss it, you’ll be sent the full video replay within about an hour of its conclusion.


Spx..priming the pump! Gonna hit my 2850 target today..next up 2880! Giddy on up!
Rolling the die on speculative trade.
Selling Wed expiration SPY 283/284 bull put spread at the open..0
Goal is to get positioned ahead of possible turn tomorrow for close to zero cost basis. If we top.today this trade will return some serious coin with a timely exit from 284 short puts. If price keeps heading higher will keep credit and let.
spread expire, or roll up if price action warrants.
Opted for less risky SPY 283/283.50 bull put spread expiring tomorrow. Filled at 0.20 credit per spread. Will try to exit 283.50 puts before the close.
Another gap higher.
An Exhaustion gap?
If we fill it AND take out yesterday’s lows I outta short puts. Nice to have such a clear line in the sand…
im starting to see a few cracks developing but that’s it at this point.
im going to leave mkt alone today and do nothing .
I don’t mind being late to any tops .
im beginning to think late march is more important than now and I do respect what Peter G wrote .
Maybe Wednesdays full moon becomes the turn yet for me the late march time period is more important .
Dont look close to a top to me..2880 min..as high as 2950..b4 a pullback IMHO..
https://worldcyclesinstitute.com/direction-down/comment-page-1/#comment-37332
Sold spy calls. /es hit 2857.
Good job liz..imma still holding my 2845 calls from open..up about 75%
2850 hit..next up 2880! Giddy on up! Ride the bull folks..
Locked in 75% gain..on drop back below 2850..not too shabby..thx 4 playin along Mr Market
Look at VIX…!
Buying back SPY 283.5 short calls for 40% pop.
Holding 283 puts for now. Will widen spread and sell 284 puts if we move higher…
Hey..i will buy them calls from ya hardy har ha!
2880 not too far away..it has to at least hit that level if this is a flat.
I also begin..to wonder if this could still be the bigger..3rd wave with a bigger 4th..to follow?
I have it this is a (3) complete now in (4)…and (5) still to come
Guess..we shall see if spx gets to new ATH..
SIR PETER says it cant be 5th wave..so maybe its still the larger 3rd..
Ive never seen a 4th wave this bullish..doesnt make an iota of sense..
Unless some sorta flat..which means it needs to get to..at least 90% retrace level..which is above 2880 on spx..
I am on the minute chart charting dow ..so we are in a small wave (4) pull back right now in C down..so could also still be in a lager ((3))..you never know..but right now that is the count
meaning that if this is only a wave ((1)) and we are in a bull trend up which I don’t think we are..still think we are in (C) of B
It would be one helluva first wave!
I have seen a few counts calling it a primary first wave…
I agree. I am genuinely perplexed by all the bullish frenzy in the face of such obvious negative momentum divergences showing up in so many indicators…but what do I know? 🙂
They were puts, Sir Charles, lol!
Holding 283 puts expiring tomorrow for cost basis of 0.75, now trading at 0.99
So far so good. If they ramp price higher I am going to get whacked…unless of course I re-sell higher strike 284, or 285 puts. Right now that is NOT looking like a smart call, hehe!
also for the heck of it..I charted the Wilshire..that Peter had put up out of curiosity…
today it kissed the 2019 trend line and then pulled back to below the 2018..with a wick..
sooo let’s see if will mean anything..
Hi Marie, can you throw up a pic?
The banksters may be crooks but they are also wily. They cannot help but reveal their play-book and the smart money is ALWAYS ahead of the herd. If they remain leveraged long they are going to be hedging like there is no tomorrow, stealing the capital of the hapless longs while cleaning up long volatility during the rout.
Looking for a gap higher in vol as they get positioned.
What shall I do…what shall I do??!!
Board plebiscite!!! Oyez! Oyez!
Shall I take the money and run like a WUS or shall I hold on for some massive gains through expiration??? HELP!!! 🙂
SPY puts trading at 1.40, almost a double.
Selling half…
I know…I know.
I’m a WUS!!! 🙂 🙂 🙂
Nice VIX hammer at 12.37 low, not that his has meant much of late, lol!
WTF!!
Are they going negate yet another gap fill???!!
Figures!
These people!! 🙂 🙂 🙂
Well, well well…! What have we here??!!
Was taking my usual after market gander at the option chains going out a few months and what do you know?
The market makers are already on the move!
Option traders will know exactly whereof I speak…hehe!
Explain?
Bids on option put contracts…
Thx!
verne..I use stockcharts to chart..and can’t figure out how to send a pic..to show…
No problema. I loaded Peter G’s chart and saw what you talked about.
Verne
I’d say you were smart to take a bit of profits and I’d say
Your trade was perfect . Also I’ll add those cracks I saw developing in the early morning
Trading grew larger through out the day .
Today was probably a B wave high in the Dow .
I have been dialing in a few things over the past year on a new computer system and
Expanding on several ideas I have used for a long time .
Today’s market action in my opinion was a slight confirmation of a top at hand.
I think so Joe. With the kind of negative divergences we are seeing on this move higher, I think scalping the move higher is the only sane way to play it. Not wise to overstay one’s welcome methinks! 🙂
I was intending to take a short position today and I still might .
What just cooled me to that thought was opening my phone browser
And seeing the bearish bias . I read through a few article full of
Nonsensical reasons to be bearish and I went NO ! Don’t trade today .
When the masses think one way I question my own thoughts .
May 28 th is probably a better entry time wise I’m thinking so
Any trades between now will be day trades.
With VIX recently hitting a low at 12.37, I suspect people are not as bearish as they claim. I have learned over the years that when it comes to the markets, you really cannot place much stock, no pun intended, in what people say, but rather what they do. If they are so bearish, why aren’t they buying puts? I know I am….
It would appear that yet another iconic American company is on a suicide mission by refusing to take resposibility for flawed and dangerous products. Ford Explorers are making drivers of that SUV very sick due to exhaust fumes, particularly Carbon Monoxide seeping into the cabin. Signs of a 500 year cycle top.
It will likely get worse…much worse…
If U.S markets follow DAX, those remaining SPY puts expiring today are going to return some nice coin. If the ramp continues, I convert to a two point wide bull put credit spread and roll out to Friday.
Today should be most interesting!
Sold another 1/4 283 puts for 1.75.
Holding last 1/4 to see how we close.
If decline continues, will roll out to Friday 280 strikes.
Hmm..IWM daily…below 18MA, and 5 day ema is below 10..looks sooo posed for a drop looks like its just hanging on air..
only reason though I question it..on the two hour it seems to not want to break below the next support line…crazy how its holding on there…
Yep! They are playing us..big time!
Opened STC order on remaining 283 puts for limit price of 2.00, good for the day….
Down we go!!!! Hardy har har
If we don’t take out 2800, I will remain cautious. I already dislike that we failed to do it on the initial wave down….
Yup..in time to buy da dip! Cha cha ching!!! Bulls got this!
Like i said it HAS to get to at least 2880 for any of this to make any sense..
Its either a flat or the next leg of a bull cycle..
cant drop until it gets to 90% retrace..which is around 2880..if its a flat!
Imma still thinking this is either the 5th of the bigger 3rd..or if SIR PETER is right.. & its a B wave..gotta be a flat..which needs to go tp 2880 or higher.
EITHER way..imma bullish!
This would be true if you are going to completely ignore the fact that we have two other corrective patterns in place. You would have to explain away the running flat and double zigzag already in place. Because deciding the entire fourth wave is a flat would negate all the corrective patterns so far. I suppose if you thought flats could only exist at all-time highs, that would negate all other other instances of them at other levels within a wave structure. I don’t think that works.
It would also put into question what everything else is doing, like currencies, oil, other USD indices, etc.
As I’ve stated (and as the book explains), there are other options: zigzags, ending diagonal, triangle. So let’s not misconstrue Elliott Wave Theory, or I’ll need to put you on moderation.
Filled on remaining tranche @ 2.05. I am guessing we had an intra- day gap down…gonna take a look-see….😉
I don’t think this decline is the real deal.
Too many things about it not quite right, not the least of which is a complete failure to tag 2800 on the initial wave down. Glad I sold. Time to SOH until they show THEIR hand…
NOPE..i bought da dip right b4 fed speak..boom another double! up 120% right now.
2880+..here we come!!!
Sold another bull put credit spread expiring Friday 279/280…nicely in the green…!
I knew it!! 🙂
I do NOT plan on holding short puts overnight as I know these banksters are crooks.
You trust them at your own peril. Our advantage is that we KNOW to expect subterfuge from this cabal. I remain quite bearish, and by aim is to get as many cheap puts in my position as I possibly can while they are bamboozling the clueless herd.
BTW, every trader knows you simply do not chase the reaction to FEDSPEAK. The initial reacton is almost always a head-fake that will be swiftly reversed. If you got positioned ahead of it as Charles and I did that is one thing. Chasing a ramp higher is likely to get our face ripped off….just saying….
Although I must admit it’s usually fun to read the posts here, all of you should follow the example of the leader, Peter T, in his temperate frequency of posts and lack of changed market opinions. Good job, as usual, Peter! As to the market, my last post is working virtually perfectly as the top in the Wilshire 5000 should have been seen yesterday as it came up to meet the channel I showed on the posted chart. This BS Fed rally back today is the perfect set-up for this evening’s astronomical configuration of full moon and vernal equinox. If you would like to see a perfect market call (at least so far), look at my buddy Rick Ackerman’s post which he originally made in early February calling for an ultimate high of 2858.75 on ESM19. Remember, call was made in early Feb and yesterday’s exact high was 2858.75, above all three Oct, Nov, and Dec ES highs and thus leading to the perfect bull trap. It might have even caught our own Charles who should now start getting eaten up really badly by “buying the dips”. Listen for the howling of wolves around the time of the full moon this evening. Here is the Ackerman post…
https://www.rickackerman.com/wp-content/uploads/2019/03/If-you-like-bull-traps-ES.jpg
I bought back short puts on on doji print at 2840, and timing was very good!
Initial FEDSPEAK induced moves usually a head-fake…
Here is the text that accompanied Rick’s post:
If you’ve been waiting for Mr. Market to spring the Mother of All Bull Traps, check out today’s chart. What a beauty this picture will be if Monday’s sharp reversal turns out to be the start of The Big One. Granted, odds of getting the timing of so important a peak exactly right will always be against technical swamis. But the chart has enough going for it that permabears could be forgiven for thinking they might finally be right.
For starters, notice how the C-D leg of the bull cycle begun in December topped today at exactly 2858.75, a target sent out to subscribers in early February. The ensuing, 30-point plunge tells us that for some reason, sellers were spooked. If the intraday high turns out to be the bull’s last gasp, it picked an interesting place to occur — i.e., just above three important peaks labeled Curly, Larry and Moe in the chart. They were recorded, respectively, in October, November and December, and any rally that surpassed them, especially without correcting, was bound to get the attention of bulls who have been sitting on the fence. The three-peak breakout also would have spooked more than a few bears into covering short positions.
An Important Caveat
Add in the fact that the Fed on Wednesday is expected to mumble something dovish, and you have a perfect storm of bullish deceptions. If you’re a contrarian and a pessimist, the set-up looks irresistible. However, a very important caveat must be added: If the futures blow past the 2858.75 target in just a few days after having taken ten weeks to reach it, bears had better dive for cover, since that would be signaling more upside to at least 3,000 for the S&Ps and a further thousand-point rally in the Dow. If you don’t subscribe, click here for a free two-week trial that will give you access to everything. And please do stop by the Trading Room to say hello.
Hmm..so he goes either way..but leaning bearish? I was thinkin this was a flat that had to retrace 90%..but SIR PETER pointed out that doesnt have to occur..
Imma still usin da 200 sma as my stop..now @ 2754
& then 50 sma as my cue to go short..now @ 2724
since imma long from about 2620..thats still profit on my last 25% of my trend trades..still mostly day trading now anyhow which allows me to capture intra day moves like jagger!
Thanks Peter G.
Very cogent info.
Right in keeping with my own sentiments, although I have learned to never underestimate the banksters.
Holding 279 puts in anticipation….
Is Rick related to Bill?
Don’t know…he is currently in Denver area…
Thx for sharing Mr G..great warning!
Iwm and Dow..triangle ? possibly
Thank you Peter G..much appreciated
Peter G..us blabbing at times ..that is part of it..the amusement of writing what you think.to me is is fun….none of us are always right..not even the best of the best..but more nice to have the interaction…:) and good reads..
Yeah guys. Feel free to tell me to put a sock in it…! 🙂
Today will be a quiet day…promise!
I like ur comments Mr Verne..u r a helluva trader!
NO..triangle.
actually on minute chart iwm still possible triangle
Boom another double..gotta love these dips..the gift that keeps giving..
Imma still planning on 2880-2900 as min upside target for spx..
I find it interesting how you never post when there is a dip but you do after a buy the dip moment. Would have been great to see you ‘live’ post your buys today. I agree with Peter G that a monster decline is about to begin but first the buy the dippers need to be taught a lesson.
Ive posted my live trades..many a times..and given ya my process..
5 min charts..watch the indicators & jump in on rise above 10 and 20 sma. Today was a CLEAR..bullish setup!!!
U can lead a horse to the water BUT..
Hardy har ha!
my indicators..once again..
..bolinger bands
..rsi
..macd
..awesome oscillator
..10 sma must be above 20 sma to go long along with spx above 10&20
..20 sma must be below 10 sma to go short along with spx below 10&20
Looking like new ATHs for markets quite possible now..
Price action today a good reminder that you can never underestimate the ability of the banksters to negate bearish set-ups.
They also watch indicators and know all about seasonal and astronomical expectations and in my humble opinion it is not a co-incidence that we see these ramps at the particular time that they appear. Price re-entry into the gap area at 2825 and I re-sold 280 strike puts. The only reliable signal I have found for short term trading decisions is price action around leverage pivots and currently SPX 2800 is that level. Short trades taken above that level have to be nimble.
Some of these pretend traders..gettin on me nerves.. today was a clear bullish setup!
Don’t take it personally Charles. Most folk don’t trade as actively as we do so they simply don’t understand our approach to the market and that is allright.
Different approaches is what makes a forum like this interesting.
I am buying back short 280 puts for small 20% gain. I am still bearish and holding 279 strikes at zero cost basis so I am content to wait out this ramp.
If we take out today’s high will sell 281 strike puts for a two point wide bull credit spread…..
True..i think some r jealous cuz they be losing $.
If we take out Tuesday high imma gonna add some more trend trade calls..out til -Jun
A trade that worked well Mr Verne..yesterday I bought some puts around 230 after closing out my calls..after Fed spoke..
My signals had extreme overbought.. knew that rally would be faded..dont usually hold em overnight but did & put in limit order at open and was filled 20 pennies above my price which was high of day.. bullseye!
I bet you can’t prove you make any $
I make a lot more than ur welfare check Mr Q
Impulsive break of 2841.62 bearish. Move past 2851.32 bullish short term.
If the former, adding 279 strike puts now trading around 0.07, if the latter selling 281 strikes for 0.20 or better…
281 strike puts sold for 0.18….
New highs..new highs..2880 not too far away.
Since spx already hit my 2850 target..added long exposure @2852..target 2880..2896..2900..2940..2950
Small scale in..
Buying back 281 puts for 0.11…..
Selling 281/283 bull put spread for 0.25…
I think we are headed for 2875.
Here is hoping we get there by the close.
No way I am holding short puts overnight.
Not gonna do it! 🙂
Let’s give Sir Charles his due people.
He called the bull run, and I did not believe it.
Frankly I did not really care what Mr. Market did.
I just try to trade what I see…!
Thx Mr Verne..2880 next up IMHO..up to 2896 shorter term..then 2900..2940..2950 on higher end if extended wave.
Oh come on Verne. I can call the market as well as Charles if I tell you to buy the dip.
Hehe! I am sure you could Q.
Problem is that is STILL advice I would not take, haha!
Mr Verne..these fools need to learn how to trade..they like flies on poop..
Hardy har ha..as u short the market Mr Q..
jus cuz u dont understand trading & the markets doesnt mean u should b criticizing me..
Ur foolishness is ur own problem..be part of the solution..instead..or keep collecting ur welfare checks..ur choice!
Jus call me da market prophet!
Watching bids on 281 strike puts like a hawk eyeing a plump Salmon.
If bid, currently at 0.10 pops to 0.15 or higher, will exit 283 strike put for break even long position 281 strike puts….
Mr Verne Thinkin it makes it to ur 2775 & my 2880 target..like a magnet..them zeroing in on that area.
Peter G..decisive break above 2851 so ur man now thinking new ATHs too?
Joe L..hoping ur enjoying this bull party as much as me!
This website is for educational purposes relating to Elliott Wave, natural cycles, and the Quantum Revolution (Great Awakening). I welcome questions or comments about any of these subjects. Due to a heavy schedule, I may not have the time to answer questions that relate to my area of expertise.
I reserve the right to remove any comment that is deemed negative, is unhelpful, or off-topic. Such comments may be removed.
Want to comment? You need to be logged in to comment. You can register here.