
 Exactly, kitty! Let’s take a look under to hood … er, sofa in your case.
This weekend, I want to look at the chart of ES (e-mini SP500 futures) and “pull apart” the idea that it’s a motive wave. To do that, we need to look “under the fabric.”
The “Right Look”
Ralph Elliott cautioned that motive waves must have the “right look.” To a novice, it may take quite some time to be able to discern motive waves from corrective waves , even if I do a really good jog of explaining the difference. It takes time and a familiarity with the concept to be able to immediately see the difference. Motive waves must follow a strict set of rules and any deviation from this pre-designated pattern, makes the wave in question “corrective.”
Not all of us have the inherent ability to recognize patterns. I don’t know how much of this is a learned ability percentage-wise; however, you can certainly enhance your pattern recognition skills, as highlighted in Malcolm Gladwell’s book, Outliers. All it takes is 10,000 hours!
Anders Ericsson, highlighted in that book, studied violinists at the Berlin Academy of Music in the 1990s. He found that experts became experts based on the amount of work they did. “People at the very top of their game don’t just work much harder than everyone else. They work much, much harder.” You can learn to recognize patterns in the market, but it takes time. In other words, “cognitive repetition.” You need to work hard to get really, really good at it.
So think of this as a “starter exercise.”
Motive vs. Corrective
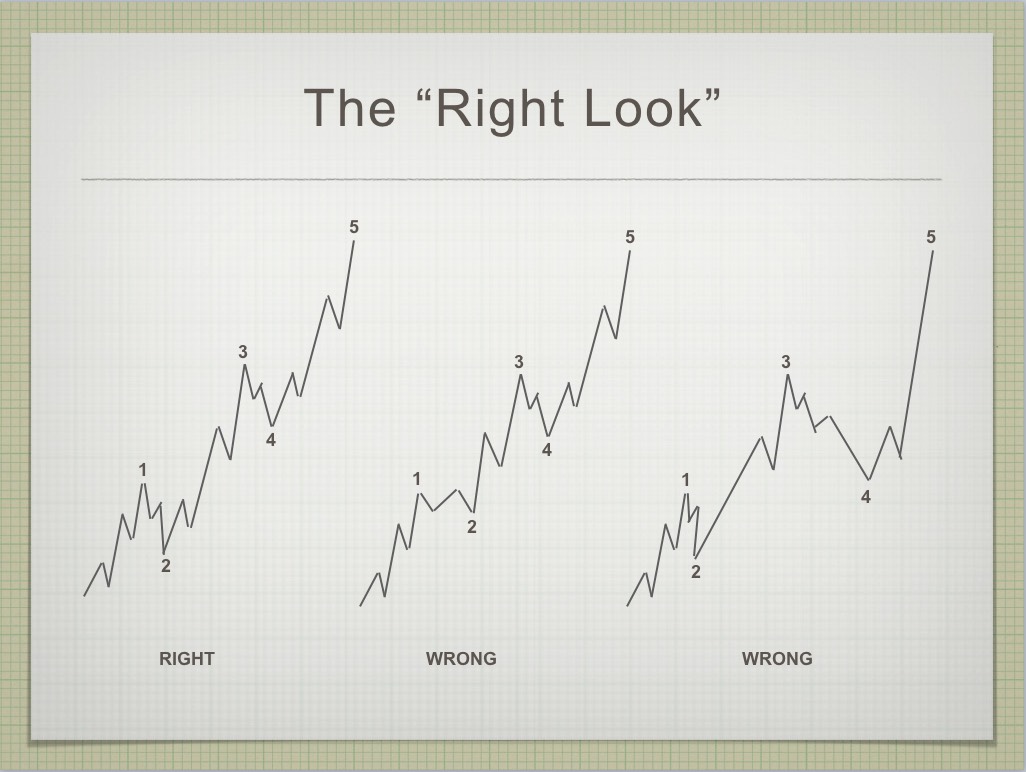
On the left is a series of three drawings (click to expand) of what might be construed as a bullish motive wave. The one of the left is the motive wave; the other two are “pretenders.” Motive (impulsive) waves are waves that are trend waves, defined by the number of waves and their relationship to each other. There are very strict rules that they must adhere to in order to be classified as motive. If they break any of these rules, they are “corrective.”
The most important motive wave rules (from Prechter’s book, The Elliott Wave Principle):
- An impulse always subdivides into five waves.
- Wave 1 always subdivides into an impulse (5 waves).
- Wave 3 always subdivides into an impulse (5 waves).
- Wave 5 always subdivides into an impulse or a diagonal triangle.
- Wave 3 is never the shortest wave.
- Wave 4 never moves into the area of wave 1.
Motive waves have to follow the above rules, or they are unquestionably corrective.
I find the above set of rules inadequate, in that they don’t address fibonacci ratios. In my experience, adhering to these ratios is often the deciding factor in whether a wave is motive or not (other than having the “right look”). I would add these very important rules:
- Subwave 2 almost always retraces at least 62% of wave 1,
- Subwave 4 almost always retraces at least 38% of the distance from the beginning of wave 1 to the end of wave 3.
- Subwave 3 is almost always either 1.618 or 2.618 (extended subwave) times the length of subwave 1.
- Subwave 5 is almost always 1.618 times the length of subwave 1.
If the subwaves do not meet these criteria, they are most likely corrective waves in my extensive experience (much more than 10,ooo hours).
They must also have the “right look.” Let’s break down the attributes of the three waves in the diagram above:
Leftmost. This is the motive (impulsive) wave. It adheres to all the rules and has the “right look.” You can see the subwaves in each of the odd-numbered waves. The even numbered waves each have three subwaves.
Center. There are two problems with this wave structure. The second wave does not retrace anywhere near the required amount (62%—see my additional rules above) and the third wave does not have 5 adequate subwaves, as a result.
Rightmost. Both the third wave and the fifth wave only have three waves each. As important, the fourth wave is not in the correct proportion to the second wave. It is much larger, in fact, even “overbearing” when contrasted with the second wave. If either the second or fourth wave out of proportion so that one is much bigger than the other, the larger wave structure is usually labelled as an ABC wave (corrective).
Breaking Apart the Chart
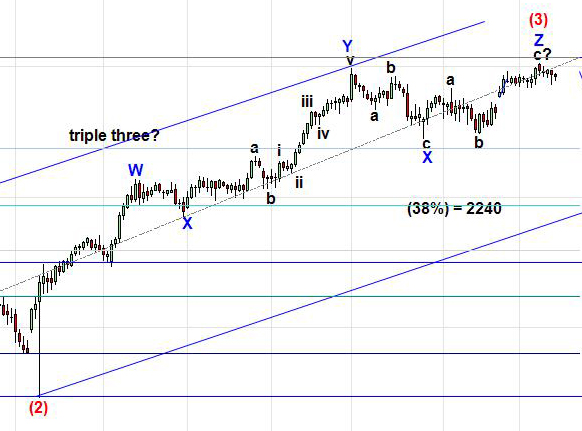
Let’s look at the third wave of the C wave from the daily chart of ES (below). You can see it on the left (click to expand).
You should be able to make out 3 subsections of the wave on the left. Wave W is actually a zigzag. So is wave Y and wave Z. There is no adequate subwave 2.
So, this wave breaks a very important requirement of a motive wave (no adequate second wave). It is therefore corrective.
Now, think of subwave W as 1, Y as 3, and Z as subwave 5 (of the larger wave 3). Subwave Y is about 180% of the length of subwave W. Subwave Z is about 40% of the length of subwave 1 (it should be 1.618 times the length of subwave 1). These subwaves don’t come close to what we’d expect the dimensions of these subwaves to be, if it was a motive wave.
Subwave 5 (Z) is very clearly in 3 waves. There’s another hard rule that this wave breaks.
Therefore, there’s no question that this entire wave is corrective. Once one wave of a structure is corrective, the entire structure is corrective.
This is an example of how you can look at a wave structure critically to determine whether it’s motive, or not. There are many more examples in the entire pattern from February 11, 2016 that point to this being a corrective wave. I’ve chosen one of the more obvious examples.
What this means is that we have a very fragile market before us that’s being pulled along by other forces. It suggests the fifth wave will not be as long as many might expect and that we may end up with an ending diagonal as the final pattern.
It also suggests that once we get to the top, the wave down will fast and steep.
Good trading.
Get an upper hand … JC 2
Get an upper hand in trading …Seeing all the different currency pairs and the wave structures and hearing you explain why this has to do that on a nightly bases gives one a upper hand when trading. Elliott Wave applies to all stock and indices and can be applied to any candlestick chart. If someone ask what you want for Christmas – Tell them a membership to Peter’s “Traders Gold!”—JC |
Tops in your field DZ 2
Tops in your field …You are tops in your field. Tried to follow Elliot Wave international for years. They were always behind the market. After discovering you, I perceive that you are an expert in reading the waves, which puts you way ahead of the rest of your peers. And you can read the Waves like you are reading tomorrow’s financial section. I pray you stay healthy. —DZ |
Have not had a losing week RW 2
Have not had a losing week …I have been with Peter almost a year. The only thing that matters is have I made money with his service. I think I have finally turned the corner using Peter’s EW. I have not had a losing week in the last 5 months. Thanks Peter, for your amazing amount of hard work. —RW |
A true expert in Elliott Wave FL 2
A true expert in Elliott Wave …You are a true expert in EW analysis. What you provide is not available anywhere and is priceless. Subscription on your services is the best thing I have ever done. Many thanks for your effort to make me a better investor. I now have more trust in my investment decisions. I hope you will continue the excellent work! —FL |
Rise above the rest … SM 2
Rise above the rest …I have only ever met a few people who, in their chosen fields (astrology, medicine, music, martial arts, technical analysis), rise above all the rest and you are one of them…you have ‘the gift’…and that’s why I’m a Trader’s Gold member. —SM |
Couldn’t be happier … KK 2
Couldn’t be happier …The analysis and insight you provide is simply amazing! I’ve been trading the futures and equity markets for well over thirty years and usually average around 5% monthly. Since joining your Traders Gold Service two months ago, that number has better than doubled. I couldn’t be happier.—KK |
the real deal SM 2
The real deal …‘Educational, insightful and thorough market analysis for all levels of traders. It’s Elliott Wave at its best….Peter Temple is the real deal’ —SM |
The best of them JL 2
The best of them …Last couple of years, I subscribed to several ‘market traders’. You are by far the best of them and the personal contact is awesome. Daily and daily updates are very well written! Besides your expertise in EW, I also like your cycles analysis. Best investment I ever made! —JL |
The Market This Week
The charts this week have added even more clarity to the path ahead. The time I spent last weekend (a full day) analyzing the market has paid off. We've continued to follow my projections all across the board (US indices, USD currency pairs, the US dollar, oil, silver, gold, and bonds).
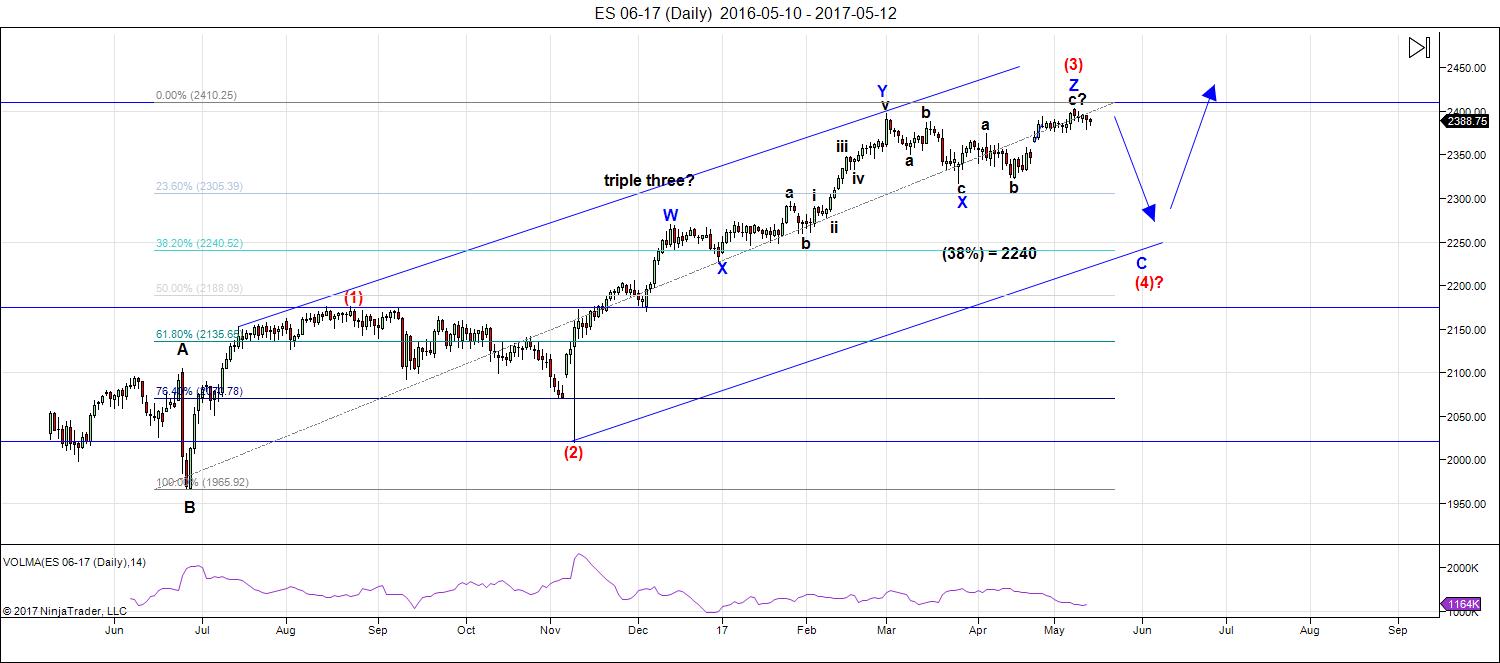
Above is the daily chart of ES (click to enlarge, as with any of my charts). We sit very near the top of the third wave of a large C wave. As per the information I shared above, this wave up is clearly corrective, although you'll find charts all over the internet calling the entire structure motive. This is the kind of misuse of Elliott wave that drives me crazy (and why I stay away from reading other people's charts).
This is important because it gives a different count than a motive wave would produce and it suggests a different length to the final fifth wave. It will likely be shorter than a motive wave and has a much greater probability of being an ending diagonal.
We have a dramatic turn coming later this week, as it will play out across US indices, most USD currency pairs, and perhaps oil and the major metals. As I've saying for the past year and a half, all markets are becoming more and more closely aligned. Now we have situations where they're all making turns at the same time.
For my Trader's Gold group, I've laid out the remaining long and short term path for all the assets I cover. I still project a top for everything in the September/October timeframe, because recent history has provided many of the clues in each of the asset classed. They're all telling me the same thing.
Last weekend, my hours spent on charts paid off. As projected, virtually everything headed for a new high. Although we haven't gone very far in the past week, the charts have become much clearer. Haha ... by that I mean clearer to an Elliott wave analyst; they're actually way more cluttered on an hourly timeframe to the newbie, but that's because we're experiencing the added volatility of many markets making a turn at the same time.
Summary: We're in the final pattern of a third wave in ES.
The top end projection for this final zigzag of the third wave is 2410-2415 in ES.
After completing the larger fourth wave, we'll have one more wave to go, which could be an ending diagonal as a fifth wave. The long awaited bear market is getting closer.
______________________________________
Sign up for: The Chart Show
Wednesday, May 17 at 1:00 pm EST (US market time)

The Chart Show is a one hour webinar in which Peter Temple provides the Elliott Wave analysis in real time for the US market, gold, silver, oil, major USD currency pairs, and more. You won't find a more accurate or comprehensive market prediction anywhere for this price.
Get caught up on the market from an Elliott Wave perspective. You’ll also get Andy Pancholi cycle turn dates for the balance of the current month. There’ll be a Q&A session during and at the end of the webinar and the possibility (depending on time) of taking requests.
All registrants will receive the video playback of the webinar, so even if you miss it, you’ll be sent the full video replay within about an hour of its conclusion. For more information and to sign up, click here. NOTE: the weekday and time have changed - to Wednesdays.


For every WashPo, Politico article, there are articles like these: http://stevepieczenik.com/the-grand-inquisitor-fbi-director/ , http://stevepieczenik.com/comey-continues-in-a-long-line-of-corruption/.
I prefer to wait for Peter’s dissection on whether we are still seeking a wave 3 high or if wave 4 has started.
Andre,
Thank you for the dates. Like 5/17, I have circled 5/24, 6/9 and 6/24 on my calendar. Joe’s cycle low is 5/18 to 5/25 then strong move up into June 30. Some stocks found buyers 5/17 so that date was swing low for them. I stepped in a few seconds after May 18 open but I had to up my bids a few times because buyers were stepping it up. All those long trades now closed.
Not sure what my plan is on Monday yet but I noticed CRM printed a bearish engulfing candle on both the daily and weekly candles. I noticed a weekly outside day occurred also the week of May 20, 2013.
Out of curiosity I looked at the SPY chart for the same time period. May 22 was a high (hello Andre!), May 23rd a swing low for a positive Friday before Memorial Day, up on Tues after Mem day then down again into 6/6.
Some stocks hit 52-wk highs last Friday. So far only CRM clearly rejected those highs. Others still in uptrend.
“Let me be up front, as I usually am, and admit to you that I have never met him”
Well, good riddance to me because I’m out of here since Peter’s EW forum has turned into a puff piece for certain political leanings. NOT interested in that at all. Au revoir. Sayonara.
Yes I know. All WashPo, Politico, CNN reporters are also the best, credible sources. The point is I come here to learn EW, cycles, planetary, new moon, full moon, apogee/perigree influence from Peter and contributors. I have no interest at all whether one is pro or anti-Comey, Mueller, and continued promotion of one’s stance. If you trade, your time is better spent looking at charts rather than arguing your political agenda. If you use twitter or facebook your timeline is already cluttered with this bickering. Why bring it here?
Four feet of snow in Wyoming and summer is one month away. Cooling cycle.
They say “snow in hell” is an ominous sign valley… (lol j joking, nothing against Wyoming 😀
A new weekend post is live at: https://worldcyclesinstitute.com/events-dont-change-the-trend/
This website is for educational purposes relating to Elliott Wave, natural cycles, and the Quantum Revolution (Great Awakening). I welcome questions or comments about any of these subjects. Due to a heavy schedule, I may not have the time to answer questions that relate to my area of expertise.
I reserve the right to remove any comment that is deemed negative, is unhelpful, or off-topic. Such comments may be removed.
Want to comment? You need to be logged in to comment. You can register here.