
Contracting Triangles
 My focus this weekend is on contracting triangles, one of three types of Elliott wave corrective patterns (flats, zigzags, and triangles). This is timely because of the pattern in oil. We’ve been in a contracting triangle since early 2015.
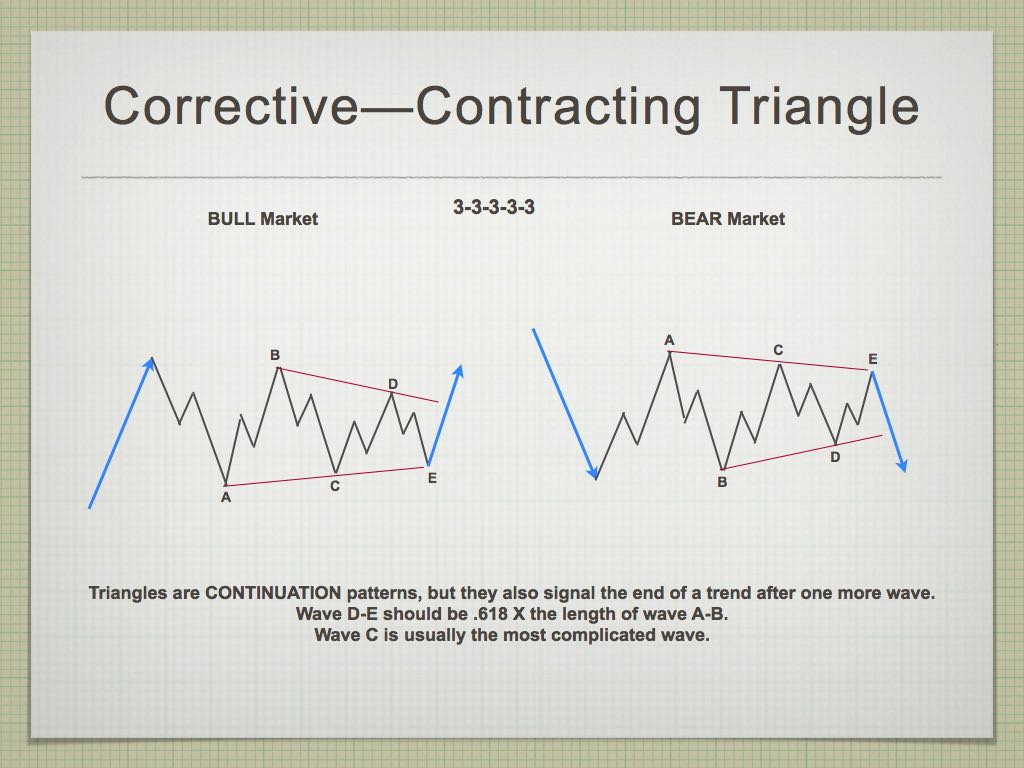
Contracting triangles are the most common type of triangle. When they’re in the fourth wave position, they predict an end to the entire trend with one more wave (fifth wave).
Rules (these are “hard” rules; they cannot be broken):
- A triangle always subdivides into five waves.
- At least four waves among waves A, B, C, D, and E each subdivide into a zigzag or zigzag combination.
- Wave C never moves beyond the end of wave B, wave D never moves beyond the end of wave C, and wave E never moves beyond the end of wave D (The result is that going forward in time, a line connecting the ends of waves B and D converges with a line connecting the ends of waves A and C).
- A triangle never has more than one complex subwave, in which case it is always a zigzag combination.
Guidelines (guidelines can be broken but it’s rare that they are):
- Usually, wave C subdivides into a zigzag combination that is longer lasting and contains deeper percentage retracements than each of the other snbwaves.
- Sometimes, wave D subdivides into a zigzag combination that is longer lasting and contains deeper percentage retracements than each of the other subwaves. (C and D won’t both be complex waves).
- Sometimes one of the waves. usually wave C, D, or E, subdivides into a contracting triangle. Often the effect is as if the entire triangle consisted of nine zigzags.
- About 60 percent of the time, wave B does not end beyond the start of wave A. When it does, the triangle is called a running triangle.
- Barrier Triangles: Sometimes. either waves A and C, or B and D, will end at almost exactly the same level. When the flat line is on the top, it is called an ascending triangle; when it is on the bottom, it is called a descending triangle.
- When wave 5 follows a triangle, it is typically either a brief, rapid movement, or an exceptionally long extension.
Case in Point: Oil
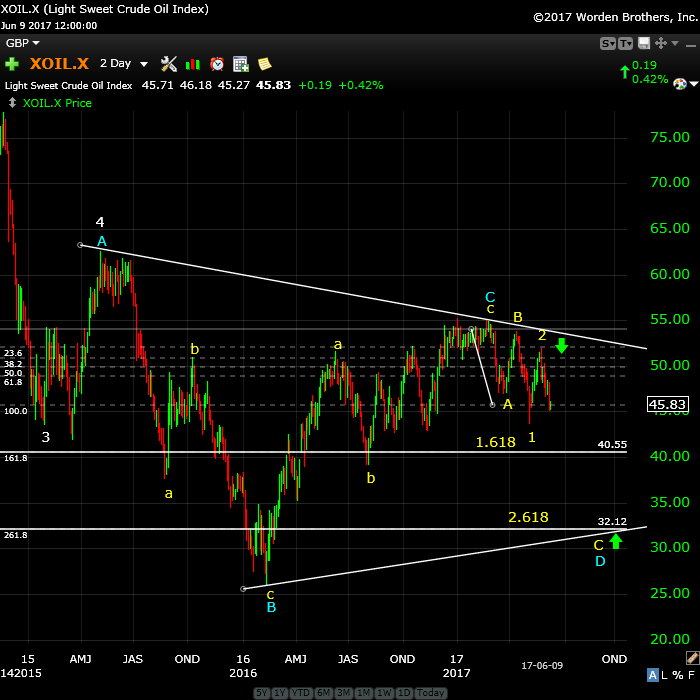
Above is a two day chart of West Texas Intermediate Oil. I called this pattern as a triangle way back in early 2016. It continues to play out as such and has a long way to go. We’re currently in a wave headed down to the $32 area. Once that target is met, we’ll see one final wave up to slightly above $50 before we slide down below $25.
From a fundamentals perspective, there is no demand for oil and at the same time, the international market is flooded with oil. There are lots of “fun and games” going on to prop it up, but we’re far enough into this depression that there won’t be a resolution to the upside for a very long time.
In the shorter term, we’ve completed a yellow A wave down, a B wave up, and are now headed down to the target of about $32, which is also a C wave fibonacci length of 2.618 X the yellow A wave.
In contracting triangles, the length of the D wave (from C to D) should be a fibonacci .618 X the length of the A-B wave length. That length also targets to the $32.00 area.
EW analysis allowed me to call the top of the blue C wave, and targets for blue waves C and E.
It became apparent in late 2015 that we were forming a triangle. That’s because the wave down from early 2015 was obviously in three waves. Once we reached the bottom of blue B and then risen above the previous wave yellow b low, it was obvious the previous wave was a three and was going to remain so.
The only patterns that start with a wave containing only 3 subwaves in a fourth wave position are triangles and flats. However, the first wave of a flat would not be as extreme as that of a triangle, so it’s easily discounted in this case.
The best of them JL 2
The best of them …Last couple of years, I subscribed to several ‘market traders’. You are by far the best of them and the personal contact is awesome. Daily and daily updates are very well written! Besides your expertise in EW, I also like your cycles analysis. Best investment I ever made! —JL |
Couldn’t be happier … KK 2
Couldn’t be happier …The analysis and insight you provide is simply amazing! I’ve been trading the futures and equity markets for well over thirty years and usually average around 5% monthly. Since joining your Traders Gold Service two months ago, that number has better than doubled. I couldn’t be happier.—KK |
A true expert in Elliott Wave FL 2
A true expert in Elliott Wave …You are a true expert in EW analysis. What you provide is not available anywhere and is priceless. Subscription on your services is the best thing I have ever done. Many thanks for your effort to make me a better investor. I now have more trust in my investment decisions. I hope you will continue the excellent work! —FL |
the real deal SM 2
The real deal …‘Educational, insightful and thorough market analysis for all levels of traders. It’s Elliott Wave at its best….Peter Temple is the real deal’ —SM |
Rise above the rest … SM 2
Rise above the rest …I have only ever met a few people who, in their chosen fields (astrology, medicine, music, martial arts, technical analysis), rise above all the rest and you are one of them…you have ‘the gift’…and that’s why I’m a Trader’s Gold member. —SM |
Tops in your field DZ 2
Tops in your field …You are tops in your field. Tried to follow Elliot Wave international for years. They were always behind the market. After discovering you, I perceive that you are an expert in reading the waves, which puts you way ahead of the rest of your peers. And you can read the Waves like you are reading tomorrow’s financial section. I pray you stay healthy. —DZ |
Have not had a losing week RW 2
Have not had a losing week …I have been with Peter almost a year. The only thing that matters is have I made money with his service. I think I have finally turned the corner using Peter’s EW. I have not had a losing week in the last 5 months. Thanks Peter, for your amazing amount of hard work. —RW |
Get an upper hand … JC 2
Get an upper hand in trading …Seeing all the different currency pairs and the wave structures and hearing you explain why this has to do that on a nightly bases gives one a upper hand when trading. Elliott Wave applies to all stock and indices and can be applied to any candlestick chart. If someone ask what you want for Christmas – Tell them a membership to Peter’s “Traders Gold!”—JC |
The Market This Week
Here's the latest daily chart of ES (emini futures)
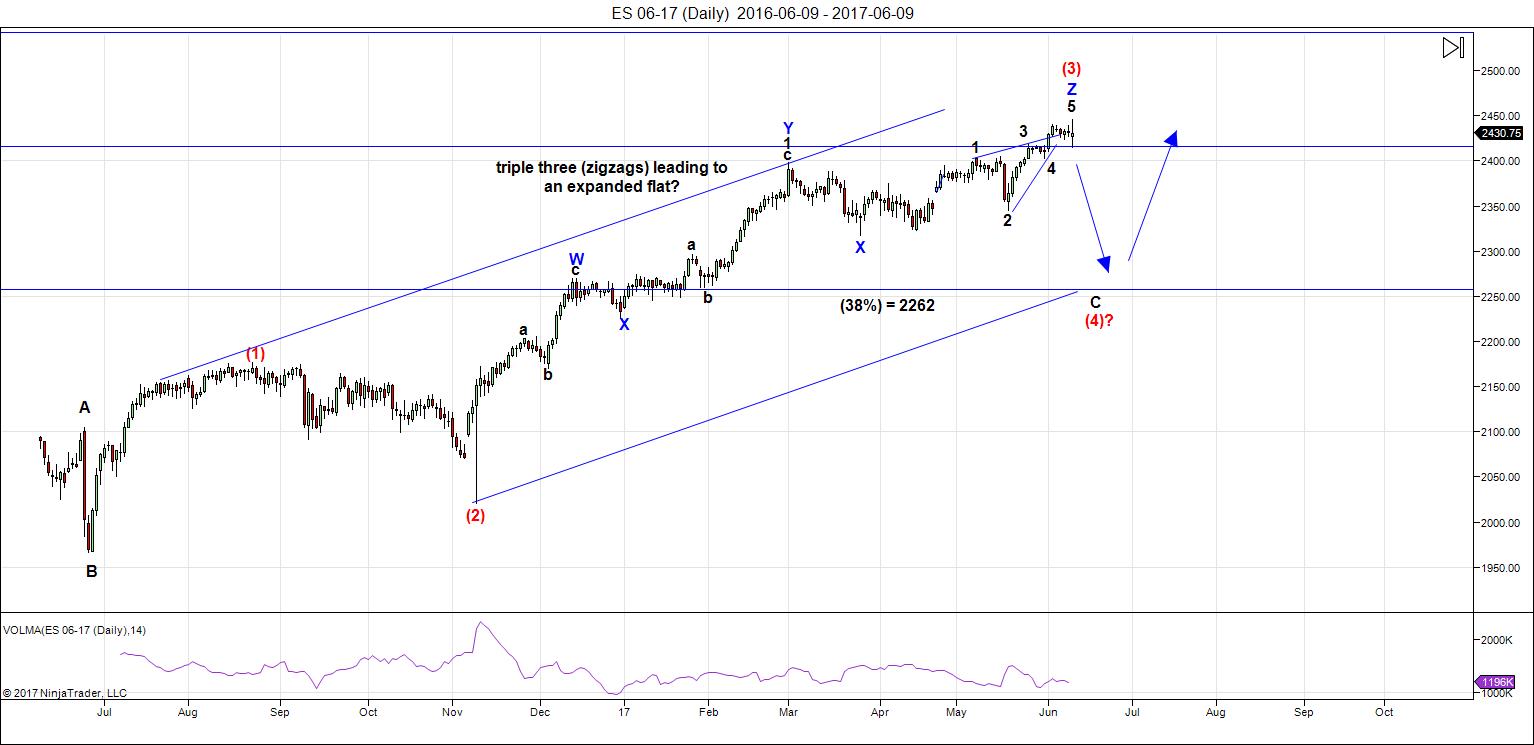
Above is the daily chart of ES (click to enlarge, as with any of my charts). The count has not changed appreciably. What appears to be a third zigzag of the third wave (you can only have three patterns within a corrective wave—this third pattern starts at blue X on the chart) continued slightly higher as predicted last week and continued to build a potential very large expanded flat at the top of the circle red third wave. The very top of this last wave formed what looks like an ending diagonal, and we dropped in dramatic fashion on Friday.
Five waves down to a previous fourth of one lesser degree confirms a change in trend. We don't quite have that yet. The Nasdaq, which should lead the market is further along in the trend change process, but also does not have five waves down confirmed.
Summary: We've completed the third wave in ES at the top of a possible expanded flat (and and ending diagonal). We could have one more test of the top on the NYSE side of the market. I believe the Nasdaq side of the US market has likely seen the top; however, we still need technical confirmation.
After completing the larger fourth wave, we'll have one more wave to go, which could be an ending diagonal as a fifth wave. The long awaited bear market is getting closer.
______________________________________
Sign up for: The Chart Show
Wednesday, June 21 at 1:00 pm EST (US market time)

The Chart Show is a one hour webinar in which Peter Temple provides the Elliott Wave analysis in real time for the US market, gold, silver, oil, major USD currency pairs, and more. You won't find a more accurate or comprehensive market prediction anywhere for this price.
Get caught up on the market from an Elliott Wave perspective. You’ll also get Andy Pancholi cycle turn dates for the balance of the current month. There’ll be a Q&A session during and at the end of the webinar and the possibility (depending on time) of taking requests.
All registrants will receive the video playback of the webinar, so even if you miss it, you’ll be sent the full video replay within about an hour of its conclusion. For more information and to sign up, click here. NOTE: the weekday and time have changed - to Wednesdays.


The turn the indices made off the top on Friday, especially the NDX, was certainly dramatic. It was the kind of turn one would expect at the end of a contracting ED and nice to see. That red candle in NDX with massive volume was stunning!
Even more stunning was the way DJI was bought off the decline to end up 89 points! It does make one wonder if bullishness in the markets is now so firmly entrenched that no one is paying the slightest heed to the warning shot across the bow from NDX and remain determined to stay in BTFD mode. I expect some adjustments will be made to trading algos this weekend; clearly a storm is brewing….
Verne,
Hopefully, you will see the questions I posed for you and Peter G. I must have been posting my questions at the exact instance that Peter T was posting the new update!
I replied on the prior page, Ed, but no harm in repeating here. I wrote “Picture = 1,000 words with this link… http://docdro.id/YhLC8Vo
By the way, that picture, courtesy of Jason Goepfert and sentimenttrader does not include a second blue circle as of two weeks ago…
Peter G,
Thank you again!
Thanks, Peter. Good post!
PALS has following next week: post apogee (bullish 10 days), post full moon (bullish 10 days), post south declination (neutral), seasonals after Monday (bullish four days).
Verne,
Thank you for commenting on my post…actually posted at the very end of last week’s commentary/posts.
My question is…Does the fact that we have had a “Confirmed HO” on both the NY and the NASDAQ actually lead to a reasonable expectation that a market decline come much sooner than the 4 month window? I do not have any prior experience with the simultaneous HO signals!
I was hopeful that either you or Peter G could shed some light on that. In the previous simultaneous signals…How many months or weeks did the market need to play out the anticipated resolution?
The HO, strictly speaking, derives its signal specifically from the NYSE. While it would be my guess that those defining criteria appearing in other indices would be confirmatory of general market weakness, I don’t know if anyone has looked at whether this influeces the time lapse between the signal’s confirmation, and the a actual start of the market’s decline. The key point is that an official HO ocurrs ONLY when the conditions are met by NYSE, so technically speaking, a “double HO”, so far as I am aware is not an “official” term.
What is a HO?
In technical analysis.
Hindenburg Omen.
Thanks, Verne!
Hi Peter
I’m going to write before I read
Off of point sur and terrible reception
My model is showing a turn mid June to mid July ( I’m not finished )
The low possibly being year end . Mars Uranus cycle does not change
And has its turn June 30 , end of quarter plus 20 days is July 20
One month before solar eclipse is July 20 , many ifs at this point with no data
To back it up . A high now or in the next month ( June 30 ) and a low near year end
Would target an important high mid June 2018 which fits the bearish side of the mars Uranus
Cycle . NVDA had a fairly large swing on Friday . The state of Illinois can be Google searched
For what’s coming .. I’m not going to propose a wave count just saying I’m seeing bearish
Cycles in my model which dove tale with my other cyclical work .while I’m sticking to my June
30 cycle date for several reasons I think we should all now change our mindset .
Depending on the actual decline in both price and length of time I can’t state where
This market goes until after the fact .
I see your triangle graph and will read the details after I hit send .
Bottom line my models are begining to scare me about a possible deeper decline which
Lasts longer then I would normally expect .
An October to Jan low implies a swing high in June 2018 . Whether that us a wave 4 into
Oct and 5 into June 2018 or just a swing low and swing high labeled something else
I don’t know .
I now have 3 timing methods calling for a June 30-July 20 high and all of them I have used
And relied on for many years .
I always pay attention to the 30 day period before a solar eclipse , it’s not textbook puetz in this case
But the typical is a new moon high into a solar eclipse low , July 21 to Aug 21 as a rough call
Yet June 30 is a cycle high of importance in my work .
Not sure when the next mercury retrograde is but I watch it for a 10 day lag .
Somewhere it fits into all of this .
I’m becoming BEARISH yet waiting till month end
Joe
Peter did you not include your ES chart this week for a reason. As a novice learner, seeing is believing.
Thanks
Jeff
Thank you. Got when I refreshed the page.
One of the newsletters I subscribe to observed that really deep pockets stepped in to buy the NDX decline on Friday. While he has some proprietary signals he uses to detect market intervention by way of buying power, the casual observer would conclude the same thing just by virtue of the long lower wick. This is a topic of intense interest for me personally, and that is the degree to which Central Bank intervention affects developing wave action. The Nasdaq has been trading at ridiculous extremes (the most since 2000) from a number of moving averages and I have watched in amazement as this has continued for months now. Is it the opinion of Central Banksters that they can indefinitely avert a mean reversion in markets, or is the kind of remarkable BTFD we saw on Friday due to mostly autobot trading? Banksters are not stupid, so the notion that they would step in to throw cash at a decline like the one we saw on Friday I find a bit far-fetched. If not them, then who?! At the chart show last Wednesday Peter pointed out that NDX was probably close to a top and when it came down, it would come down “like a bullet”.
A prescient observation. As one can imagine, I completely agreed with that analysis and so you can imagine what my puts did on Friday! Some folk are actually interpreting the failure of the other indices to mimic the Nasdaq’s plunge as very bullish and someone pointed out that DJI actually closed at all time highs, and I think the Russel did as well. So it seems, whoever the deep pockets are buying the declines, we are gong to have a real dog-fight next week. EW vs the perma-bulls! Personally I am strapped in for an at least 0.38 fourth wave fib decline in all the indices. Here’s hoping I am not stopped out.
Verne,
a small anecdote from URSS:
The family of an alcoholic looking the Tv get to know that the price of vodka will be settled 40% higher from now. So the kids are happy to ask the father: “Daddy, so you will drink 40% less now ?”. The father answers: “No kids, you will eat 40% less now”.
I mean, with 300 bn per month injected by the BCs these guys should have the real heart attack before they stop buying.
I was an intriguing chart of CB buying during the 2008 meltdown. If those numbers were correct, they kept buying all the way down.
The Chinese also bought relentlessly when their markets blew up, and it still traced out an impulsive wave down. They even started to threaten short-sellers with jail time. The upped the ante and ultimately demanded that hedge funds and big companies also buy the market.
I am betting that we are 4% higher by mid July. Haven’t put money in yet but will buy early next week. Banks make more profit as rates rise and they will lead the market for a while, post Dodd Frank repeal.
I currently have XLF in a wave 4. So I think you may be right.
XLF is printing a doji above its Bollinger Bands. Looks like a reversal candle to me. June 23, 24.50 puts look like an easy double. Currently bid at 0.38
I am picking up a few and expect to hold for less than a week.
Put money into early July call option. Betting on mid summer rally in context of positive PALS, year of Rooster, and business friendly regulatory environment.
Early summer.
So far so good. Will probably sell next Monday. Next week Tuesday to Friday are seasonally lacking in buyers.
Lots of talking heads jaw-boning about how the fang stocks are now a great buying opportunity. What I find fascinating is that the stocks that really broke are the ones responsible for most of the index gains the last few months. What is happening in tech is right in keeping with the neon flashing lights of the recent confirmed HO. I think it is entirely possible that the NDX may be tracing out a second wave up while the other indices are making their tops.
Snowing in California mountains with summer approaching. IceAgeNow.info. Cooling cycle.
A quick question for Peter T about wave nomenclature.
I know impulsive waves are assigned numbers, and corrective ones letters.
Does the five down we are expecting for wave four in what you labeled a C wave represent part of an ABC correction for wave four, or is it part of a larger wave structure that includes a fourth wave correction?
Peter
There is something missing in your wave count .
From the last x wave to wave 1 I count 29 bars followed by 8 bars down to wave 2 .
Wave 3 spears to short and does not appear to be a 3 wave structure .
I understand your wave count as labeled yet to me from the March 27 low
This looks like a seperate subdivision of its own .
Therefore I’d prefer to consider a rally for most of if not all next week a rally yet a weak one
To complete minor wave 3 then a drop back towards the top of your wave 1 of early May
Then a last move higher in 3 waves up again and weaker still .
From your wave 2 in black to Friday was a 3 wave move yet something tells me that
Wasn’t a complete move . I am only looking at your chart so I can’t back this up
But something appears to be missing ,
My bias being timing , I don’t see a low to low to high count nor
A low to high to high count
Maybe I’m wrong yet no doubt we will know next week .
Thank you for the post and the effort put in to your updates
Joe
Also from looking at your arrows I agree
The 2400 level looks like a pivotable level
Thank you
Joe
Looks like indices traced out some kind of triangle today after the Friday impulse down. It has to be part of some kind of combination since a triangle cannot be the sole structure of a second wave. I suspect we will see an initial head-fake move to the upside out of the triangle, but as a continuation pattern, I think we have some more downside yet. It is actually now looking as if it is not going to be as deep a correction as I originally had thought. When they start messing around like this with all this over-lapping movement that is good sign the deep pockets are doing their utmost to keep the ship aright. I suspect the 2420 area of the 20 day ema may continue to provide support. So far not behaving like a C down, which should act more like a third wave imho.
https://www.youtube.com/watch?v=oOf8h3LDUec
Todays retrace makes me think we will again have to recalibrate the 3rd wave and probably 4th didn’t start… well we will find this week, its constant adjustment to get it right.
5 more SP 500 point before the 4th wave call is invalidated… I am positioned for 4th wave..lets see how long I can hold on.
That’s give one hour for the high and then starting to move down like Friday.
That’s break the Friday low before 12pm today!
Peter G,
Back to the Hindenburg Omen…You seem to be well versed on the HO. As I said in response to your post…I had never heard of the HO being applied to the NASDAQ. If I wanted to keep up with that…Do I just access NASDAQ new highs new lows via the WSJ?
Then go thru the Robert McHugh checklist? Would you know if Jason Goepfert would have applied this simultaneous signal to the 1965 to 1981 sideways “chop” in the NASDAQ and NYSE?
Ed, the rules for the NASDAQ would be the same as those for the NYSE. The HO is an offshoot of Norm Fosback’s High-Low Logic Index. There is a good explanation of HO on Wikipedia, but be aware that the rules have changed and been refined over the years. Some might argue there has been an after-the-fact optimization going on as new interpretations or variations are based on back testing with different parameters. In the law we have an expression “res ipsa loquitur” or “the thing speaks for itself” and that would be my headline for the chart I showed you from Jason Goepfert that showed all occurrences of “double HOs.” As you can see from the 1995 occurrence, it has not been perfect, but it sure has been impressive…As to your second question, I have not seen anyone’s research on the period before 1986 when Goepfert’s chart begins, but there is no reason to believe the results would be different.
Peter G,
Thank you for responding! Very much appreciated once again!
Wave 3 is coming to an end yet I’m still waiting
Until the end of June before taking a bearish stance .
There is a few concerns short term I’m having though
From the March 27 low are we witnessing am ending diagonal
Of its own ? If so where are we in that count ? Top of minor 3
Or top of 5 of 3 ? At this juncture I don’t see an overlap of wave
1 so I’m thinking were topping in minor 3 which implies
A new high in the es, spx. It also implies a drop back to 2400
Is needed in minor 4 then a new high to follow afterwords
I don’t have the data I normally do because I’m working yet
Ending diagonals should be overlaps shouldn’t they ?
Lastly , the nya has an upside objective of 13000 which ideally
Should be hit before the bigger bear market decline unfolds .
The cycle high June 30 I’ll have to consider as the top of wave 3
And I’ll go with the monthly chart and the fibs and basic
Price targets from that .
Today’s New highs in the Dow to me show a few concerns
Going forward . I’m begining to wonder if all we really saw
On Fridays drop was a futures contract roll over from June
To Sept . That said if the nasdaq begins to lag while the spx
And Dow move higher I’ll question the liquidity of this market .
Whether we have reached the point where there isn’t enough
Money or borrowing power left to keep both the nasdaq and the Spx/Dow
Continuing higher I do not know yet I’m begining to question it.
If there is not then we should see a juggling act take place amongst
The indexes .
Bottom line : when I get home I’ll start plotting the margin debt
As well as start looking at front month index futures vs the back
Months . Sept vs Dec or Sept vs March ,Dec vs June etc .
Those spreads will change as traders become more risk averse
And the back months will stagnate vs the front months .
Last time I saw that was late 2014 and we ended up with
About a 2 year sideways market .
Global warming in long beach California today 🙂
Hot as hell down here,
Nap time for me , it’s been a long day and it’s only 3 in the afternoon.
Market rallies into Fed meetings are more typical than not .
I wouldn’t be to concerned about the Fed .
A typical move is a 100 point swing in the opposite direction
That lasts about 3 minutes and then the trend reverses for the
Rest if the day .it’s a fairly easy trade . Place order to see 100
Points above or to buy 100 points below the market 3 minutes
Before the announcement and keep your eyes on the chart
Not the tv. It’s a whipsaw and the trade may only last
10 minutes if your nimble and just want to get in and out .
I’m taking about the Dow not spx and at some point that
100 point move should be more given that 100 points is
Not much of a percent move as it used to be .
You can look up prior Fed days and see .
Good luck everyone
Joe
For those who are interested the free week forecast from Mahendra:
https://www.mahendraprophecy.com/userfiles/files/5_-_9_june_2017,_weekly_financial_letter……pdf
The link doesn’t work.
So select including “…….pdf” and then copy and paste in your browser
I am surprised he still has subscibers. 🙂
Then again, maybe that is the reason for the promotion. Caveat Emptor!
But seriously, we should not be recommending him imho.
Well Mahendara, is saying after early July, he is laying into oct puts
Any one know why Andre has not posted?? Did i miss something ? Please let know something ….Nick
On 6/2 André posted called 6/5 high, 6/10 low, 6/15 high, and 6/23 low. That call still looks good so no need for him to give an update I guess 🙂
Important Bradley turn date June 20. The FED decision to end the party with a rrate hike in a no growth, no jobs creation economy is clearly political and the final nail in the coffin. I think this wave down completes next week and we get a weak, last gasp fifth up to conclude the narrative. The smart money has been exiting for some time. After what the FED did yesterday, particularly the unwinding of the balance sheet at the rate of 50 billion per month (if they can find buyers), even the so-called dumb money cannot faiil to see what comes next.
Thanks!
thanks ….n..
Peter, did you see the article on CNBC today about passive and quantitative investing are now accounting for close to 60% of trading volume and traditional stock picking only accounting for about 10%. It would appear this is likely related to trading protocols by computer algorythyms. In your opinion, could this type of “investing” impact the traditional EW rules?
Looking forward to Peter’s chart show today. Most of what is passing for TA these days is a complete wsste of time.
haha … will have my hands full this morning! Everything’s moving.
Awesome call on NDX last week. A lot of buyers who top ticked the 1000.00 mark on those FANG stocks are now experiencing buyer’s remorse no doubt. Judging from some of the chatter, apparently some folk think now is a great buying opportunity! 🙂
🙂 Well, we know it’s not … at least, right now.
Energy stream so far this week
https://s1.postimg.org/nmgzahjq7/June_12_to_16_reatime_energy_stream.gif
The sign up for next week’s Chart Show (June 21) has been updated at the bottom of the post.
The indecisive chop continues with gaps down being steadily bought back all day during the session. Nothing to do but scalp the moves it would appear. Are we ever going to get a genuine correction in this demented market??!! 🙂
Have kept long position in US markets and am still looking for 3 to 4% up move into early July. Market typically rallies from end of June into July 15.
I do a lot of seasonality work, Valley, so your July stat was of interest. I don’t know how “typically” is defined, but since 2000, the S&P 500 has advanced 10 times from June 30 to July 15 and declined 7 times in that time zone. The average move is + 0.7%—not bad, but I’d be careful with the “typically.” In 2002, it was down 7.3% in those 2+ weeks.
True, I was including 98, 99, and 2000 which had average returns of 6% per year which made picture more bullish.
Peter G,
Good information! Thanks for sharing!!!
Finally, someone that is staying long until a sell signal develops, which we haven’t gotten yet. Never good to start shorting in a wave 3, and that’s what we are still in. Patience pays.
I am still learning EW. Thanks!
Good job, keep holding. Looks good going into Monday.
Verne,
Any thoughts on the Bradley Turn Date due next week on June 20th?
It would seem that wave three is incomplete. Unless of course the decline is over in just two more market sessions, which is highy unlikely imho.
My numbers show me we are in a iv of a 3 so we still have new highs to go.
Looking like we are in our way up to new highs. Still holding my longs in the S&P. Good luck to everyone.
This kind of price action is typical of some kind of B wave in my opinion. A B wave could indeed make a new high above the start of wave A on its wave to a final wave C. I am now of the opinion that we are already in a complex A, triangle B, with an upcoming wave C to conclude a fourts wave. Nothing else I have seen makes any sense, at least to my eyes. SPX is also finding strong support at the 2400 level so I am also thinking the wave C down may not be that deep and will be followed by a Summer rally for the final wave up. Just my two cents! 🙂
Can anyone confirm if we got a 3rd Hindenburg Omen signal on the NYSE today? I think we did…If the McClellan Oscillator was in negative territory!
We did.
With all the talk I’m seeing about the double Hindenburg omen or possible 3rd
I’m begining to question it . Most every time people get focussed in mass on a theory
Or a pattern it fails . Not saying I’m changing my view about a June 30 cycle high .
Just saying we’re hearing about revised or reformulated HO and if it was so great
To begin with why would someone revise it ? The Bradley model has also been revised
By others . Some of this for the better but the truth is obvious .
These have been revised because they don’t always work !
This is the case with any method , seasonal patterns included
I would much rather work with an old flawed but proven method then
Rely on a new revised yet flawed method . Accept the flaws is my take.
If the HO was perfect you would not have a 4 month window .
So for me I’d say take it as a warning yet use what you already use
And trade with that . Anyone can skew data to make a point yet
That doesn’t make it right .how many HO set ups have there been in
The last 9 years ? Or the last 20 30 , what has the real results been ?
Not just the one big drop which was 3 months or 6 months later
But all of the drops .Most big declines only last maybe 60 trading days
Roughly 90 calendar days and the big collapses are maybe a couple weeks
More often then not . Does waiting 4 months in pain justify that 2 week profit ?
Maybe but then again maybe not .the HO should not be used as an all in short
The signal for obvious reasons . It’s a longer term signal first if all and it’s been
Revised because it isn’t consistant .so the question is really what has every market
Decline had in common and what was the consistant signal that was in the closest time
Period to the top. Obviously from what I’m reading here the HO is not the answer.
Bull markets don’t die easy , the indexes tend to rise yet individual stocks lag or flat line
And decline and the participation narrows some stocks are a part of several indexes and
All of those heavier weighted stocks must be watched . Depending on the Dow spx or nasdaq
There will be several and while the FAANGS matter there is more . What would the HO look like
If you calibrated based on those higher weighted stocks ? How much of a delay would you expect ?
If I buy the SPY or the QQQ or any index ETF by default I’m paying 175 times earnings for Netflix or any other
Over priced stock .
So my question is simple , what stocks cover 60% of the Dow , what stocks cover 60% of the ndx
And which cover 60% of the sp 100.( OEX ) that is 3 indexs which cover 230 big name stocks
And 60% may only be 100 and that is a guess .follow those leaders and you will be way ahead of the game
And change them from time to time , an example MSFT has a higher weight in the Dow then it did a few years ago .
Anyways food for thought .
Think outside the box and watch the leaders and disregard the HO
Joe
Joe, I think the mostly experienced people posting here know there are no magic elixir market indicators. That includes the HO. There have been signals given in the past that amounted to nothing. There have been some that were very well timed. The most impressive signals have been given by the double Hindenburgs and if you followed the link I posted a few days ago, you would have to agree the track record has been quite remarkable. The only apparent failure in the past 30 years was in 1995. Indicators are best employed when we know what their purpose is. In the case of the HO, it is an offshoot of Norm Fosback’s High-Low Logic Index, and the rationale is that when both new highs and new lows are extensive, it denotes an unhealthy market condition with divergent behavior. Sometimes the market rights itself, but more often than not, especially following the dual HOs, NY and Nasdaq, there is a decline of some significance. Let’s just call it a warning signal that all is not well with market internals. Virtually all crash-like market activity has been preceded by an HO, BUT the converse is obviously not true. Not all HOs are followed by crashes. Just don’t carelessly ignore the potential message…
Excellent points Peter! Another thing that EW analysts sometimes become confused about is the notion of “black swans”. They should revisit Taleb’s book Often in an effort to emphasize the principle that news does not drive the waves, they incorrectly ignore the fact that there is nonetheless frequently correlation. Joe’s contention that bull markets do not die suddenly begs an important question – which bull market? Of course the response will be every one that we have seen so far. Why is it that so many people are ignoring the fact that the current market we are in is entirely unlike anyone that we have seen before? Presumptions about what this market can or cannot do based on what previous markets have done is I think, untenable and dangerous. We had a great example today. Take a look at the charts of several grocery retailers today and you see a mini “black swan” in the form of the announcement of Amazon’s announced buy-out of Whole Foods. I personally think people talking about how this bull market is going to die a slow death are quite possibly in for a rude surprise. The historic levels of complacency with respect to risk that we are now seeing virtually guarantees it. My greatest fear is that we are all one day going to wake up and find ourselves locked out of our trading accounts. Far fetched? Perhaps, but remember brokerage accounts are not FED insured. It is also entirely possible that the crisis could begin somewhere outside the US and overwhelm US brokerage account with pandemonium right at the opening bell as circuit breakers begin firing nationwide. Food for thought folk.
Peter G and Verne,
Thank you for your perspectives and comments! I appreciate you knowledge of the markets and insights!
…and for Andre’…All Haill the Vibrations!!!
Very insightful Verne. Your not the only one who has considered that possibility. Why else change the banking rules, but “for the banks (brokerage firms) advantage”.
Mcdough confirming 3rd ho
I agree with Joe that june 30 will show a high. In the first days of july many cycles turn. Remember that big moves almost always come after a lunar square as this brings low gravity/neap tides. 7/1 is first quarter. After this date it gets interesting. The end of july/august 1 will bring a low. So july looks very bearish.
Due to the holiday weekend the turn will come after 7/4. 7/5-7 are strong dates. But the strongest date is 7/13; this is the crash cycle. After a low 7/10 7/13 must be tested.
It is very likely that in the first week of july we will start a decline into spring 2018. In between we will see a retrace into early october but this should be a lower low.
For next week I expect a high 6/19, then a low 6/23 and up into 6/30.
Cheers,
André
Interesting. That would imply completion of a fourth wave down in about four days ( I think it would be a C of four personally) and a fifth wave up completing in a week. The high in June 19 would coincide with the important Bradley turn date of the 20. The vast majority of folk are insisting on a Fall final high. The recent price action leads me to believe that we will indeed see a short, even if sharp fifth wave up. Even after a four day decline, the kind of manic rises we have seen could still easily tag the long term target of 2500-2550 cited by numerous analysts. We should see lots of evidence of distribution on the next wave up as the last batch of savvy traders head for the exits. I remain short and continue to defend those positions with upside hedges. There is no way I am trading this market to the upside, which I think limited to 2 to 3 per cent from these levels.
Good to hear from you Andre We missed you …n..
Mcdough is saying on friday very closr to generating 4th ho
Yep! McCleland Oscillator was barely positive and so we missed it by a whisker.
Another useful thing about these omens is that the signals tell us how we should be trading the market. So many indices seem to be defying gravity these days and that has been the source of frustration for traders who sense the market is weak and trying to short them. 30% of the Nasdaq’s gains for example, have come from just five or six components, confirming the message of the HO. The key is to find the weak sectors and short those. Recently those have been commodities, including Gold, Silver and Oil, Retail and Automotive. I think any pops in these sectors will continue to be low risk/reward set-ups, instead of trying to trade manipulated and whip-sawing indices. The indices will eventually succumb to all the new 52 week lows and fall hard, but in the meantime, there are lots of far better opportunities for profitable trades.
Here is another interesting thought. I am sure some of you have seen the interesting study of the number of market crashes taking place during years ending in Seven. It is also true that most market crashes tend to occur in the Fall. The crash portion of an impulsive wave down is typically the third wave. For this reason, I have long contended that rather than a top being posted in the Fall, what is more likely is that we would see a very deep second wave correction going into the Fall, with the onset of a third wave decline immediately following. Just my two cents. 🙂
Good call, Verne! I am betting on a bullish market until turn of the decade based upon new tech mania (p.e.’s were double current levels at peak of dot com). Jupiter crosses Saturn in 2020 just as it did at the peak of the dot com in 2001; and there has been a tendency for J/S crosses to produce negative reactions in previous events early 1980s, early 1960s, 1940s, etc.; it is a 20 year event. Also decade cycle as you stated is weak in year 7, but makes it up in 8 and 9.
I think it is much more likely that we get a shake out in summer with nadir in late September, and then rally of some magnitude into next years mid term elections.
Markets cannot sustain these levels without continuing central bank largesse, with over one trillion of liquidity added to date.They will certai not long abide a tightening cycle so I expect the FED’s bluff to be called sooner rather than later. I am curious as to how the market will view it when they are forced to announce additional QE and take back the rate hikes. Will people figure out that QE actually has never stopped?
What if…CB’s add equity to their balance sheets as the Japanese CB has been doing? Harry Dent could be right about DOW 3,000, yet a few years before that is was DOW 38,000 =)
This coming Tuesday is a Bradley turn date
http://deflationland.blogspot.ca/2017/06/looking-for-that-long-convexity-trade.html?aaReferenceFrom=mcverryreport.com
Tom that chart blew me away! Of all the literally hundreds of charts I have looked at suggesting where the indices may go this year, that is the very first one that actually mirrors what I have been thinking (and on a few occasions saying) could possibly happen. I continue to be deeply struck by how everyone and his grandma is absolutely certain that we have another wave up to come. Somebody on the forum a while back said when all the analysts agree on the correct wave count, they are probably wrong! Thanks for the link. 🙂
Dr. Bob McHugh is very interested in the upcoming Bradley, and has detailed two scenarios for it in his newsletter, one of which is, yes, the final top for all of this.
I have a broader thesis that the 13-week Treasury ^IRX is in a 3rd wave up, and will keep rising for the rest of 2017, forcing additional rate hikes from the Fed.
I find the bond markets a huge challenge right now. The long bonds are sitting right at very long term support which has held , with prices rising even during recessionary conditions. On the other hand, it looks to me like TLT is finishing a corrective wave and should head lower. Then there is the question of of real risk in the broader bond market with all kinds of entities teetering on the edge of a cliff; places like Puerto Rico and the state of Illinois. I tend to agree with analysts who are predicting rates moving higher not so much because of inflationary pressure, clearly muted, but rather because of fear due to increasing defaults. You are quite right in that the FED has to follow the market and not the other way around when it comes to rates. If you are right and they are forced to keep hiking, that could be a game changer. The arrogance of these guys is now such though, that I would not be surprised to seem them try and buck the trend if the market really begins to tank. They are a one-trick pony. How they will be able to launch additional QE, while being strangled by the additional capital outlay occasioned by rising rates would be a mystery to me. I don’t think it can be done with a balance sheet that gargantuan. Rising rates means falling asset prices and their margin of solvency is thin indeed. In fact some would argue that the are already for all practical purposes insolvent.
Peter G
You make good points .
To clarify my post a bit .
Bull markets die hard ,
First you get the decline in the weaker stocks and the number of issues
In terms of leadership narrows ( individual stock picking gets more difficult )
For someone realizing this yet wanting to ride the last part of the run higher
They would shift money from individual stocks and into stock index funds or etf’s
Yet in doing this they will continue to drive the heavier weighted stocks in those indexes
Up by default . In order to track this a person can focus on the heavier weighted stocks
Of say the nasdaq 100 , the sp 100 and the Dow . You might find that over all there is only
100 stocks which are really moving the index . This is why the HO is showing up.
The new 52 lows should rise and the number of new 52 week highs should decline .
This is the nature of a market topping process . I’m not questioning the warning sign
I’m just saying if we watch those stocks which are presently the leaders then we will be
Further ahead than by betting on the Hindenburg omen .
The reverse argument which I don’t intend to make is that those stocks making new 52 week lows
Are oversold . They could also be trading at prices which some consider undervalued but I seriously
Doubt they are undervalued .
With out actually looking at stock valuations along with technical analysis and using Elliott wave theory
Then you don’t really know where the market is likely to go.
I have posted the June 30 date for months , I lightened up my stock exposure on March 20 and intend
To lighten up again come June 30. But…… Even though I intend to get short this market I still have a bullish bias
At this time….. I won’t exit every stock I own untill I see them giving me reasons to do so.
I will say this , I went into the year 2017 looking for an October high . I’m not so sure of that today but I’m not
Going to throw out my research and assume that isn’t possible either . I can see both a year end high as well as make the case
For a year end low.
I do not care which direction this market goes , what I do care about is profitting from which ever move comes .
I also see June july 2018 as a very very important high. That is 1 year away . My thinking is that it is either
A wave 2 high or the final 5th wave high . It is for my longer term working I’m lightening up on individual stocks.
To say this market is not like any other before it ?? I don’t agree entirely with that statement .
First of all no 2 bull markets are alike second of all each year there is some new cyclical issue to deal with
3 rd I’d say the central banks have not pushed near as hard in the past and failed as badly to create inflation
As they have over the last 8 years .
But ….. We have been in an uptrend for just over 8 years and the same tools that have worked in the past
Continue to work today. So many things say this is no different then the previous bull markets despite
It all. The bigger the bull only means the bigger the bear so keep that in mind .
When it does end it’s going to last a while .
I’m still in the ocean for a few more days yet will be back home around June 24 and will have more data to work with .
Andre, we agree ????? Lol I like your July date as well .
Let’s hope we stay in sync for a few months at the least
Joe
Hi Joe,
thanks for all your thoughts. Also my astro research is pointing to the major high as coming not until Sept 2018 soonest.
A new blog post is live: https://worldcyclesinstitute.com/elliott-waves-and-lemmings/
This website is for educational purposes relating to Elliott Wave, natural cycles, and the Quantum Revolution (Great Awakening). I welcome questions or comments about any of these subjects. Due to a heavy schedule, I may not have the time to answer questions that relate to my area of expertise.
I reserve the right to remove any comment that is deemed negative, is unhelpful, or off-topic. Such comments may be removed.
Want to comment? You need to be logged in to comment. You can register here.