Edward R. Dewey, who worked for US President Hoover in the 1930s was a pioneer in the discovery of natures cycles. They affect business, the markets, and so much more.
In the Great Depression, President Herbert Hoover asked Edward Dewey, who at the time was the Chief Economic Analyst at the Department of Commerce, to figure out why the US continually experienced economic booms and busts. In the 1800s and early 1900s, there were eight economic downturns of varying degrees.
Dewey devoted the rest of his life to uncovering and understanding cycles. During his lifetime, he established over 3000 cycles in nature and business.

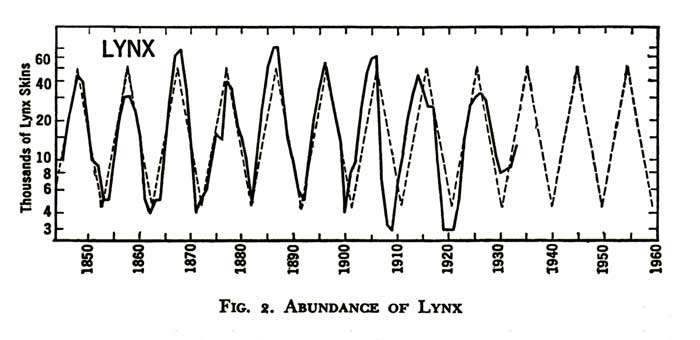
He found that the Canadian Lynx followed an abundance pattern of exactly 9.6 years. For over two hundred years, they’ve prospered and then died off in a regular rhythm. The coyote, red fox, fisher, marten, wolf, mink, and skunk have the same abundance patterns.
The chinch bug, which frequents much of the US Midwest, has a similar pattern—at its height swelling to as much as 70 million per acre down to just 1600 per square foot at the bottom.
 The lemming, that little six inch rodent found in Norway, has a 3.86 year life pattern. Every 3.86 years, they come down from the hills, destroy everything in site, don’t stop when they get to the sea. .. and end up drowning. A few who remain behind for some unknown reason start up the next herd which, right on schedule, heads to the sea all over again.
These cycles are apparent in every living thing. Just as the Moon travelling around the Earth every 25 hours affects the ocean in a 12.5 hour cycle (the tide), our circadian rhythms are also influenced by the Moon. Research has proven this to be the case (eg – the work of Rutger Weaver and his underground bunker experiments).
Now, you may want to argue about the fact that we’re influenced from beyond the confines of the Earth (which I find to be an exceptionally weak position), but it’s hard to argue with human nature. We continue along a path of habit, until a shock to the system causes us to reverse course.
You can equate this with a law in physics: a body will continue along a path until acted upon by an external force. To reverse the direction will require a force larger than the force that created the motion in the first place.
Humans don’t change their views until acted upon by an overwhelming outside force or, which is more often the case, gradually changing their mind based upon a growing change in the thinking of the herd around them. Herds don’t change their thinking in a day.
As an example, review the gradual trend change in smoking habits that I wrote about in March of this year. It also played out in five waves; trends always do. The higher the volume of participants, usually, the easier it is to track the underlying waves.
Back to those crazy lemmings: They don’t die till every bit of food is gone and they’re at the ocean.
Similarly, the herd isn’t going to change until they’re up against a brick wall. If things are working, they keep doing the same thing.
Taxi drivers in Chicago. There’s an interesting article in zerohedge this morning about taxi drivers in Chicago. With the rise of Uber and other rideshare companies, the value of “medallions” driver purchase to allow them licensed access has plummeted. This has been going on for several years and small business owners are going bankrupt, but nobody is really doing anything about the problem. They probably won’t, until it’s too late. That’s human nature (and the track record of governments, always the “last ones in”).
It’s human nature to abhor change. We don’t do it until we’re forced, generally.
Black Swan Financial Events
I want to address Black Swan events, because people keep talking about them, expecting them to somehow affect the stock market, although they never have before.
I would agree that there are financial black swan events, but they don’t affect the stock market to any great degree. I’ve shown this is posts about varies events that have had huge impacts on society here. Events such as 9/11, President Kennedy’s assassination, or Brexit (and any other major social, political, or financial event) have not had an appreciable impact on the stock market. Various assets or indices may react within a small period of time, but the current pattern plays out; the overall trend does not change.
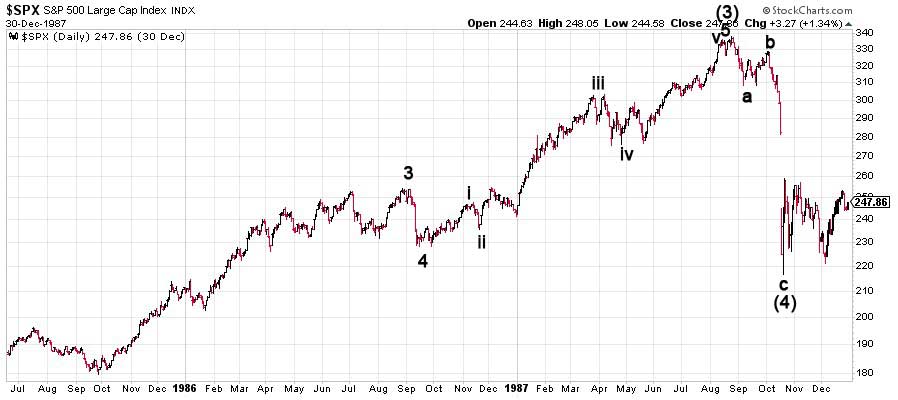
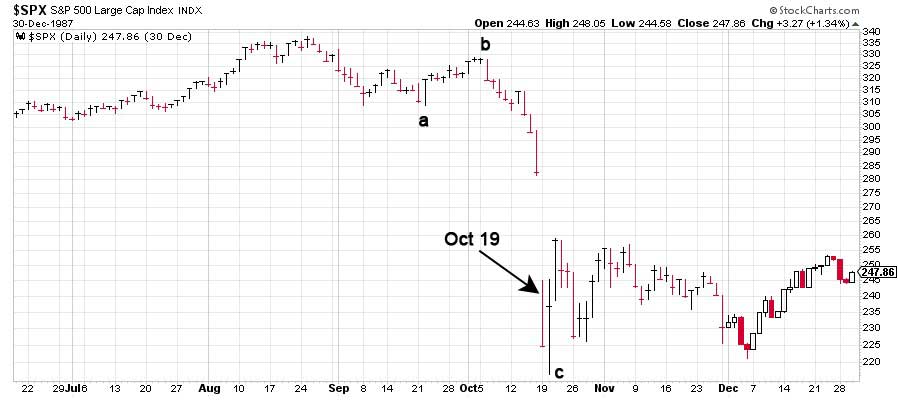
People point to October 19, 1987 as Black Monday … a financial black swan event in the stock market. But it wasn’t; it was highly predictable, as it was an Elliott Wave fourth wave playing out, as the two charts below illustrate. Crashes aren’t really crashes.
Above is daily chart of the SP500 from July, 1985 through December 30, 1987. You can see the end of the five wave build-up to the top at about 340 and then the “abc” drop to the previous fourth wave. From an Elliott wave perspective, there is nothing black swanish about this at all. It was highly predictable. Fourth waves in an impulsive sequence revert back to the previous fourth in a corrective wave, before they turn back up again to rejoin the trend.

Above is a daily chart of the SP500 from June 20, 1987 through December 30, 1987 (a much tighter timeframe). You can see how the October 19 “crash” is part of a C wave that was already about half-wawy through its projected path. The gap shown was the overnight progress, but the point is that the entire pattern is one that plays over and over again in an Elliott wave sequence at various degrees of trend, because progress is fractal.
The “crash” was simply a continuation of a C wave.
Let’s Let Nature Play On
Elliott waves are an guide and tracking system for the mood of the financial herd. The market will keep tracking upwards until all the events along the way turn the positive herd negative. It isn’t going to happen in a day. There will not be any single event that creates the turn. However, there may be a financial event close-by that will be blamed for the turn, even though the turn has already happened.
The market will continue along its journey of churning out the same patterns over and over again, progressing through all the required waves as it always has been, until the positive mood of the crown has been whittled away to nothing. At that point, the fifth way will finish, and the market will turn down. Sometime during the third wave (or C wave, as the case may be), the pundits will call a crash, even though the market turned a long time ago and the progress downward has been predicted to the day by EW analysis who can read waves and understand fibonacci measurements.
You can’t stop this process before it’s played out to its natural end. Any one event will not do it. As with lemmings, we won’t be able to point to any one day in which they’ll all die out. It will take 3.86 years for the process to play out. There will be a day when 50% of the original population has died. And there will be a day when none of the lemmings sitting at the ocean’s edge are dead.
However, nothing will stop the progress. As long as they’re hungry and feeling good, they’ll continue on with their journey, eating everything in site. Not one of them will confer with the others and collectively decide that if they move along this road, disaster is eventually going to strike. It might occur to a few of the smarter ones, but by and large, the herd will move along their path until they can’t move any more.
So the market moves towards the eventual trend reversal with its bullish and bearish waves along the way. Elliott waves give us the predictable guide as to when these subwaves might happen. Knowing what wave or pattern we’re in and knowing that since we began to track the market (in the 1700s), these waves have always played out in the same manner, we can have a very good idea of where we are in the process.
Nobody can know exactly when the herd will turn 51% negative. But it’s at about that point that the market will change trend. Sometime later, the herd-watchers will catch on and start blaming any event they can on the turn. But just like the progress of lemmings to the sea, it was bound to happen. The more astute of us can see it happening. And the herd will make sure it does, just as it always has before.
Let’s let nature play on, and admit that it’s far more powerful than the collective human race.
Caveat: As we know, emotional responses trump logic. So even though the facts don’t support market moves based upon events, nor early truncations of an Elliott wave pattern, I’m sure the discussion is going to go on and on …
The Market This Week
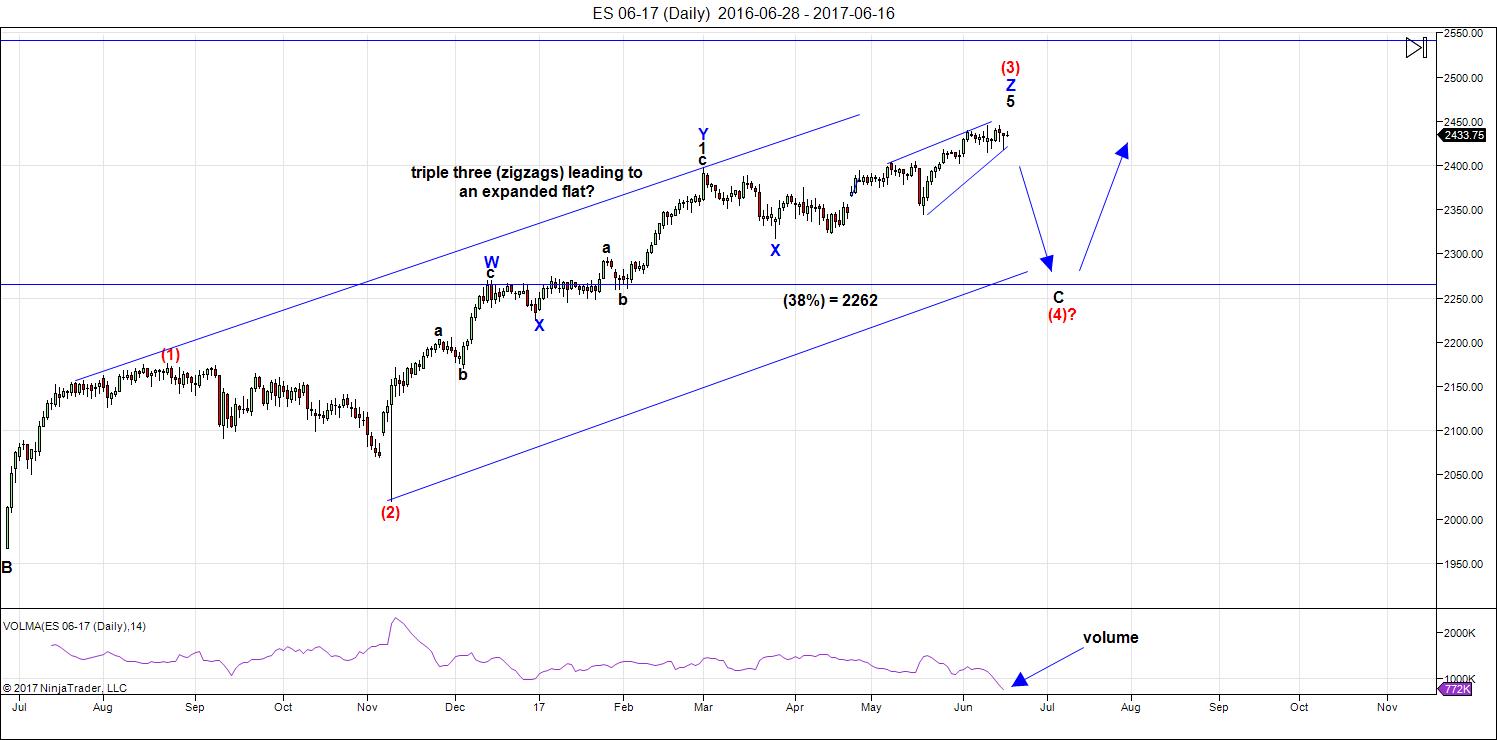
Here's the latest daily chart of ES (emini futures)

Above is the daily chart of ES (click to enlarge, as with any of my charts). The count has not changed appreciably. What appears to be a third zigzag of the third wave (you can only have three patterns within a corrective wave—this third pattern starts at blue X on the chart) continued slightly higher as predicted last week and continued to build a potential very large expanded flat at the top of the circle red third wave. The very top of this last wave formed what looks like an ending diagonal, but this week, it extended and negated. We now simply have a corrective zigzag pattern to a high and we're waiting for it to top.
Last week, in the Chart Show (signup below) and for my Trader's Gold subscribers, I called the turn in SPX at 2446, but also warned that it may not be the final drop. This has proven to be the case.
The USD currency pairs have still not hit their targets, but they're close. so that's a warning that the US indices will likely see one more top before heading down in tandem with the US currencies.
Summary: We've completed the third wave in ES at the top of a possible expanded flat or we have one more very small high to put in. I believe the Nasdaq side of the US market has likely seen the top.
Volume Head's Up: Look at the relative volume at the bottom of the above chart. At the ends of waves, the volume tends to drop to extremely low levels. We certainly have that happening at the top of this wave. Volume will pick up substantially as we move into the fourth wave.
After completing the larger fourth wave, we'll have one more wave to go, which could be an ending diagonal as a fifth wave. The long awaited bear market is getting closer.
______________________________________
Sign up for: The Chart Show
Wednesday, June 28 at 1:00 pm EST (US market time)

The Chart Show is a one hour webinar in which Peter Temple provides the Elliott Wave analysis in real time for the US market, gold, silver, oil, major USD currency pairs, and more. You won't find a more accurate or comprehensive market prediction anywhere for this price.
Get caught up on the market from an Elliott Wave perspective. You’ll also get Andy Pancholi cycle turn dates for the balance of the current month. There’ll be a Q&A session during and at the end of the webinar and the possibility (depending on time) of taking requests.
All registrants will receive the video playback of the webinar, so even if you miss it, you’ll be sent the full video replay within about an hour of its conclusion. For more information and to sign up, click here. NOTE: the weekday and time have changed - to Wednesdays.


6th HO genereated
6th HO generated
The only thing that makes sense right now with this price action is that we are in some kind of fourth wave ahead of one more wave up. It seems clear that we do not yet have an interim top and that means new highs yet to come it would appear.
I’m not 100% sure about that. Nas has retraced 61.8% of the drop, so if it goes higher, yes, if it turns here, no. I’d even give it room to 78.6%
Look at a Dow futures chart from the top. It has stayed inside a 4 hr downtrend line all the way from the top, broke the bottom of a triangle overnight and only retraced to the trendline, where it has now turned down. The DOW’s biggest retracement from any bottom has only been 38.2%, so it still appears to be in 1 big wave down.
S&P has only retraced half the drop from the top.
Too early to call it, but my bias remains to the downside for now, unless the DOW breaks this downtrend line and goes up to 21480. Then, I’ll be even more confused if it stops there and leaves us hanging.
You are right about DJI Mike. I was watching SPX with some perplexity. DJI has indeed made a series of lower highs and lower lows and remains within a down-trend channel. I am always a bit concerned when a trend change at this dergee begins with such an obvious lack of downside momentum (and divergence) among the various indices. I was expecting everything to turn together and anything bucking the trend sends up a caution flag.
SPX has confused the heck out of me. It’s un-tradeable. Option expiration three times a week and the shenanigans which go with it have made it impossible. I used to do DJX exclusively. Went to SPX because my logic was it’s probably harder to rig an index with 500 stocks than 30. I’m wrong.
SPX is waiting for all of us to give up so it can descend into the pits of hell. The market can remain irrational longer than we can remain solvent.
Oh, and if you look at DJX, it usually makes it’s big move on the third Friday of the month. That’s because monthly DJX’s expire on Thursday. You get spot price for em at market open next day. After those settle, it moves. Get around it by going another month out and paying the premium.
Glad to hear its not just me! 🙂
Thanks for the DJX tip!
I get the impression the banksters are pulling out all the stops in an attempt to re-enter the gap area from Monday’s open.
Interestingly enough both DJI and SPX filled that gap but Nasdaq Comp. has not so far….
Full moon lunar eclipse tomorrow
Very wrong
I went back to check
New moon but there is something to this one
It’s similar to the new moon of May 25 th .
Next week’s market action should tell the tale .
Not an Official Name
Supermoon is not an official astronomical term. It was first coined by an astrologer, Richard Nolle, in 1979. He defined it as ‘a New or a Full Moon that occurs when the Moon is at or near (within 90% of) its closest approach to Earth in its orbit’. It is not clear why he chose the 90% cut off in his definition.
There are no official rules as to how close or far the Moon must be to qualify as a Supermoon or a Micro Moon. Different outlets use different definitions. Due to this, a Full Moon classified as a Supermoon by one source may not qualify as a Super Full Moon by another.
Great American Eclipse 2017
On August 21, 2017, a Black Moon will cause a total solar eclipse which is an extremely rare combination.
This eclipse will be a spectacular sight and will be visible all across the United States. This has earned it the nickname the Great American Eclipse, although it will also be visible in other countries.
Super and Micro New Moon
The Moon orbits Earth counterclockwise on an elliptical path, and the same side of the Moon always faces Earth. However, the Moon rocks slightly from north to south and wobbles a little from east to west. This motion, known as lunar libration, makes it possible, over time, to see up to 58% of the Moon’s surface from Earth, but only 50% at a time.
The point closest to Earth is called perigee and the side farthest point is known as apogee. When the New Moon is close to the perigee, it is known as a Super New Moon.
A Micro New Moon, on the other hand, is when it is farthest from Earth, at apogee. It’s also known as a Minimoon or a Mini New Moon.
6 HO generated. May be does not mean anything
It is statistically significant. In instances where there are five or more official HO over a thirty day period, there is about a 36% chance of a market decline of 10% or more, compared to about around a 33% for all observations, regardless of how many. Of the 42 HOs seen since 1986, 25 had five or more observations, with a 28% chance of a market crash (15% or greater) versus a 21% chance of a crash with fewer than five observations. So yes, the number observed is statistically significant.
A new blog post is live: https://worldcyclesinstitute.com/the-summer-solstice-slide/
This website is for educational purposes relating to Elliott Wave, natural cycles, and the Quantum Revolution (Great Awakening). I welcome questions or comments about any of these subjects. Due to a heavy schedule, I may not have the time to answer questions that relate to my area of expertise.
I reserve the right to remove any comment that is deemed negative, is unhelpful, or off-topic. Such comments may be removed.
Want to comment? You need to be logged in to comment. You can register here.