
Edward R. Dewey, who worked for US President Hoover in the 1930s was a pioneer in the discovery of natures cycles. They affect business, the markets, and so much more.
In the Great Depression, President Herbert Hoover asked Edward Dewey, who at the time was the Chief Economic Analyst at the Department of Commerce, to figure out why the US continually experienced economic booms and busts. In the 1800s and early 1900s, there were eight economic downturns of varying degrees.
Dewey devoted the rest of his life to uncovering and understanding cycles. During his lifetime, he established over 3000 cycles in nature and business.
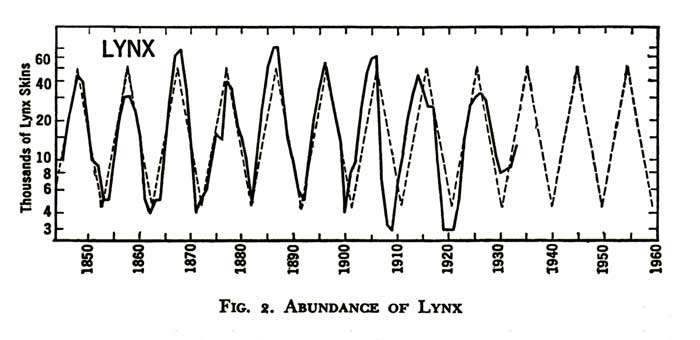
He found that the Canadian Lynx followed an abundance pattern of exactly 9.6 years. For over two hundred years, they’ve prospered and then died off in a regular rhythm. The coyote, red fox, fisher, marten, wolf, mink, and skunk have the same abundance patterns.
The chinch bug, which frequents much of the US Midwest, has a similar pattern—at its height swelling to as much as 70 million per acre down to just 1600 per square foot at the bottom.
 The lemming, that little six inch rodent found in Norway, has a 3.86 year life pattern. Every 3.86 years, they come down from the hills, destroy everything in site, don’t stop when they get to the sea. .. and end up drowning. A few who remain behind for some unknown reason start up the next herd which, right on schedule, heads to the sea all over again.
These cycles are apparent in every living thing. Just as the Moon travelling around the Earth every 25 hours affects the ocean in a 12.5 hour cycle (the tide), our circadian rhythms are also influenced by the Moon. Research has proven this to be the case (eg – the work of Rutger Weaver and his underground bunker experiments).
Now, you may want to argue about the fact that we’re influenced from beyond the confines of the Earth (which I find to be an exceptionally weak position), but it’s hard to argue with human nature. We continue along a path of habit, until a shock to the system causes us to reverse course.
You can equate this with a law in physics: a body will continue along a path until acted upon by an external force. To reverse the direction will require a force larger than the force that created the motion in the first place.
Humans don’t change their views until acted upon by an overwhelming outside force or, which is more often the case, gradually changing their mind based upon a growing change in the thinking of the herd around them. Herds don’t change their thinking in a day.
As an example, review the gradual trend change in smoking habits that I wrote about in March of this year. It also played out in five waves; trends always do. The higher the volume of participants, usually, the easier it is to track the underlying waves.
Back to those crazy lemmings: They don’t die till every bit of food is gone and they’re at the ocean.
Similarly, the herd isn’t going to change until they’re up against a brick wall. If things are working, they keep doing the same thing.
Taxi drivers in Chicago. There’s an interesting article in zerohedge this morning about taxi drivers in Chicago. With the rise of Uber and other rideshare companies, the value of “medallions” driver purchase to allow them licensed access has plummeted. This has been going on for several years and small business owners are going bankrupt, but nobody is really doing anything about the problem. They probably won’t, until it’s too late. That’s human nature (and the track record of governments, always the “last ones in”).
It’s human nature to abhor change. We don’t do it until we’re forced, generally.
Black Swan Financial Events
I want to address Black Swan events, because people keep talking about them, expecting them to somehow affect the stock market, although they never have before.
I would agree that there are financial black swan events, but they don’t affect the stock market to any great degree. I’ve shown this is posts about varies events that have had huge impacts on society here. Events such as 9/11, President Kennedy’s assassination, or Brexit (and any other major social, political, or financial event) have not had an appreciable impact on the stock market. Various assets or indices may react within a small period of time, but the current pattern plays out; the overall trend does not change.
People point to October 19, 1987 as Black Monday … a financial black swan event in the stock market. But it wasn’t; it was highly predictable, as it was an Elliott Wave fourth wave playing out, as the two charts below illustrate. Crashes aren’t really crashes.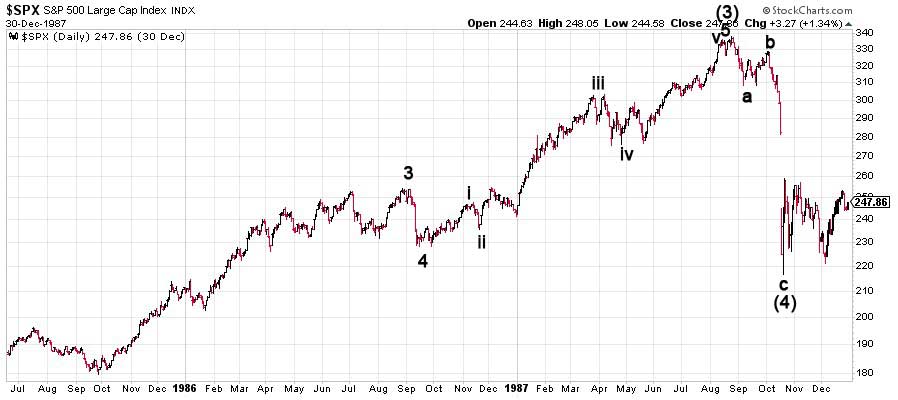
Above is daily chart of the SP500 from July, 1985 through December 30, 1987. You can see the end of the five wave build-up to the top at about 340 and then the “abc” drop to the previous fourth wave. From an Elliott wave perspective, there is nothing black swanish about this at all. It was highly predictable. Fourth waves in an impulsive sequence revert back to the previous fourth in a corrective wave, before they turn back up again to rejoin the trend.
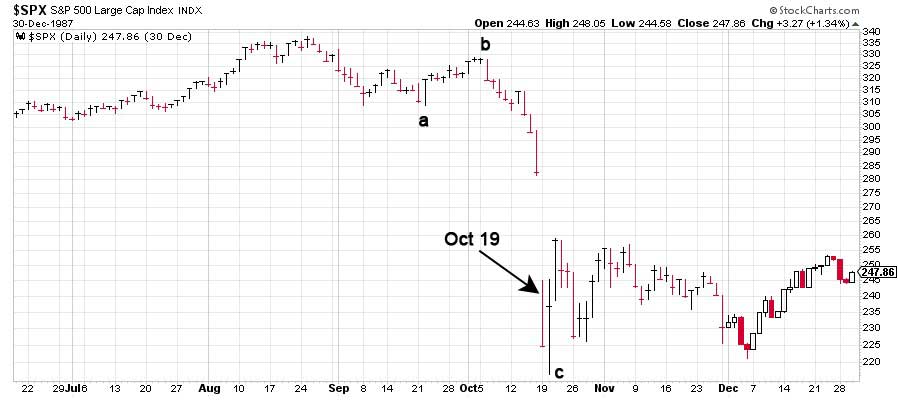
Above is a daily chart of the SP500 from June 20, 1987 through December 30, 1987 (a much tighter timeframe). You can see how the October 19 “crash” is part of a C wave that was already about half-wawy through its projected path. The gap shown was the overnight progress, but the point is that the entire pattern is one that plays over and over again in an Elliott wave sequence at various degrees of trend, because progress is fractal.
The “crash” was simply a continuation of a C wave.
Let’s Let Nature Play On
Elliott waves are an guide and tracking system for the mood of the financial herd. The market will keep tracking upwards until all the events along the way turn the positive herd negative. It isn’t going to happen in a day. There will not be any single event that creates the turn. However, there may be a financial event close-by that will be blamed for the turn, even though the turn has already happened.
The market will continue along its journey of churning out the same patterns over and over again, progressing through all the required waves as it always has been, until the positive mood of the crown has been whittled away to nothing. At that point, the fifth way will finish, and the market will turn down. Sometime during the third wave (or C wave, as the case may be), the pundits will call a crash, even though the market turned a long time ago and the progress downward has been predicted to the day by EW analysis who can read waves and understand fibonacci measurements.
You can’t stop this process before it’s played out to its natural end. Any one event will not do it. As with lemmings, we won’t be able to point to any one day in which they’ll all die out. It will take 3.86 years for the process to play out. There will be a day when 50% of the original population has died. And there will be a day when none of the lemmings sitting at the ocean’s edge are dead.
However, nothing will stop the progress. As long as they’re hungry and feeling good, they’ll continue on with their journey, eating everything in site. Not one of them will confer with the others and collectively decide that if they move along this road, disaster is eventually going to strike. It might occur to a few of the smarter ones, but by and large, the herd will move along their path until they can’t move any more.
So the market moves towards the eventual trend reversal with its bullish and bearish waves along the way. Elliott waves give us the predictable guide as to when these subwaves might happen. Knowing what wave or pattern we’re in and knowing that since we began to track the market (in the 1700s), these waves have always played out in the same manner, we can have a very good idea of where we are in the process.
Nobody can know exactly when the herd will turn 51% negative. But it’s at about that point that the market will change trend. Sometime later, the herd-watchers will catch on and start blaming any event they can on the turn. But just like the progress of lemmings to the sea, it was bound to happen. The more astute of us can see it happening. And the herd will make sure it does, just as it always has before.
Let’s let nature play on, and admit that it’s far more powerful than the collective human race.
Caveat: As we know, emotional responses trump logic. So even though the facts don’t support market moves based upon events, nor early truncations of an Elliott wave pattern, I’m sure the discussion is going to go on and on …
Couldn’t be happier … KK 2
Couldn’t be happier …The analysis and insight you provide is simply amazing! I’ve been trading the futures and equity markets for well over thirty years and usually average around 5% monthly. Since joining your Traders Gold Service two months ago, that number has better than doubled. I couldn’t be happier.—KK |
Rise above the rest … SM 2
Rise above the rest …I have only ever met a few people who, in their chosen fields (astrology, medicine, music, martial arts, technical analysis), rise above all the rest and you are one of them…you have ‘the gift’…and that’s why I’m a Trader’s Gold member. —SM |
Tops in your field DZ 2
Tops in your field …You are tops in your field. Tried to follow Elliot Wave international for years. They were always behind the market. After discovering you, I perceive that you are an expert in reading the waves, which puts you way ahead of the rest of your peers. And you can read the Waves like you are reading tomorrow’s financial section. I pray you stay healthy. —DZ |
the real deal SM 2
The real deal …‘Educational, insightful and thorough market analysis for all levels of traders. It’s Elliott Wave at its best….Peter Temple is the real deal’ —SM |
Get an upper hand … JC 2
Get an upper hand in trading …Seeing all the different currency pairs and the wave structures and hearing you explain why this has to do that on a nightly bases gives one a upper hand when trading. Elliott Wave applies to all stock and indices and can be applied to any candlestick chart. If someone ask what you want for Christmas – Tell them a membership to Peter’s “Traders Gold!”—JC |
A true expert in Elliott Wave FL 2
A true expert in Elliott Wave …You are a true expert in EW analysis. What you provide is not available anywhere and is priceless. Subscription on your services is the best thing I have ever done. Many thanks for your effort to make me a better investor. I now have more trust in my investment decisions. I hope you will continue the excellent work! —FL |
Have not had a losing week RW 2
Have not had a losing week …I have been with Peter almost a year. The only thing that matters is have I made money with his service. I think I have finally turned the corner using Peter’s EW. I have not had a losing week in the last 5 months. Thanks Peter, for your amazing amount of hard work. —RW |
The best of them JL 2
The best of them …Last couple of years, I subscribed to several ‘market traders’. You are by far the best of them and the personal contact is awesome. Daily and daily updates are very well written! Besides your expertise in EW, I also like your cycles analysis. Best investment I ever made! —JL |
The Market This Week
Here's the latest daily chart of ES (emini futures)
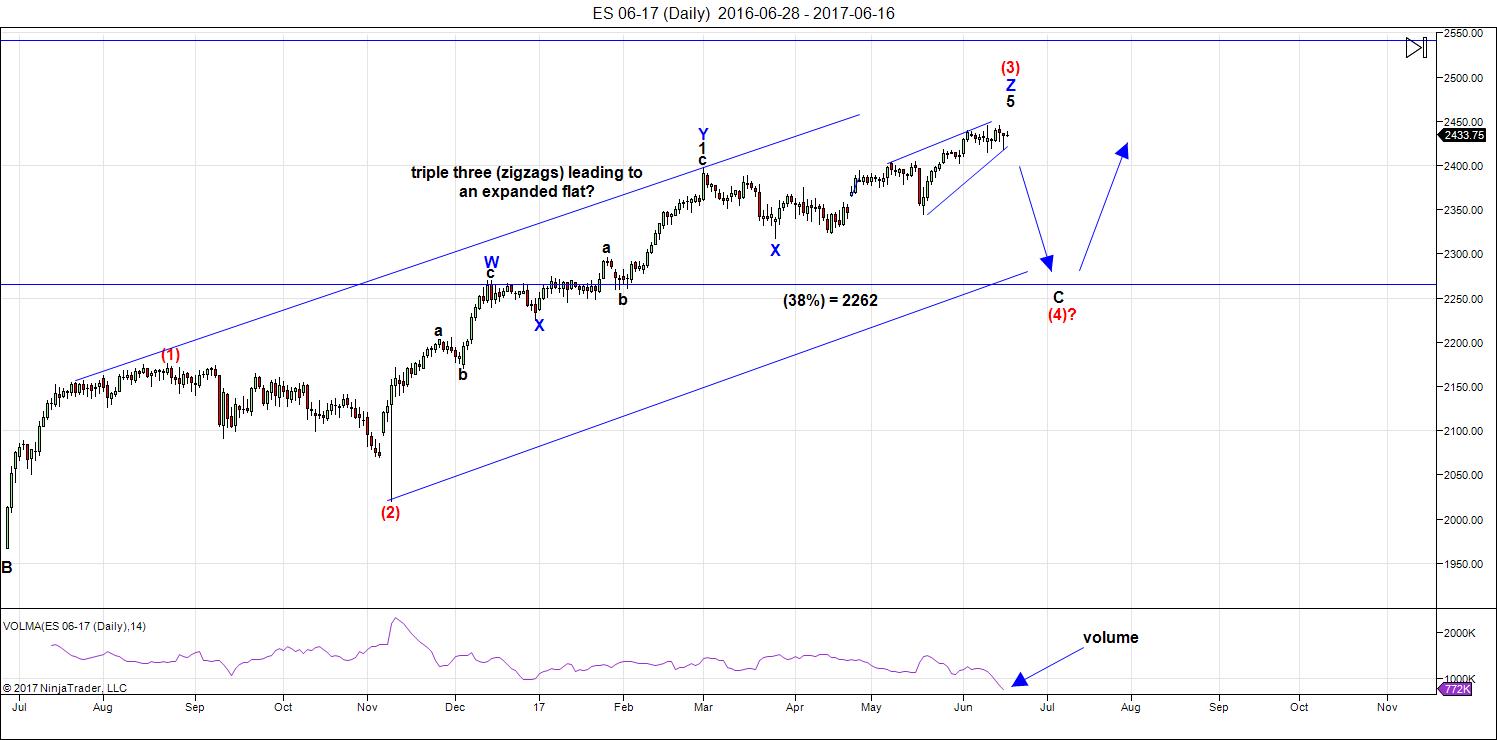
Above is the daily chart of ES (click to enlarge, as with any of my charts). The count has not changed appreciably. What appears to be a third zigzag of the third wave (you can only have three patterns within a corrective wave—this third pattern starts at blue X on the chart) continued slightly higher as predicted last week and continued to build a potential very large expanded flat at the top of the circle red third wave. The very top of this last wave formed what looks like an ending diagonal, but this week, it extended and negated. We now simply have a corrective zigzag pattern to a high and we're waiting for it to top.
Last week, in the Chart Show (signup below) and for my Trader's Gold subscribers, I called the turn in SPX at 2446, but also warned that it may not be the final drop. This has proven to be the case.
The USD currency pairs have still not hit their targets, but they're close. so that's a warning that the US indices will likely see one more top before heading down in tandem with the US currencies.
Summary: We've completed the third wave in ES at the top of a possible expanded flat or we have one more very small high to put in. I believe the Nasdaq side of the US market has likely seen the top.
Volume Head's Up: Look at the relative volume at the bottom of the above chart. At the ends of waves, the volume tends to drop to extremely low levels. We certainly have that happening at the top of this wave. Volume will pick up substantially as we move into the fourth wave.
After completing the larger fourth wave, we'll have one more wave to go, which could be an ending diagonal as a fifth wave. The long awaited bear market is getting closer.
______________________________________
Sign up for: The Chart Show
Wednesday, June 28 at 1:00 pm EST (US market time)

The Chart Show is a one hour webinar in which Peter Temple provides the Elliott Wave analysis in real time for the US market, gold, silver, oil, major USD currency pairs, and more. You won't find a more accurate or comprehensive market prediction anywhere for this price.
Get caught up on the market from an Elliott Wave perspective. You’ll also get Andy Pancholi cycle turn dates for the balance of the current month. There’ll be a Q&A session during and at the end of the webinar and the possibility (depending on time) of taking requests.
All registrants will receive the video playback of the webinar, so even if you miss it, you’ll be sent the full video replay within about an hour of its conclusion. For more information and to sign up, click here. NOTE: the weekday and time have changed - to Wednesdays.


I’m definitely in the camp of 1 more high, then i do believe we have a significant drop afterwards for the wave 4. Good analysis Peter, appreciate your time.
Will be watching that 2447 area for an exit. If not there, it could see 2454-2479 imho. They want to run this up to get rid of their shares.
Not all corrective waves are created equal, not do they all re-trace to expected targets. For example, a fourth wave triangle often has a less deep re-tracement than say a Zig-Zag. It seems to be when we refer to black swans, no one is arguing they cannot be counted legitimately as part of a developing EW. After all we always have the 20/20 vision of hindsight. While one can make an educated projection about where a wave is likely to go, one can never predict it with any certainty. It would seem to me that what qualifies “crashes”, “black-swans”, “melt-downs” or what-ever you want to call sudden and steep market declines is that few folk expect them, even EW analysts. How do I know this? I have made a point of carefully looking at the news cycle prior to as many of these events as I can and that fact seems to be almost always true. In fact bullish sentiment, often abounds ahead of this dramatic declines! Of course there are exceptions, and you can find an occasion in which a lone voice or two warned of the potential danger, but the general theme I have discovered with regard to so called “black-swans” is that while it always easy to go back and assign a EW count to the move, the fact remains that the exact reason why they are designated the way they are is that few people expect them when they happen.
Peter, this post is why I love your site so much! Excellent content and unique!
This is the best post yet!
Lynx nadir correspond very closely to Saturn/Jupiter heliocentric opposition and conjunction, every 10 years approximately. In other words, when S and J are exactly aligned on same side of sun; or when they are exactly aligned on different sides of sun the Lynx nadir occurs. Market implications?
Interesting … thanks. 🙂
Peter
I loved your update .:)
Excellent job
I finally finished my timing model this evening
Yet I didn’t have time to dig through all the cycles yet
That is next , then I’ll overlay the Dow chart to them
For correlations .
One thing I can’t rule out is a 4 th wave TRIANGLE .
For that to show itself I’d need to see an early Sept low .
Sept 5 th is showing up as well as Sept 18 th ( lows )
Not going to change my June 30 cycle high date yet
June 23 also showing up . I have no clue on Indicators
Yet back in early May they were oversold .
Looks to me ( educated guess ) everything is coming
Together for a high .
I have been experimenting with Martin armstrong’s 8.6 year cycle
And the sub cycles with in it . No opinions at this time yet I’m discovering
A few things that dove tail with my planatary timing model .
The section to get through once I’m home is George Lindsay bull market
Time spans . Anyways thanks for the update -)
Joe
Verne
In have stopped myself from going into the details
Or wave ratios of steep declines yet most all of them
Follow the same ratio and they all show the same trigger point
Which implies the bottom is in . To understand this I began with
The 1929 crash then the 1937 decline and I looked at every steep decline
All the way up to the year 2015 . All of them showed the same ratio .
That does not mean all will hit that lower target but…. If we’re going to
See a crash like decline then I want to know where that target sits .
The same line of thinking goes with targeting highs . The target may not
Get hit on one index yet it will most likely be hit on another .
Things to consider , the yearly pivot ( open + high + low + close / 4 )
Also high + low + close / 3 . Use the previous years data . Take the range
Of 2016 and add it to the pivot call it R1 . That’s key resistance for the year .
Add 50% of the range ( 150 % of last year’s range ) add to the pivot call it
R 2. You can do the same thing with quarterly charts or monthly charts
Daily etc… My focus is more the yearly than the rest .
It’s a helpful tool is all .
If the targets don’t get hit then I’d say the person doing the calculations
Has made an error .
All targets get hit if your analysis is correct .
Fibonacci price and time targeting is rarely wrong .
Bold statement I suppose but I have seen it work
So many times that I always include it in my price targets .
Odd math this year .
365 days in a year , .236 * =86.14 , where was the Dow on the 86 th day of the year ?
.382 = 139.43 , where was the Dow on the 139 th day of this year ?
.5 = 182.5 , should be interesting to see how the Dow moves out of the 182 day of this year .
.618 is the 225.57 day of the year .
I have not paid much attention to Fibonacci ratios in a given year yet this year I find it
Interesting .
My preference is Fibonacci time ratios based on 5 wave structures yet
There is several ways to include both time and price targeting .
You won’t find it written in a book though , you have to study
And observe the market .
Peter will disagree with me on this next sentabce most likely
Yet the .618 time line has the worst consistency . The .382 and .786
Being the most consistent .
I once many years ago forecasted the stock price of BSX for an entire year
All based on Fibonacci price and time targets using a weekly chart .
I gave it to a friend who worked there . He called me when the stock had reached
It’s projected high and asked what’s next ? I asked why ? He said all his friends at work
We’re trading their 401 k based on it and had done really well and wanted to know what to do .
I said I’m scared to tell you and you shouldn’t be trading off it but… The stock price is going to drop
In half over the next 4 months . To that he says ( after a year of nailing almost every turn in advance )
Not going to happen and I was wrong . Good enough I figured . The stock dropped by 50% and bottomed
On the exact day forecasted . It totally blew my mind and I had to go back over everything I did just to understand
Why I got it so right . I have seen that happen enough times to trust Fibonacci price and time ratios yet I also
Have seen the failures . When you get it right it’s mind blowing and everything stays lined up for months
When you get it wrong you know it pretty quick .
This year I am seeing Fibonacci time sequences showing up everywhere yet I have not had the time to put them
All together .
Not blowing my horn mind you just noting targets get hit when you have everything laid out correctly .
Price and pattern and time . It’s not easy but I start with the 36 day chart and monthly chart first
Once you get the longer term right then get to the shorter term .
Longer term to shorter term is the correct order
I’m rambling
Nuff said
Thanks Peter
Joe
Joe I fully agree there a a number of ways to make good projections about price targets . I know for example fib re-tracements are an essential part of Peter’s analysis and he has often mentioned how critical it is to wait for price to hit targets. There are also other techniques like the measured rule, re -tracement of parabolic rises (which more often than not retrace the entire parabola) and head and shoulders patterns etc etc. The point I have been trying to make about market crashes is not so much how deep they are (somewhat self evident if they are crashes they will be 20% or more), but rather WHEN they occur, and all I am saying is that they are rarely expected. Another important distinction in my mind is that a target reached over several years and one reached over several weeks clearly are two different animals, with the former quitelunlikely to be considered a “crash”.
By the way Joe, it is interesting that you mention fib ratios with regard to time. I have seen only a few analysts that cite time fib relationships and I get the impression that they are considered less reliable than price relationships. I stopped paying attention those time fibs after so many calls I saw turned out to be way off the mark in my experience. I have never seen it applied with any consistent accuracy. Some people insist that any relationship within 10% is acceptable but I personally think that is too wide a margin for trading decisions.
This week in PALS:
Phase: positive
Distance: positive
Declination: positive after Wednesday
Seasonals: weak beginning Tuesday
Lunar alignments: positive
Summary: This week is more positive than negative for SPY.
Clearly auspicious market calls have been right so far… 🙂
I was stopped out of short trades today for a small loss cushioned by a nice return on upside hedges. A wise man once told me there should always be a numbet that tells you your expected wave count is incorrect. 🙂
Next four days are not so great seasonally and with nice gain today am moving to a option position of small size. So, if market continues to rally will benefit and if market sells off loss will be limited. =)
I cashed out my short oil trade today and will probably exit my precious metals short later this week. Keeping an eye on WTI futures and may re-enter via oil producer or explorers. We are at a critical support shelf and if it breaks, we are going much lower I think.
realtime energy stream
https://s17.postimg.org/60csgc0kv/June_19_to_21_realtime_energy_stream.gif
This wily bull market continues to defy even the most seasoned of analysts!
He apparently is not quite done yet. I am starting to revisit my notion that the current top could be a bigger one that most are calling for. I understand that overbought conditions can persist for quite some time but this is getting just a bit
too cute! 🙂
Just my two denarii…
Caveat emptor post 6/24. I believe that will be the peak energy day for next month or so.
May rise beyond that date into early July, but believe will be well below it in late July.
No signs of a reversal today so the Bradley turn expected tomorrow may be off by a few days. NDX gave a very clear sell signal a two Friday’s ago but we have seen how completely unpredictable this market has been. I for one am not about rule out a NDX return to all time highs.
Tim Knight has a measured move (from 2009 lows, 161.8 fib extension) for S&P cash at around 2486.00. If we hit that before we get a decent pull back, I think it would be notable. Christian Guftason’s road-map I find most intriguing. He called for a move to around 2455 on Tuesday with an intra-day reversal which would align perfectly with the expected Bradley turn date.
https://worldcyclesinstitute.com/elliott-wave-the-long-term-corrective-scenario/#comment-18689
“We have a Bradley turn tomorrow, the market is overextended up into the daily top Bollingers, but we are still missing one very important element for a durable top — no breadth divergence! This is an important element in all the big tops, market breadth evaporating into a final high…So while we may get a tradable selloff into the end of June, we should propose a short-term count more along these lines, as we levitate into July. A divergence with NYAD, etc, by then would be a very welcome sight.”
Christian Guftason, June 19, 2017
I am a bit puzzled by all the talk about market breadth so I must be missing something. The very fact that we are seeing so many new 52 week lows in so many indices has me wondering exactly what measures go into determining market breadth divergence. Something does not quite add up. Lowry’s has also been reporting “healthy” market breadth during the advance. Does anyone know what the fourmula is?
Tim ord is calling for three drive yo the top and to. 2300. Then higher high
Rose,
Could you translate??
If I were to guess, I think Rose is describing a three wave corrective move down to the 2300.00 pivot from the current highs, then a final wave up.
We are clearly in an impulsive move up. In my view, evidence is mounting that it is a significant top. One can only adjust and re-label waves for so long before prudence requires one to consider that something else might be developing. I think we have a break-out upwards in a final wave.
Tim ord is saying 3rd high in spx – threw drive to top. And in vix higher low. So. He expecting cirrection to 2300.
Got it. A third wave up. Vix divergence with new highs.
Verne
Your correct about Fibonacci ratios being inconsistent.
The most consistent time ratios are based on 5 wave moves !
So if someone uses a 3 wave rally to base their time ratio off of
It will most likely fail . Secondly and this is hard to explain in words .
The other way to use both time and price is to scale your chart
Using graph paper .time and price being equal squares . This is not
Gann but from my very limited understanding of wd Gann he also
Scaled his charts . Old school techniques need to use old school methods
I guess . It’s been a while since I’ve plotted on a paper chart and applied
Fibonacci yet it’s a very valuable way to plot price and time .
My first use of this method was using a clear Fibonacci grid which was overlayed
Over a scaled chart . I forget who used to put out the chart booklets but it’s how I was
Taught back in the early 1990’s. The main thing was the close for trend yet highs or lows
For extremes in price . You always placed the center of the overlay on the close and marked
The dates in different colors ( same thing with price ) you moved the overlay from key date
To key date and since the Fibonacci overlay was scaled to match the chart scale exactly
It would give you both price and time. In essence what this did was it turned price on its side
And projected time .
I’m probably not explaining it very well but I paid money to learn that
And to this day I have never seen anyone else teach anything close to that
Or expand on it . The guy who taught me ? He was a very good day trader yet
Last I heard he had gotten in trouble for reasons I don’t know with the sec.
Fixed scaled charts makes a difference and so does using the close price
Having your chart scale fixed and the overlay matched to the chart scale
Is why it worked. This is why I use excell along with electronic charts .
I have attempted a few Gann angle charts which actually are helpful
When doing them in excel .
Anyways food for thought is all. Like any method we use you need to
Really dig into it and understand it and sometimes it’s just simply wrong
Other times it works for a while then fails .
The most consistent fib ratios for me are based on a 5 wave structure .
Yet I look at time and price using as many methods as possible .
The methods I use have had a decent enough success rate that I include
Them all knowing they won’t all work all the time nor will they all line up
At every turn . But when those rare moments come when they do line up
I pay attention . I keep lots of notes
What I’m in the process of doing over the next year is ‘re grouping and
Taking everything I use and computurising it and with that I’ll refine
As much as I can . This will be an entirely new concept for me yet
I think it’s the right thing to do. I have not yet decided on the software
I’m leaning towards trade station with a bit of skepticism. That said
It’s probably where I’ll end up . Ninja trader I didn’t like after checking it out
And I found their customer service useless . Non existent is a better word .
Multi charts ? Suprisingly I have found little to no complaints. And there is one
Other I forget the name but it’s a consideration .
My budget is 20,000 on this project which includes everything , computers monitors
Software etc… I doubt I’ll use that much but it’s the number I won’t go above
And I am not one to throw money around .
Bottom line : I’m going to ‘re do it all lol
Nice rally today 🙂
A little history on the 3 drives pattern
Note: Robert prechter is named in the article
Yup 3 drives relates to Elliott wave 🙂
https://www.tradingview.com/chart/threedrivespattern/
Bullish Three Drivers Pattern
Always remember that symmetry of both price and time are of extreme importance in this pattern’s formation.
Drives 2 and 3 should be specific extensions of the A and C retracements. The extensions should be 127.2% or 161.8%.
The A and C retracements will typically be either 61.8% or 78.6% of the previous swings. The possible exception is in strongly trending markets. If the market is trending strongly, these retracements may be only 38.2% or 50%.
The times (horizontal distances) of the A and C retracements should be as close to symmetrical as possible. The same is true for the extensions (the second and third drives to the bottom).
It is important to remember that this particular pattern is rare. This means that traders should not try to force the pattern onto the chart. If the formation contains price gaps or it is not symmetrical enough (slight variations are ok), it is best to abandon the formation and move on.
The oex is coming into resistance
This chart was posted in Feb and I can’t update it
Yet it’s a monthly chart with time and price projections
http://imgur.com/9MIZbGc
The next higher level being 1108 if the 1084 level gets
Broken . For the cash Dow 21780 is resistance
And this graph also in need of being updated .
The gray line is based on 80 plus years of historical
Percentage moves . The Dow is actually failing on a percent
Move basis .
Bradley dates yet I don’t think all of them included
In this link
https://bradleysiderograph.com/2017-turn-dates-sp500/
It’s going to be an interesting July 🙂
Out of phone for a few days
Joe
Chart of Dow cycles
http://imgur.com/cL4RYzX
No promises just historical cycles with
Percent moves applied .
Odd cycle in regards to mars Uranus
http://imgur.com/t4Ap9vk
Again in need of updating
Weather this becomes a deep 4 th wave
Or a triangle or something else ?
A few things are lining up
That’s it ….. Let the market prove my
Work right or wrong .
🙂
Price action in market today still clearly corrective which means we are probably very likely going higher. Closing long volatility trade opened yesterday for a small profit but it looking like the bull is alive and well for the time being so picking up a few weekly DIA calls. Left a lot of money on the table on my oil short! Looking for re-entry if no reversal today. 🙂
Interesting. Small island reversal gap in SPX but not DJI. I think NDX also had a small gap down open. Fragmented markets.
Spoke too soon? Backed out of long trades.
Peter, You mentioned “US indices will likely see one more top before heading down in tandem with the US currencies.”
Not saying it is but yesterday a new high was hit and the currency pair I trade looks to be following the SPX and the currency pair looks to be rolling over right now.
Wonder if this is it. Great call, Great post!
Thank you.
Not quite yet. Not today, but very soon.
06/22/2017 PD-3 SPX likely closes positive:)
Anyone else noticing the strange volume divergence between SPX and DJI?
something significant occurred yesterday…it was the first time going back many moons that a PD-3 pivot date did not close positive on the SPX…
The chart show tomorrow should be great!
Eager to especially see where Peter thinks Gold and Oil are in the current decline.
Did I miss something? I thought the US markets were expected to top as the USD bottomed! 🙂
It takes a lot of patience to let commodities trade play out. Their fifth waves can often be even more explosive than the third wave and that is where you trade can literally double overnight. I got out of my oil trade a few hours too early and missed the spike down today but Oh well. You can’t have it all now can you? I expect we should see a near term bounce in oil before the down-trend resumes.
Hi Peter, are you looking for dollar index to go down to 91.9 before considering wave 4 to start to decline?
Thanks
No. I don’t know why you’d think that.
I reviewed the previous 6/4 analysis, you wrote: “I had called the obvious top at ~103.53 and projected the drop to the previous 4th wave low of one lesser degree. I’m projecting that point to also be the top of the US indices.” I wasn’t sure that you mean the wave 3 top or wave 5 top? Since wave 4 is not clear has started to move down, I wasn’t sure that you are thinking to wait for dollar index to drop down to 91.9 as shown in chart in 6/4 analysis before wave 4 to move down or not? However dollar did move up, but it hasn’t touched the 2016 low, and that is about 91.9 mentioned in 6/4 analysis? Per your analysis, it seems we are still having some rooms to move down?
I’m expecting 9.19 in the US dollar to coincide with the top of the 5th wave in the US indices.
Thanks for the clarification.
Where is wave ( 5 ) in regards to the wave ( 4 ) in 1987
This can’t be a 30 year 5th wave , that would be way out of
Proportion to waves 1-3 .
1932 to 1966 was 34 years
If we use the year 1982 and add 34 years you get 2016 so something a miss .
Wave 5 should not be the longest wave , wave 3 should be .
So we have a delema in terms of Elliott wave theory vs random walk .
1932 to 1966 was only a 3 wave structure . The run higher from 1974 or 1982 or
1984 ???? Do not fit
Wave 5 should not be the longest and strongest wave of the 5 wave structure
That Said I believe in Elliott wave theory yet and I know I’ll stir a few feathers
The entire move up from the 1932 lows is best counted as an A B C rally
And not a 5 wave impulse .
If we bottom Wednesday then we will have a 7 trade day bottom to bottom
Count . If this holds true I’ll add 7 trade days and project a high on
June 29. Need to see how the market moves yet that would be
A good piece of added evidence the top is near .
🙂
The EW rule says that wave three cannot be the shortest wave Joe. It does not say that wave five cannot be the longest. In fact you often see blow off fifth waves in commodities that are longer and have more momentum than third waves. Having said that, I agree that there are some very strange looking EW counts out there at Super Cycle degree; very strange indeed!
The guy that really turned me off to time fib relationships was Robert Prechter. He for years was making bombastic claims using them to tell us why the bull market should have ended in 2010, then 2012, then 2014 etc. etc. He was clearly wrong, as wrong could be. The arguments were certainly elegant and had all kind of fancy mathematical formulas suggesting why they were reliable. I concluded the entire thing was nothing but a canard and absolutely useless so far as telling us anything about what the market was likely to do. EWT still show up at the bottom of Hulbert’s Digest when it comes to accuracy in forecasting the market. Absolutely amazing that people still pay them for useless information.
I meant EWI, not EWT…
Another thought is that in an era of central banks desperately trying to hold markets aloft by unprecedented infusion of liquidity, an extended fifth wave is exactly what you would expect. You can go back and look at points where QE was introduced as the market was starting to break down and the correlation is quite clear.
Mcdough;- another HO on tuesday
Yep. And everybody is insisting that there is no deterioration in matket breadth. I really just don”t understand how that could be true with so many new lows. Something really stinks!
BTW Rose, it’s McHugh. 🙂
Verne
You are correct yet… Wave 3 is most often the longest and strongest wave .
Do you remember those wave 3 of 3 a wonder to behold are next ? And Dow
6000 or 1000 calls ?
I’ll say to prechters credit though he is a pretty good market timer .
My issue with him is back when I subcrubed , they never would admit
They were wrong . Hochberg would put an automatic bearish bias into
A forced wave count .
I’m thinking common sense now. Let’s say back in the late 1970’s
Prechter was onto something and it was the big wave 4 ?
Now fast forward to 1987 which prechter got wrong !
He did not forecast the crash in 1987 and he lost a lot
Of subscribers .
I’d say from an open minded point of view the crash
Of 1987 was a wave 2.
1932 to 1987 wave ( 1 )
A bit different thought process that I will research much more in depth .
At one point someone argued the earth was round and not flat .
Additionally ,
We do not look at Microsoft and assume that is Google’s prior history
Before Google existed .
The Dow began in 1896 ? So assuming a Dow back to the 1600-1700’s
Is not going to be accurate . A decent assumption at best .
Here is why I bring this up .
Dow low in 1932 at 41.22
Dow high in 1966 1000
Dow low in 1974 570
The move from 41.22 to 1000 was a multplie of 24.26
41.22 * 24.26=999.99
570 * 24.26 =13,828.20
We are way beyond that in terms of wave equality .
Now on the other hand if I take 24.26 and multiply it by 1.618
I get 39.25 which I then multiply by 570 and I get 22,372.50
This would assume a 5 th wave 1.618 times waves 1 through 3.
I have a hard time accepting that as valid based on common sense
As well as the right look . At best I’d say this has been a massive extended
3rd wave from where I’m not sure
I am just opening up the discussion is all and not claiming this is correct .
Also not arguiing for some super bullish market going forward
Just pointing out that something is off in the large count .
We are still alive having survived the world ending year 2012 by the way .
When I go next is using the 1987 high and low along with the 1932 low
Also if I am going to argue a few points I’ll go one further .
I do understand the 5th wave fear in commodities yet….
Think about it , why do all long term commodity charts show spikes and crashes ?
It begs the question : are they really 5 wave moves or just 1 2 3 (a) 1 2 3 (b) 1 2 3 4 5 (c)
We have more than enough history to begin to question what we have been told as
The gospel.
Keep in mind I am a believer in Elliott wave theory and I do see how it works .
I just can’t accept a faulty wave count and if I was to ask why has prechter been so
Wrong for so long I’d say it’s because the basis of his wave count has been wrong
And he has failed to accept the error and adjust it .
Joe
Quite right about Prechter and company lacking the humility to admit when they are wrong. I felt sorry for Hochberg as I had the feeling that all those forced bearish counts were at Prechter’s directive, who was after all his boss at EWI. About Prechter’s market timing ability, whatever was left of his reputation in that regard he has totally trashed the last five years. I have no idea what their current count is and could care less as I suspect it is again incorrect. I have to agree with you that something does seem a bit off with most of the Super Cycle wave counts I have been seeing but I lack the skill in EWT to pinpoint exactly what it is. For one thing what is commonly labelled as a third wave advance miserably failed to exceed the top of the EW channel with is unusual. Of course we have also had a multi year advance on declining volume which has been another strange occurence. The only think that makes sense to me is that the entire move up from the 2009 low is some kind of corrective wave, probably a b wave of some sort. Hope you are able to figure out what’s actually going on Joe as I have to admit I am a bit in the dark on the bigger picture. 🙂
Bob doesn’t get involved in analysis. He told me so himself. That’s a much positive info as I have on them … 🙂
I check in on them from time to time, but prefer to be “on the other side of the market” from them.
I was always puzzled by why Hochberg was so predictably bearish on practically every single count. It used to drive me nuts! You would think after being so consistently wrong on his bearish calls he would change his approach but year after year he kept calling an imminent top so I assumed he had his marching orders. I also started making money after I traded the exact opposite of his wave counts…no joke!
Had an important overseas call today and missed the chart show! Rats! 🙂
Verne
I’ve questioned the longest term count for years
And it’s only been recently I have been questioning it
More. We never know for sure what the market will do
And having studdied Elliott wave theory in depth and
Becoming prechterized , it wasnt until after breaking away from
Them that have made my own discoveries.
I would guess their present wave count is that this is the 1st wave
Down of a long bear market and that after the wave 2 bounce
We will see a wave 3 of wave 3 of a 3rd wave of a 3rd wave to the downsize
Which will be a ” wonder to behold ”
I did learn a lot from them about Elliott wave theory and Jeffrey Kennedy as well
As Jim Martin’s I respect a lot . Prechter has good insight despite his wrong calls
So I choose not to bash him . Hochberg lol … Terrible wave counts .
Prechter back in the year 2000 called for a massive 4 wave triangle .
We did get the sideways move . Hence he wasn’t completely wrong .
He also made the case for an important low in October 2017 if memory
Serves me correctly .that cycle right or wrong he calculated 16-17 years ago
He also wrote an article on gold back in 2001 at the lows and said it’s time to
Change your mind on gold . He has also been long junk bags of silver from a
Long term perspective for a very very very long time .
Prechter is human after all and despite his terrible calls I still have a fair amount
Of respect for him . The very few emails I’ve had with him gives me the impression
He is a decent person . Many may not agree but I learned a lot because of him
And I think he means well despite being wrong .
In a very long term point of view he will probably be vindicated yet all broken
Clocks are correct twice a day
We have gotten the crap beat out us daily on this run from los Angeles to the Columbia
River . Not the norm and we have managed to be in sync with each storm as we move
Up the coast . A few hours break then back to 35-40 kts . I forgot to bring my kite 🙁
Lord have mercy!
Joe you mean to tell me that they are actually calling another top???!
Say it ain’t so Joe! 🙂
I’ll tell you what, if that is the case I am now happily abandoning any notions I may have had of that being the case. There is no question now in my own mind that we are not there yet, and I am willing to put money on it! 🙂
(I feel really awful for folks following their advice 🙁 )
Hey Joe:
Have you heard anything new about the situation with the Oroville Dam?
I just noticed you said it was just a guess so I stand corrected.
Prechter did correct himself after initially calling the melt down in Februrary of 2016 a beginning crash, then changed to calling it a fourth wave. The best that I can see at this point is that we are in some kind of impulse up from the November lows. Trying to assign meaningful counts to the waves I leave to men better than I! 🙂
Verne
I have no idea of what ewi is forecasting .
It was a guess and I was joking because it’s more the norm
For them .
I am still planning on getting short June 30
And depending on this present decline formation and the following
Bounce / rally I not going to form any longer term conclusions .
The spx still has a support at 2400 and I find my earlier Dow calculation
An interesting price level ( I’m still in the ocean and without enough data )
So I’ll watch the 22372,50 level as well as the 21780 level I noted the other day .
The oex resistance at 1084 looks like it mattered . It’s to soon for me to assume
The minor top is in but my mindset is decidedly bearish .
I’ll start looking for a clean 5 waves down forming now and maybe the June 30
High becomes a lower hugh ?
To soon to call it but risk reward appears to be favored by betting on a decline
( once June 30 comes and pattern and technucals evaluated )
I agree Joe that the R/R now definitely favors a decline. I note with interest the gap up from Monday’s open was close today. Granted it was a torturous close but a close nonetheless. I was really expecting a turn at this degree to be more decisive and dramatic but Peter did make an interesting point about trying to turn the Titanic. The next major Bradley turn date is not until Jan 2018 so we could be in for few interesting weeks…or months….
Verne
I don’t know anything about the orvillve dam
I live in southern Oregon and I do from time to time
Look up what’s going on but I have no relevant info
On that dam. This odd weather this past week I find
Strange . Add that to the mix lol
Nap time for me
I watch the oex as well as the Dow and spx
And I look at the nya as well as the transports
And several individual stocks .
The old rules of thumb were simple spx 10 points equals
Dow 100 points does not apply anymore which bothers me.
Hard to say if money is long the Dow while short the spx
The oex is the sp 100, Dow being 30 stocks . Narrowing breadth
And the turning of the titantic should bring with it narrowing
Leadership . Transports tend to lead . I prefer to group the indexes
And look at the whole rather than focus on just 1 .
Look at the oex today , very slight out performance of oex vs
Spx . Makes me wonder which stocks are being purchased
And their weightings . Then you have the ndx which closed
Up on the day . No opinions at this point from me yet
Money appears to be very short sighted .
The indices are total chaos. After a massive breakdown a few Fridays ago, NDX has been strongest the last few days. Futures are up over 1% but DJI and SPX in the red. I mostly stay away from the manipulated indices as there are much better trades available in specific stocks and sectors-Oil, Retail, Gold, Automotive…
Yea, but there’s no challenge in that. Anyone can short Oil at 51.90 when it fails to break higher than 78.6% retrace and ride it down for $10.
There’s a huge sense of pride with buying out of the money SPY puts or calls less than a week away from expiration and nailing it.
But you are right. The more profitable trades have been in Gold & Oil.
Well Mike. I don’t know how frequently you are buying out of the money puts. If that is the core of your tradng style I know enough about options to know you are probably loosing money. I did trade the diamonds today and I did it with bearish call spreads. Of course it is possible that you are more capable than 90% of the folk buying out of the money options, or that you have access to inside info… 🙂
Not very frequently. Lose more trades than win, but the gains are bigger than loses. IE — A $200 loss 8 out of 10 times is $1600 down the drain, but the 2 wins are usually at least 500% gains.
I will be looking at QQQ and SPY puts at open tomorrow. A bigger percentage of them 2 months out, and a few lottery tickets for Friday. Already bought DJX July a few days ago.
That formula works if you keep losses small and let winners play out. Few people realize that you can actually grow your account with more losses than wins so good for you to have found a strategy that actually works. I make the banksters pay me for every trade I enter via credit spreads. What I like about spreads is you can join the directional momentum when the spread is working, or re-direct the trade by closing one leg if the trade moves against you. The breakdown in junk bonds today and closing of Monday’s gap means I will be seriously shorting any further bounces in this market. A break of SPX 2400 on high volume and I am loading the canons.
Congrats to you for the discipline. Selling premium and doing spreads certainly are the most consistent ways to make money in the options market. I’ve done it once or twice — IE — You know the S&P is not going to hit a certain level, so sell one strike higher to collect & have them expire worthless.
Verne, question regarding your comment about re-directing a directional credit spread by closing one leg if the trade moves against you.
In such cases do you then re-sell the leg you closed but in the direction that now fits? i.e. say market going up through your bear call spread do you buy back your short call and sell a new call above your same long strike? so now you have a bull call spread?
So far it is looking like the Bradley turn date of Tuesday was right on the money. You are right about possible Friday lottery tickets. Puts expiring this week-end will be like shooting fish in a barrel if the market turns down. 🙂
Whitemare: Typically I simply close the short leg of the spread and hold the long side of the spread if there is strong move higher with a bearish call spread; same idea with a bullish put spread. The trick is to know when you are being whpsawed by market makers or you actually are wrong about the trend.
Anyone seen Andre ?….sure could use his guidance and sensibility right about now…
No one does it quite like he does…
Peter T, would you entertain the idea of this being a possible ending diagonal on this 5th wave of 3 before heading down on 4W?
Dan,
What asset?
Sorry about that, the SPX.
As long as SPX is trading above 2400, I am assuming the trend remains up.
Dan,
No, it doesn’t work. The entire wave up is corrective and the final sequence up is an abc. Trying to get an ending diagonal (and I’ve tried everything) doesn’t work as either the 4th isn’t in the area of the first, or the wave lengths don’t conform. The waves up have to get progressively smaller, and they don’t.
Ok, Thank you. What do you think is taking place at the moment, if you don’t mind sharing?
from 2416, there are 4 overlapping waves, that’s why i asked.
Hi Tom,
I like your real-time energy stream. It looks that they predicted very well.
Can I know are they tide wave graph or what is it based on? or historical repeated pattern based on astrology? or correlation pattern based on yearly data?
yes the chart today was spot on
to answer your question
I am not involved with tide waves
https://s7.postimg.org/rzm6f09t7/june_21_energy_chart.gif
Peter
Not sure if what’s going on here in the Pacific ocean relates
To the sunspot cycle or global cooling yet.
This past week has been more of a winter storm than
A summer one.
Part of this is just bad timing but…
The systems have lined up one after another
And we have timed them perfectly .
1.4 kts average over a 2 hour period and probably
3 kts or just under for 24 hours .
And the latest forecast ? Gusts to 50 lol
Steady 35 at the moment .
I have not seen a spring/summer storm line up like this
Ever !!!!
Only 13 years sea time on the coast , the rest in Alaska
Be glad your not at sea out here 🙂
Thus crap refuses to let up .
172 nm to go of pure hell
Thankfully the job pays well
Remakable abscence of news qbout what is happening in the Pacific Ocean after Fukushima. There is a complete news blqckout on the radionuclides showing up on the West Coast.
We’re on a 500 year cusp. It’s like spring or fall X 10. Extreme weather. Usually it lasts for about 25 years. 1998 should have been the start. That’s why you’re seeing all the extreme weather all over the world, but mostly in the belt closest to the Sun.
I’m glad I’m not there. I like sailing in places like the BVIs with lots of islands. No likey ocean storms. I can’t imagine what you’re going through.
BVI is my hometown, the beautiful island of Tortola. 🙂
My thoughts exactly
I haven’t done the same research as you in regards to weather
And this cooling cycle but it doesn’t suprise me that it’s related .
I’ll need to update my sunspot data when I get home .
The corellation to the Dalton minimum has been way to close
For me to ignore . If this is just a taste of what’s coming this winter
It’s going to be ugly . We are towing 2 empty cargo barges so they
Do hold the stern down and calm the ride fairly well .
127 ft tug by 34 ft wide . It can handle this , it’s just a miserable slow
Ride .we have a stationary high pressure system to the west and a stationary
Low pressure to the east and were between them.
Almost my bedtime
Thought I’d give you a little live info though since you have the interest
In this ” climate change ” cycle .
Another HO generated wednesday
I have been reading about the persecution of the market forecaster Martin Armstrong and it is a very strange case indeed. Did anyone know that the banksters were insisting that the turn over the source code for his market timing model even though it had nothing to do with what he was charged with? His 8.6 year cycle withing the larger within the larger 51.6 year cycle comes due this Fall. He has an uncanny record for accuracy with his calls. They must be really afraid of him to have kept him locked up for so long without a trial. I think Peter T knows more about this than most of us.
Verne, re-posting question regarding your earlier comment about re-directing a directional credit spread by closing one leg if the trade moves against you.
In such cases do you then re-sell the leg you closed but in the direction that now fits? i.e. say market going up through your bear call spread do you buy back your short call and sell a new call above your same long strike? so now you have a bull call spread?
Hi whitemare; I guess you missed it but I responded two posts down from your original query.
thanks!
Yeah, I heard the entire story in detail when I was exec director at the Foundation for the Study of Cycles. And I’m sure I’ve read about it somewhere online, as well. They kept him locked up for seven years. Never charged. I’m sure that’s why he eventually left the US.
Definitely watch The Forecaster. At one time, he had it available for rent on his website, not sure if it’s still there or available elsewhere.
Larry Eddleson who was in the movie recently passed away. I guess Larry wanted to temporarily take over Armstrong’s company during his legal problems but the banksters demanded his source code and threatened to fire everyone in the company if he did not hand it over. Does anyone know if Martin actually gave them the code for his timing cycles?
No, he didn’t. That much I know.
Peter you must know Dr Martin Weiss. I think he bought the outfit you were at.
If you mean the Foundation, no, it’s still going off-shore. But the name seems to ring a bell.
PALS into July 4th:
Phase: bullish next 8 days
Distance: bullish next 6 days
Declination: bullish next 14 days
Seasonals: bearish until Friday, bullish after that into July
Summary: Fully invested in stock market as of Thursday mid day using ETF.
Verne
Martin Armstrong was never actually charged from what I understand anyways .
They held him in contempt
Fake news
State department’s ‘re opens Hillary Clinton’s case and stocks rally on the news 🙂
I think he eventually pled guilty to one charge but yes, it was eleven years for the contempt issue.
Three of Hillary’s stooges are still in very influential positions at the State Department and until and unless Tillerson shows them the door they are going to stonewall any investigation into her criminal activity. It blows my mind that those people are still around! Tillerson cannot possibly be that clue-less. There has got be something else going on over there.
I think you might be right – something like contempt of court or something like that rings a bell …
I heard some new fib projections for the indices today that contend that all is well with very healthy market breadth, and DJI 25,000.00 and SPX 3000.00 are likely round number targets. Bullish sentiment abounds it would seem! That would be quite some blow-off top!
It must have been another cycles think tank that he bought a few years back. The name sounded very similar. In fact I think Larry Eddleson and a few others were also involved with the new group formed by Dr Weiss, which he was called Weiss Research.
Will this crazy market ever turn??? I am starting to fall asleep waiting for an interim top! 🙂
Some of the recent arguments I have heard for expecting some longevity (at least months) in the current bull market is that bear markets are always presaged by several months of price and breadth divergence and so far we have seen no signs of the same. I am not sure how this squares with the numerous HOs we have notched but let us say for the sake of argument that is true. Even if we get a substantial correction with some breadth deterioration, would that not be reversed if we actually get a blow off top? I imagine by its very definition a blow-off top would see a broad market advance which would also necessarily contradict the market price and breadth divergence scenario so many are arguing must be seen prior to a bull market top. Any thoughts? I am frankly am a bit puzzled by the apparent contradiction. A blow off top implies the market will terminate with strength, not weakness, so which scenario is historically accurate?
I think the monthly futures chart looks interesting
When look from the year 2004 to date .
Historical Florida freezes have surrounded Dec 12th
The seasonal bias is up into early Dec and the seasonal
Low I’ll need to find my notes .
If global cooling is real ( I think so )
Orange juice is showing a very large triangle
It’s worth further research
Orange juice futures not for the faint of heart
No trading advice just an interesting narrowing wedge
That is 13 years old approximately .
To soon to go long but not to soon to do some research
Verne
I have followed Armstrong for a long time
He put out newsletters while in prison and at times
You could feel his anger in his writings , he still posts
Articles about his case from time to time and backs it up
With copies of court documents . Lots you can find online
About his case yet it has been put out a little at a time .
The forecaster movie can be found online . I watched it on
Netflix. From what I understand there is a new movie in the works
As well. Armstrong’s guilty plea ? Part true part false . I don’t remember
The details but it was a deal cut and I think it had to do with the fact
They cut off his mother’s social security checks unless he would plea.
You read that right. The gov stopped paying his mother her social security checks
At one point . He has posted some details to his model yet says that he is not
Ready to give it all out yet. That said you can find the basics online.
You can read his blog and dig through old articles , some interesting history
Can be found .
Anyways from what I understand he is in Florida .
As for the stock market I still think we are at a cycle high .
Not going to change my mind on the June 30 date at this point .
Can’t wait to be home and put it all together and see if the technicals
Will back up the timing .
Rough fibinaccii
Nov Dec Jan Feb March April may June equals 8 full months
I don’t remember the wave 2 date , Jan Feb March April may June though
Is 6 months , .382 * 6 = 2.29 months
3.056 is .382 of 8 months
So 2 to 3 months of sideways trend ? Or bearish I’m guessing .
. 236 of the year was March 27
.382 of the year was may 19
.50 is July 1,
.618 ( my least favorite timeline ) is .618*365 =day 225
Which is August 13th
There is a Bradley turn date August 19 th
That timeframe I am questioning ( not sure it’s a high or low at this point )
There used to be an old addage about mid August being a high .
It’s something I have forgotten .
July 20 though is end of quarter plus 20 days and it’s 30 days before the solar eclipse .
That’s just a rough draft on dates . No solid opinion on highs or lows .
June 30 is where my cycles start turning down so I have to keep a bearish bias
Until I’m proven wrong .
It doesn’t all line up though , the wave count is not complete
My gut says a possible July 20 low and also an Aug or Sept
Important turn. October though is the big picture ideal high .
Bottom line : things should get volitile
I’m lacking data to make my bearish case .
Wave A B C should have a ratio of A being 1 and C being 2.2 to 3.2 times A.
If it’s going to be a steep decline . If it’s going to be a triangle then just
A lot of sloppy choppy 3 wave overlapping moves which could last
2 to 3 months .
We should find out soon .
Shorting retail may be advantageous because brick and mortar are
Losing out to online sales .
Some individual stocks should get hammered
That’s my thoughts anyways
Thanks Joe. I will try to find the movie on Netflx if it is still available.
The Armstrong case, as well as the case involving Irwin Schiff amply demonstrates that the US Government is run by a cabal of men of extreme evil. Sadly for most Americans, they have no idea of the depth of depravity of their own leaders, and I suspect if they truly knew they would not abide it. I could be mistaken on that score. When I look at the average American today it is clear that we are not the same nation we were two generations ago. Granted the onslaught against the population has been horrific, both environmental, nutrtitional, medicinal, pyscho-social, and a few other ways I am not going to mention, which has produced the doltish thinking and behaviour that seems to common these days. de tocqueville was so right when he said that structures of freedom were insufficent to maintain liberty, and that only a virtuous people could remain free. I had better leave this topic alone…it depresses me too much…. 🙁
One thesis I have been considering is that when a market continues for as long as we have without meaningful corrections along the way, which after all are part and parcel of a healthy market advance, what eventually happens is that the market does not correct, it simply collapses. I don’t have any hard statistical data to support that view but if you take a look at chart of some of the major indices, there are periods of persistent advances on next to no volume whatsoever. Those areas represent air pockets. It is no wonder the banksters feel compelled to frantically buy every little market decline and immediately arrest any down turn as they have been doing for many months now. I think when the market finally does turn down, it is going to be a runaway train, as it will be be doing so in the fact of strenuous attempts to forestall its doing so.
Worth reading
https://www.armstrongeconomics.com/world-news/climate/the-plight-of-junk-science-in-all-fields/
Good article. I guess the key is always follow the money and the global warming scam has garnered some tens of millons. I often wonder if Al Gore really believes the hogwash or is really that devious. The fact that he early positioned himself to make millions from a carbon credits exchange makes me think the latter.
This website is for educational purposes relating to Elliott Wave, natural cycles, and the Quantum Revolution (Great Awakening). I welcome questions or comments about any of these subjects. Due to a heavy schedule, I may not have the time to answer questions that relate to my area of expertise.
I reserve the right to remove any comment that is deemed negative, is unhelpful, or off-topic. Such comments may be removed.
Want to comment? You need to be logged in to comment. You can register here.