
 |
Interview Playback: |
Elliott Waves and Probability
Elliott waves are price cycles. The work by Ralph Nelson Elliott in the 1930s-50s identified a wave structure for the stock market the was heavily based on the fibonacci sequence, although his work most concentrated on the structure and, more specifically, market patterns.
The short of it is that the markets (currencies, stocks, futures, et al) move in a very predictable manner and are not affected to any great degree by events. Markets move based on the collective mood of the “herd” around the world who invest, or trade in them.
Expanding on that thought, you have to keep in mind that the direction of the market on a grand scale is determined by market participants on a worldwide basis. Many a time I wince at the suggestion that the market has had a major reaction to an event in any one country, while it’s rather obvious that the event in question has little significance beyond the borders of that country, or even within that country’s borders.
There are other times when I chuckle as the pundits one day align a market move with a major event, while the next day scramble to explain why the market has completely retraced that move on the following “no-news day.” Events simply have little, if anything, to do with the movement of the market.
On the other hand, what is very clear is that the market moves in identifiable patterns that correspond to specific fibonacci ratio measurements. In my time in the markets (over 20k hours), I have yet to find a wave sequence that did not have a fibonacci relationship with a larger pattern relating to the golden mean (1.618 or .618) or its reciprocal of .382. Fibonacci measurements are critical in determining the lengths of waves, and therefore the next turn in the opposite direction.
Fibonacci ratios run all through the markets. They’re found all through nature, as well. And of course, they originate with the planets in our solar system. The ratio of the distance between the planets in our solar system averages out to 1.618.
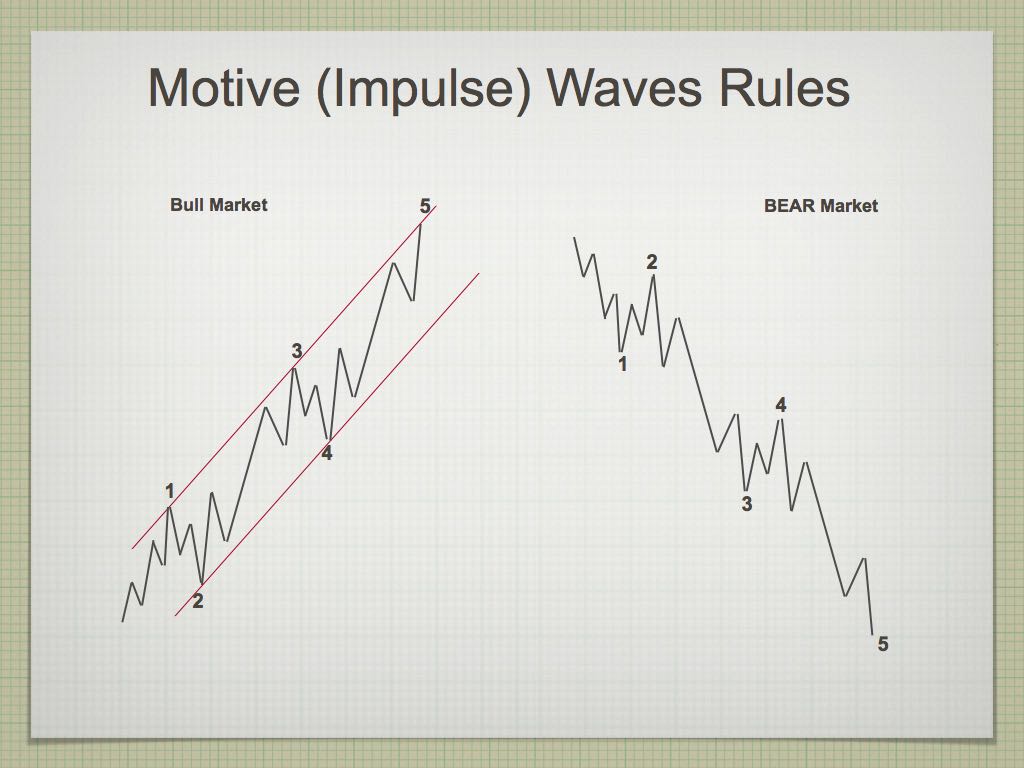 For those who are new to Elliott waves, what Mr. Elliott discovered way back in the ’30s, is that a market trend moves in 5 waves, a countertrend in three waves.
If you look at the chart on the left (click to expand), it shows a wave pattern on the left that’s a bull market trend. You can see that the first wave up moves in 5 “trending” subwaves (not numbered). The second wave then retraces in 3 waves (a countertrend move) 62% of the distance of travel of the first wave.
The third wave follows and it will typically rise 1.618 times (the golden mean) the distance of the first wave. At the top of that third wave, a countertrend wave will develop (a fourth wave) that will retrace 38% of the combined distance of waves 1, 2, and 3. Finally a fifth wave will trace out a length of 1.618 times the length of the original first wave.
Elliott wave impulsive sequences are fractal, and so what happens next is that the market will then retrace 62% of the entire distance of that combined sequence (which now becomes the first wave of a larger impulsive sequence). The wave that retraces 62% now becomes the second wave, and a new larger sequence develops that will rise to a “higher degree,” but with the same fibonacci relationships as that of all the waves within that first wave up. This pattern regenerates again and again until it has developed a full 5 waves as this higher degree.
The key to being able to predict the market is knowing where you are in either a trend or countertrend pattern. Knowing where you are (what pattern you’re in) produces a high probability trade, because these sequences and patterns happen over and over again within the larger market—in fact, throughout all markets. It doesn’t matter if it’s bonds, currencies, futures, commodities or what-have-you. The market moves in the same manner worldwide, every single day of the year.
A motive (impulsive), trending sequence has one basic form. It’s a five wave move and conforms to a specific set of rules that cannot be broken. If any of these rules are broken, the resulting sequence must be re-classified as a corrective (countertrend wave). These corrective waves have far fewer rules and there are many more corrective patterns than there are motive patterns. They are therefore, more difficult to predict. The secret to success is being able to identify a pattern early on, and trade them as the pattern continues to unfold and risk gradually reduces.
It’s the identification of these patterns that’s the key to unlocking the power of the Elliott wave sequence. If you spend the time the learn the system, which requires a knack for pattern recognition, the secrets of the market will morph before your eyes into a very readable map and lead to a very lucrative future.
Elliott wave price cycles work very well with time cycles, although I have found time cycles to be far less accurate and predictive. However, using time cycles to support EW price cycles gives you a much higher ability to predict and time any market. It reduces risk and heightens confidence.
Here’s a very recent interview with Bob Prechter, in which he reiterates his prediction of the trajectory for the not too distant future. Good reading if you’re interested in Elliott wave or the movement of the market.
Until you buy into this concept that the market moves in a very predictable manner based on the mood of the herd, you’ll never have a chance of beating the casino, because you’re playing against it. Period.
Tops in your field DZ 2
Tops in your field …You are tops in your field. Tried to follow Elliot Wave international for years. They were always behind the market. After discovering you, I perceive that you are an expert in reading the waves, which puts you way ahead of the rest of your peers. And you can read the Waves like you are reading tomorrow’s financial section. I pray you stay healthy. —DZ |
Rise above the rest … SM 2
Rise above the rest …I have only ever met a few people who, in their chosen fields (astrology, medicine, music, martial arts, technical analysis), rise above all the rest and you are one of them…you have ‘the gift’…and that’s why I’m a Trader’s Gold member. —SM |
Couldn’t be happier … KK 2
Couldn’t be happier …The analysis and insight you provide is simply amazing! I’ve been trading the futures and equity markets for well over thirty years and usually average around 5% monthly. Since joining your Traders Gold Service two months ago, that number has better than doubled. I couldn’t be happier.—KK |
The best of them JL 2
The best of them …Last couple of years, I subscribed to several ‘market traders’. You are by far the best of them and the personal contact is awesome. Daily and daily updates are very well written! Besides your expertise in EW, I also like your cycles analysis. Best investment I ever made! —JL |
the real deal SM 2
The real deal …‘Educational, insightful and thorough market analysis for all levels of traders. It’s Elliott Wave at its best….Peter Temple is the real deal’ —SM |
A true expert in Elliott Wave FL 2
A true expert in Elliott Wave …You are a true expert in EW analysis. What you provide is not available anywhere and is priceless. Subscription on your services is the best thing I have ever done. Many thanks for your effort to make me a better investor. I now have more trust in my investment decisions. I hope you will continue the excellent work! —FL |
Have not had a losing week RW 2
Have not had a losing week …I have been with Peter almost a year. The only thing that matters is have I made money with his service. I think I have finally turned the corner using Peter’s EW. I have not had a losing week in the last 5 months. Thanks Peter, for your amazing amount of hard work. —RW |
Get an upper hand … JC 2
Get an upper hand in trading …Seeing all the different currency pairs and the wave structures and hearing you explain why this has to do that on a nightly bases gives one a upper hand when trading. Elliott Wave applies to all stock and indices and can be applied to any candlestick chart. If someone ask what you want for Christmas – Tell them a membership to Peter’s “Traders Gold!”—JC |
The Market This Week
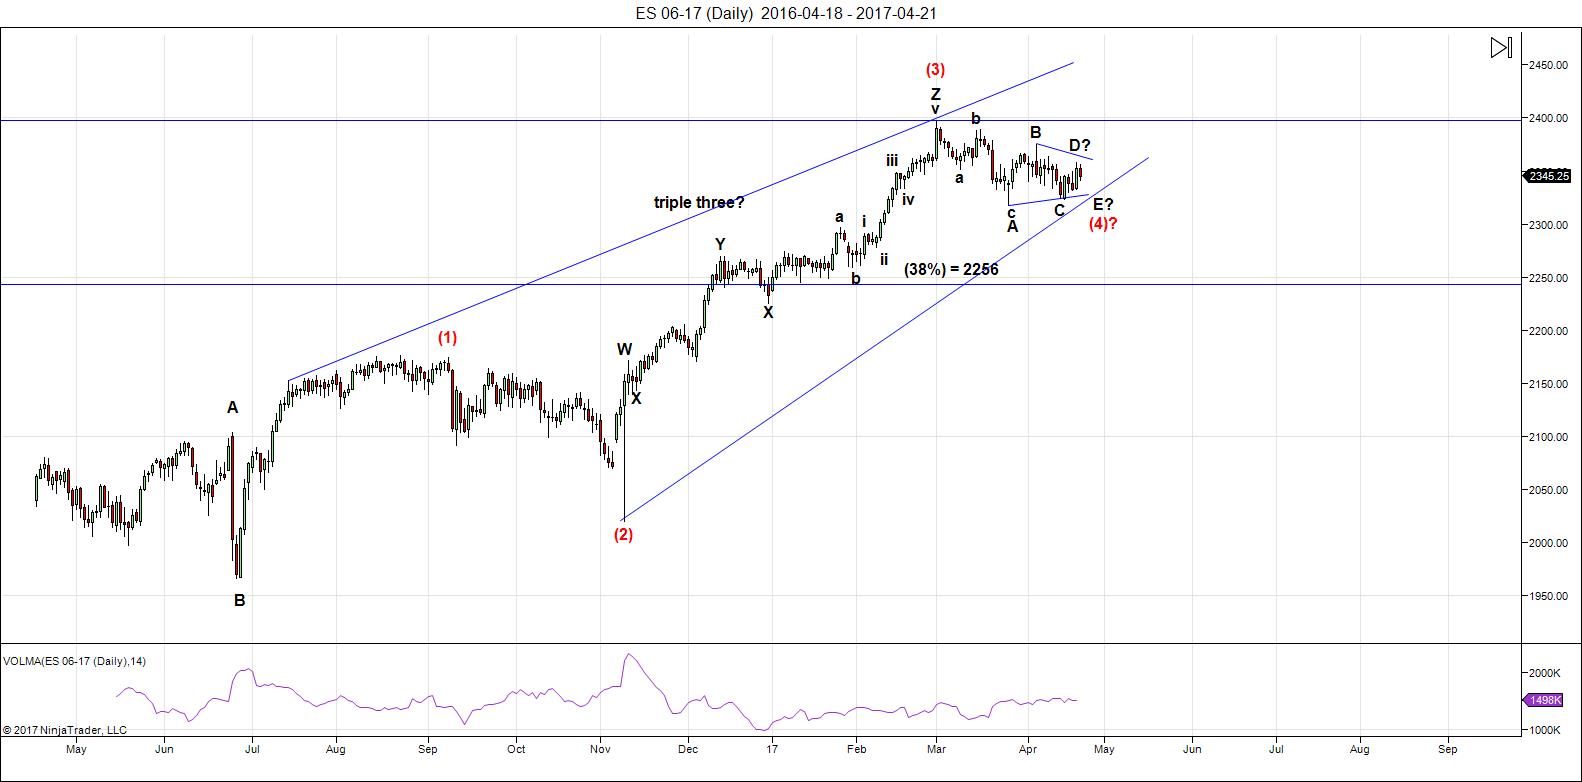
Above is the daily chart of ES (click to enlarge).
We appear to be in the second pattern of an ABC 4th wave correction. The second pattern is almost certainly tracing out a triangle. A triangle is always a final pattern in a combination sequence. If this is the case, I don't expect a wave below the previous low of about 2316.
As I describe above, technically a triangle is not confirmed until the D wave is in place. However, it's been a high probability prediction of mine from rather early on in its formation. An E wave down will follow the D wave.
I predicted the triangle very early on, because of the knowledge of Elliott wave patterns. Once we'd traced out a flat down (the first pattern in this fourth wave), the options (after a subsequent three wave move up) reduced to either a zigzag or a triangle. Once the zigzag option was eliminated, the triangle became the much higher probability pattern.
After completing the current fourth wave, we'll have one more wave to go, which could be an ending diagonal as a fifth wave. The long awaited bear market is getting closer.
_____________________________
Sign up for: The Chart Show
Thursday, April 27 at 2:00 pm EST (US market time)

The Chart Show is a one hour webinar in which Peter Temple provides the Elliott Wave analysis in real time for the US market, gold, silver, oil, major USD currency pairs, and more. You won't find a more accurate or comprehensive market prediction anywhere for this price.
Get caught up on the market from an Elliott Wave perspective. You’ll also get Andy Pancholi cycle turn dates for the balance of the current month. There’ll be a Q&A session during and at the end of the webinar and the possibility (depending on time) of taking requests.
All registrants will receive the video playback of the webinar, so even if you miss it, you’ll be sent the full video replay within about an hour of its conclusion. For more information and to sign up, click here.


Welcome! minute W3 to the downside 🙂
How are we doing this week?
today is another inverted day
typically see one inverted day in a one week period
https://s23.postimg.org/pmygvd8dn/April_24_to_28_energy_stream_update.gif
One of my alternate daily streams showed that dip today long before it happened
https://s9.postimg.org/u4v2rrzfj/APRIL_26_WEDNESDAY_stream.gif
oex has not gone above its march 15th high .
something is wrong , i dont know what it is but ….
i covered , ill look at it later .
Thanks all for your insights! The midpoint of Mercury retrograde, 4/21 (OpEx), coincided with the last date of Venus and Saturn stationary and square and was very close to a bottom indeed. It still appears that the markets may see a high near the end of Mercury retrograde, 5/3. André says 5/5 high so I am trying hard not going short too early. They say Sell in May and it’s not May yet 😉
PALS:
Phase: bullish balance of week (post New Moon, Full 2 weeks away)
Distance: bullish balance of week (perigee Thursday)
Declination: bullish balance of week (Equator crossed, now on to North)
Seasonals: bullish balance of week (end of month usually bullish)
Planetary: post Mercury Inferior, no planetary issues
Summary: bought US market today (Wednesday).
Thanks Valley. Nice to see you being bullish.
Turned out to be a decent day afterall .
something still seems wrong though .
not holding short overnight yet did catch
a decent part of this move .
we had a 3 bar or it will become a 5 bar reversal pattern on the dow mini
4 hour chart . if its a 3 bar then it extends lower if its a 5 bar
we see another up back near 20967 on the dow mini and then back to the downside . should be an interesting overnight session
WOW!
Well for all you bulls that hold over night I hope I am wrong.
I am liquid at the end of each day so it does not matter to me but.. WOW, Really!
Does anyone look at a SPX 4 hour chart? If you do and understand a “Tweaster Top” how could you even consider being long right now? Also day 3? The pro buy day 1, add day 2 then sell day 3. Which is very clear on the 4 hour chart.
If your have EXT open the SPY 4 hour and look and the massive engulfing candle happening right now..
Any who..
Dow Theory paying out..
What does DT say “You make a high – drop – then try to make a new high and fail.. etc……. Today we failed just under SPX 2400. That is the top until proven wrong..
That’s my story and I am sticking to it!!
Well at least until SPX 2401 🙂
For all of you folks staring like me at a bunch of scented candles on Google (“Tweaster Top Candles”), I think she means Tweezer 😀
I need a top jody, I’m exhausted…please promise this is THE top… 😉
Yes Tweezer Top 🙂
And I a dude..
? a dude? and now you tell me?
Haha!
So I am taking that you have never heard of the Tweezer Top before today?
The only reason I share things on here is to hopefully help some folks..
I scalp and trade Forex so I am not in the market for that long..
Sounds like you have a short of some sort that you have been holding for awhile.
Like i have been saying for awhile I think the top is in, I think we have a W1 down and now a W2 up complete and our next short term target is just below 2084 for W3 (minute wave). mid May to complete.
Good luck..
https://invst.ly/3tx-5
RUT end of day update, wave 3 extended to 3.618 times wave 1.
we only have 4 and 5 – and that’s it folks…depending on how deep wave 4 goes, wave 5 should = wave 1, since 3 was extended……
BE WARNED!https://invst.ly/3ty52
You said we will truncate!! Truncate now please, I have no energy left!!!!! 😉 darn this market…
alex,
you are correct – i DID say we would “truncate”, full knowing that we can truncate, and fall short of overthrowing the broadening pattern, or we have an overthrow…. I was WRONG [cough…cough] to have made that statement. Below is a draft from my lawyers concerning this matter!
“I was chewing on a ‘merry mint’ on the statement date of concern, and in my full enjoyment from this miraculous mint, i became momentariy “hypnotized” and somewhat “drugged” – some may say “delusional”from the sugar rush………..it was under this particular “delusional” state of mind that i made the comments concerning ‘truncation’…….I was wrong to have chewed this mint,, and now I will move to put this “MINT” matter behind me…. THANK YOU”……….. [this is called the merry mint defense]
alex, options left on the RUT table – #1 we fall short of the upper trend line for the broadening pattern, OR we overthrow……. either way, we are so close you can taste the napalm in the air!!! look for yourself… a morning update
https://invst.ly/3u3q0
Iuri don’t worry, you were by far the most marginally wrong in the last 3 months, when I’ve seen completely sane EW analysts go nuts (not to name anyone, Neel [cough…cough] y)
I think Peter can confirm this interpretation is very complex. You seem to have caught the 99% of it at this time. I hope you’re right on how it ends 🙂 I’M WARNED!!
Am I the only one seeing all these charts with price well above upper B bands as well as candles either printing dojis or sporting long upper wicks? Is it just me??!! 😀
Naaah! Can’t be!
Jody,
In your last post above you say….you are expecting 2084 by mid-May! Did you type that correctly?
Ed,
Yes I am expecting all hell to break loose.
This should be W3 and I am looking for a 3.618 of W1 so it puts us in that area so I figure that is the pivot SPX will target..
SPX @ 2401 or above though – I am wrong..
I think Jody is on to something. This unusual break from an incomplete symmetrical triangle stinks to high heaven and has all the earmarks of a false break-out imho. That long upper wick is anything but bullish. Transports are tanking. I know truncated E waves often accompany news event, in this case the French election, but I still smell a rat. We should know soon. Price should at least return to test the top line of the triangle before heading up if the breakout is real. A sustained rally from these VIX levels also seems dubious to moi. McClelland Oscillator saying a big move ahead. I think it could surprise a lot of folk. I remain bearish short to mid term.
Peter,
Wondering where do you stand with this move, so triangle is out of picture , wave 4 low is not sure. I think it if we are starting a wave 5 then low was already in few days back when we touched 2340 area.
I think there’s only one answer. I’ll be going through it in the chart show tomorrow. 🙂
Jody
Enlighten us
What is a tweaster top ?
Ive seen a top in twitter
I’ve played twister
I’ve seen a twister
I’ve heard of twisted sister
Yet I have no idea what a tweaster is
Please explain
Verne
I’m sure your not the only one .
I’ll admit though I’m no expert on candles and I don’t
Use Bollinger bands .
Ed
You asked me a few days ago what I saw wave wise .
Today there is really only 2 counts and I’m in favor
Of the flat , the Spx today failed yet that’s not to say
Tomortiw it goes to new highs , I’m not that bearish
I’m just going to look for a new low below the March lows
.I can make a somewhat valid claim for a triangle still developing
Yet if so I’d still favor a fairly deep retrace , say .786,-.886,
Measured from the March low to the recent high .
The move I’d expect woukd be an ABC down , choppy sloppy
If its going to be a triangle .
If it’s a flat then next week should be a fairly strong impulsive
Feeling decline .
Overall todays market action felt strong to me though
The high in the morning came almost exactly 2 hours from the
Open yet afterwords a drop and chop chop . A typical true sell off
Does not mess around giving people time to get out .
The advance decline held steady for the most part all day .
I’m bearish yet that is a short term thought process only .
Andre
Good luck 🙂
Appreciate your posts
May 11-13 th for me yet overall we are looking
At the same may 18 low ( it’s all good )
Joe, this is an example of a tweezer top or bottom. https://www.google.com/imgres?imgurl=http%3A%2F%2Fv2.mysmartfx.com%2Fmain-wp%2Fassets%2FTweezer.png&imgrefurl=http%3A%2F%2Fwww.mysmartfx.com%2Fen%2Fintermediate-2%2Fcandlestick-pattern%2F&docid=-KC_c62Jyj0hZM&tbnid=pFEEj_-JBOlavM%3A&vet=10ahUKEwiYutHzrcPTAhWFLmMKHepQDg4QMwg1KBAwEA..i&w=504&h=294&bih=701&biw=1391&q=tweezer%20top%20bottom&ved=0ahUKEwiYutHzrcPTAhWFLmMKHepQDg4QMwg1KBAwEA&iact=mrc&uact=8
I hope the link works or just google it. IYT already suggest a swing high 4/25.
Sorry, Liz, this got “held up” by technology, probably because of all the stuff in it. Just caught it.
Peter, I’m sorry I didn’t notice the link’s extremely long string of text until I clicked the submit button. 🙁
No problem from my end. It’s a spam thing and must have broken my spam plugin’s rules.
I think it’s another word for a wedge.
http://www.onlinetradingconcepts.com/TechnicalAnalysis/Candlesticks/TweezerTopBottom.html
Works on all timeframes.
can this be an extended wave 5 or wave 3 ?
can this be an extended wave 5 of wave 3 i mean to say
I just saw your video on navigating the coming crash posted months ago. since minimum length of p5 would be p1 =p5 and that would be 2350 or 2500 depending on the length of p1 you consider
why then did u consider the ending diagonal? A 90% crash seems impossible. wave 5 can extend and we may be in 1 of 5. so after a pull back to 1800 we may extend higher. since a probability is involved, what are the chances of 90% crash? is going back to wave4 of lesser degree a guideline or a rule? can it be replaced by time correction?
Amit,
A fourth wave almost always goes to the area of the previous fourth, but it’s a guideline. In terms of the drop, I refer you to 1929 and 1937. Then there’s 1837 and the multiple depressions in the 1800s (1857, 1897. etc). For your other questions, I refer you to “The Elliott Wave Principle,” which is listed my recommended books list.
I should probably do an update on that webinar.
Have you come across instances where forth wave has not gone into the area of previous forth in your long association with the markets?
Nope, not in a trending market, which is what the 500 year set of waves up is. Corrective is another matter.
peter
i borrowed your comment
Well, it’s probably not the best example. But in this case, it’s a wave down in 3, a wave up in 3 and then a big wave down in 5 waves. We had that pattern from the top of the third wave. This might be the same thing again.
I agree with that comment yet id like to go further on a few things
a running triangle ? still a possible . a contracting triangle ? doubtful
a combination ? A B C and the recent highs as wave X ? still possible
and the reason for this ? the market is still somewhat oversold despite
the recent rally . a further rise up into month end ? close only chart
on overall market would be a 5 wave move ( a 5 wave move not meaning
a true impulse ), i cant rule this out as a 5th wave ( monthly close only )
This shows up on the monthly Dow close only as well .id need to see
april close below the January close at 20812.24 to negate this .
thinking a few things through is all and i was remembering your prior
‘post and wanted to re read it
joe
im beginning to see many Fibonacci time counts
that are all coming together .
its difficult to run the entire progression yet ill get to it .
weekly chart would point towards week of sept 25th and oct 1st
for starters .
daily chart observations ( trade days )
the low on nov 4th plus 55 trade days jan 26th high
plus 55 was april 17 low ( one trade day off of april 13th low )
Yesterday was 8 trade days up from the april 13th low
yet today is 8 trade days up from the april 17th date ,
Next week is 21 weeks before the week of sept 25th date .
the week of June 26th is 13 weeks before the sept 25th date
( i have a June 30th high date i have been calling for )
week of jan 18th 2016 to week of sept 25 2017 is 88 week
going into week of oct 2 you get 89 weeks.
This is going to become very interesting going forward .
this is all using the cash spx
further
march 27th plus 13 trade days low plus 13 trade days = april 13th
plus 13 trade days = wednesday next week, May 3rd again
adding 13 trade days again you get may 22 ( a monday )
( 12 would be Friday may 19th )
The high on march 1 plus 34 trade days was the april 19th low
34 trade days from the march 15th high is wednesday may 3rd
Id say that if these continue then the last week of sept – first week of
October is going to bring a very important turn in the markets.
ill need to run all these yet i find it very interesting
nuff said
Joe
what i was thinking on Fibonacci yet put onto the chart .
if we get a repeat like the last leg , there is a Fibonacci reason for it .
Im thinking may 2nd 3rd is a low yet noted on the chart im unsure.
it all lines up for the may 18-22nd low .
a bit to perfect mind you yet i did the math .
http://imgur.com/FEQOsfo
Yesterdays high was a triple daily fibonacci timeline which i also mentioned the hourly timelines which ran into the second hour of the day .
the exact high of the day was just 2 minutes shy of the 2 hour mark .
i find this amazing .
ALEX………. where the bejesus are you hiding ALEX!!!!……. take a look alex
https://invst.ly/3u6ab RUT close up
https://invst.ly/3u6ci RUT “back of the bus”…..wider view
since wave 3 of C of the final move in the RUT broadening top was about 3.618% extension of wave 1, that will mean that if wave c of 4 retraces back 38.2% – and “IF” the wave 1=wave5 [when wave 3 extends] holds – it would mean wave 5 would fail to make a ‘new’ high……………………
ALEX CAN YOU PLEASE TELL THE CLASS – WHAT IT IS CALLED WHEN WAVE 5 “FAILS” TO MAKE A NEW HIGH ABOVE WAVE 3 — YES THAT IS CORRECT ALEX, ITS CALLED ‘TRUNCATION!!!”””….THERE IS A NICE BOTTLE OF VODKA FOR YOU WAITING IN “DETENTION”……………………………………….. :-))) WAAAAHOOOOOOOOoooooo!
….were the heck did i stash that case of >…..”MERRY MINTS!”….
but…but professor – ? we didn’t truncate anything yet…
…ok – alex – “what if’s” and “fantasy” counts are absolutely and completely and scientifically VALID!!! [just ask Goldman Sachs/Al Gore and their “carbon heats the world – Global warming fear porn……. so pay us a carbon tax for being alive – NOW!!”””……]
now do you WANT your vodka – or NOT!!!………
TZA 30 min 3 day chart looking like a “Cup and Handle” for the inverse RUT.
Tweezers be tweezing:) Looks like a small W2 is done and we should resume heading lower on SPX.
That’s all for now.. lolol
jody,
ummm……. “we” – [and when i say “we”, i mean “me” and your Mr. Brownie teddy bear]…. “WE” are concerned by your ……ahhh….”tweezing” comments……. for example – “tweezers be tweezing” [cough]. ……… is that in anyway associated with “two pipers piping”??……. do “WE” need, in anyway, to do a language “intervention”??
does this new “language” have anything to do with
‘How To Fill In, Shape, Trim, And Transform Your Eyebrows” :-))
Luri
Your chart is nice but the labelling is wrong.
Subwaves of a diagonal are always corrective.
Wave four almost always goes into the area of the previous forth which is not the case in your labelling
Peter, in you ES example above, wave 1 was approximately 2 month time interval. Does that mean we are looking at a wave 5 lasting 3.2 months? That would be 2 x 1.618, correct?
Jeff,
Well, kinda. I haven’t spend a lot of time on EW timing, but you’d kinda think that. The other issue is that I see this as a corrective pattern up and so the final wave has fewer “rules,” if any. I think we’re going to hang in here until September, but it’s more from timing the US dollar than the US market.
Peter, historically what’s the “external reason” publicized for the start of a bear market? I mean, the “real world outside” one.
Atlanta FED keeps slashing the GDP every 2 hours – today to 0,2
World growth it’s not in question, there is no foreseeable one, not for a long time.
What worse data the market needs to come to its senses?
Has there ever been a market so detached from economic data? And if yes, why? 🙂 I would love your opinion, thx!
I don’t know that there’s a publicized one, because typically, “nobody saw it coming.” Even in retrospect, there’s no agreement on what causes it. In 1929, the Fed raised interest rates and so that’s one thing that comes to the surface. Another is PE multiples. But nobody every publicizes the real, underlying reasons, I don’t think.
Markets are always detached from economic data at the time. That’s what my research tells me. However, this is the largest bubble by far, and the first 500 year market top where we’ve had flowing data on markets (and the internet) so the ongoing fallout is much more intense (in reality and also in what’s communicated).
In terms of the why, I dunno, greed is blind. People herd. There are more people in the market than ever before because we’ve made it so accessible and it’s been so hyped. There are a lot of things the today’s society has leveraged to what seems like a bigger disconnect. We simply didn’t have the communication systems in place for anything before the 60s.
Thx Peter! I was aware of the non-correlation between markets and economics. It’s the inverse correlation that’s baffling me. Today we have Japan calling for evacuation for nuclear threats, secretary Kelly not sleeping at night for fake-electronics bombs in planes, the Atlanta FED revising GDP to 0,2, possible government shutdown tomorrow and the market keeps grinding like nothing happened…
Alex
Just a thought ,
think of the stock market as a collective of the heard and in a way
religion and blind faith . As long as everyone believes the markets
will continue to go forever higher and that the fed , gov etc will bail
it out they will continue to be buyers . The same thinking is what
brought in the home buyers in 2005-2006.
Back then i had a house for sale and i had not seen so many first time
buyers before. they finally caved and bought only to have there heads handed
to them . The same thing will happen with the stock market .
in the end its about CONFIDENCE.
There is an odd guideline ive watched from a distance with interest rates
and the stock markets . when you see interest rates go to a new 4 year high
for some reason stocks tend to top out .( i have not researched this in depth )
TYX ( 30 yr rates ) High in 2007 was 5.4 %, early 2010 4.85 % late 2013 early 2014
rates were 3.97 % . it is not going to take a huge move in interest rates to play
hell with the usa debt .
On another note id keep my eyes on pensions, for starters id keep up on
Central States Pension Fund, If they bail out that fund it will wipe out the gov pension guarantee corp . you can also read about what happened to those
in the teamsters local 707 in Feb 2017 .
My point being in this case unlike other cases when the pensions begin to fail
id expect it to put pressure on peoples confidence in the system.
when the confidence turns down , spending will drop and the downward spiral
will end up in the stock market .
That is what i think will trigger this bear market .
I remain quite curious about that apparent early exit from what appeared to be a perfectly normal symmetrical triangle formation with that ridiculously short E wave. Triangles are not know for being hasty by any means. What if a larger triangle was developing?!
verne
My thinking is the same as yours .
im watching the oex , i find it odd the market has stalled
after seeing the dow spx and nya all poking above their
march 15th and 16th highs the oex did not .
im considering all of this a B wave high .
Im sitting out today and not trading until next week.
Joe
verne
in regards to triangles , i watch for the overlaps
if you look at the diagrams you will see that each
individual leg will overlap the previous B wave
all being a b c moves .
for me this is the X wave or the B wave .
im undecided as to which .
Lastly in regards to triangles
Wave C can break below the wave A low.
So a flat or a triangle cannot be ruled out
if we see a further sell off next week .
Joe
jody,
what the heck is up with the spx?? the rut is following nicely – but that spx….???
https://invst.ly/3uh36
Yes the Cup and handle is playing out perfectly! Congrats..
SPX looks like a 5 wave down 3 wave up and now heading lower as I was expecting.
Just slow though..
The Tweezer top still in play.. I know some folk are not familiar with it but it is a pretty powerful reversal.. That is why I was like WHAT! LONG?? haha!
“h” Pattern set up on the SPX happening right now..
Not to be confused with the H&S. Head & Shoulders pattern is NOT an “h” pattern.
Just need a few more ticks lower….
Declines choppy and overlapping and looking like the banksters are still in control. We may have another push to the upside before we actually get a real live correction. Nothing to do but scalp the chop. Looking for triple Qs to close gap around 135. 75 for quick scalp.
BUT…but…MASTER! Don’t you see it’s a truncated V on SPX? BE WARNED!!
The leg down into yesterdays lows looks to be an A wave
in what was a 3 wave move.
yesterdays late day bounce went back to wave iv of wave 3
from that point everything is very sloppy
Todays lows might be a B wave low or we are going to see
a triangle form , if so the triangle began at yesterdays late day high .
a move back to 21001.49 would be ideal for a developing triangle
B wave with further downside once complete .
That said my overall thinking is expect surprises to the downside
maybe its just a sideways trend for the rest of the day ??
the fireworks should be next week as i see it .
A B C into yesterdays lows . ( 1 2-i ii-iii-iv-v 3 )
today is sloppy (not a 4-5 )
Cleaning up my thoughts
yesterdays late day high would be the wave A of some sort
today’s low a B wave low of some sort and we are in a C wave
of some sort .
there is other potential waves yet that is what im seeing .
its very sloppy .
i see no reason to trade the variables at this juncture
lastly ( yes really 🙂
yesterday wave A completed
how this B wave completes im open to it .
Joe,
ask Kevin Henry from the FED of NY what the hell he is doing or call Citadel to stop bump and jump
80 years ago Mercury turned retro 4/30. This is a Bayer rule. This will bring a high Monday. I also see a low Monday. Tuesday is a very strong day. My berg indicator gives 4 or 5 hits; something I see rarely. We also see Hc mercury conjunct Venus. As Mercury is moving away from the sun it’s impact will be limited. Still, Mercury plus Venus is stronger than Venus alone. So this will cause a peak in the tidal pull on the sun. This should bring a high. See more extremes that day. The 60 metonic year cycle (vedic) gives a high 5/2. The 100 year cycle a low 5/1.
I expect volatility to increase next week. 5/18 will be a low. But next weekend will bring capitulation. 4/25 was a significant date and european markets reacted to that. A 7 day overthrow will bring us to 5/2. This should cause some kind of sell off.
But 4 and 5 are also strong so the market needs to test these dates. But so a bigger move is expected later in the week. 5/8 will be a low. The 5/11 is tested before we dive into 18.
Time is running out. Next week should bring more fun than last week. May the Feds have a little surprise for us.
If my analysis is correct the jobreport will disappoint big time.
André
Andre’,
Thank you for the update! My interpretation of what you just posted is …”We are rolling over!” You say Monday will bring a high…but then say…Tuesday is a very “strong” day.
To me strong=up…My question…Is Tuesday a “strong up day” or does it have “strong vibrations”? Meaning we could be down! Again, just attempting to understand!
Ed,
I said I expect a high and a low Monday. So Tuesday will be a high again and a very significant one. Strong to me means that the date is significant and something is bound to happen.
Thanks …andre ….nick
Thanks André / Ed
Andre
as you look out past October 2017 what do you see ???
I only ask that question for 1 reason .
Everyone ( a lot of people ) have come to the conclusion that
the years 2021-2023 are depression like lows . I have come to
that conclusion myself and i think you have as well .
im going to leave that open going forward and try not to be biased .
Another thing i noticed is this , they can now print houses using a 3 D
printer . They can print the wall assemblies and individual pieces
for 400 sq ft in 8 hours time.
Technology is driving Deflation.
In my neck of the woods home prices are getting stronger ( relatively stronger)
I gave myself until the year 2018 to decide on selling . I decided this in the year 2009 when i bought the house. Its based on the movement of people out of
California and up the west coast. I have yet to see that movement of people
yet if this does come to fruition then it will be the 3rd time in my life i have profited from this cycle.
My Gut tells me something is a miss is all and that we should all
sell ourselves on what we think vs what we see.
I used to sit my daughter on my lap when she was about 2 yrs old and id
ask her which direction she thought the stock market was going to go .
she would always go with the trend .
taking that point of view id say this is what i see.
1907 JP Morgan provided liquidity to the market near its lows
1987 we got the same thing with the FED
2007-2009 we got the tarp, bail outs etc .
Now its negative interest rates which are killing pensions
Next its tax cuts and protectionist type policies .
All these things have extended the cycle and yet the Debt has grown.
We are not going to see a booming construction cycle or a booming
steel industry, agriculture at best provides just enough . The internet
of things everyone is thinking of as the future makes sense but will it
really happen ??? we have the paranoid policies around the world where
we are being watched yet despite it all those policies have yet to catch
even 1 terrorist . They fear a run on the banks so want to go cashless
and also want to track our financial transactions to tax us .
Going to war is just a distraction from what is really going on which is
governments around the world are scrambling to hang onto some relevance
Now is the time to step back and with innocent un opinionated eyes
take a look at the forest.
Elliot wave theory is based on social mood . Social mood swings can be seen
in the stock markets around the world . id say faith in government has turned down yet it hasn’t completely done that. we have a 50 50 split here in the usa.
those who want to be taken care of vs those who actually go out and work.
yet technology is removing jobs which appears to be a big deal so lets blame
the Mexicans lol. our population here in the USA is going to shrink as the baby boom generation retires and dies off . The wall ? if it actually cuts down on
drugs being smuggled then its not such a bad thing yet that wall also keeps us from being able to leave . We are all being imprisoned all over the world .
want to go ? have your papers in order . I am not against trump and i actually support some of the things he is doing . In the end though i feel as if we are
all walking down a dead end street .
i was a commercial fisherman for 23 years , when it got to the point when there was no next fishery i had to take a good hard look at it and my decision was its time to go . The ocean towing business is not a growing industry .
everything is becoming or has become utilized or sustainable at best.
there is no growth really anywhere. A good example of this is bill gates .
He has continued to be the wealthiest man in the world ( many years but not every year ) . If we really had growth this would not be the case.
in the usa, annual GDP tends to move with the sunspot cycle .
If this continues to hold true then there is no way we can avoid deflation.
demographics added to this only adds to deflation .
add debt to it ???
lastly : it seems to me that we get the right person at the right time .
Bernanke brought us helicopter money .’
Trump puts out a best seller at the top of the cycle and is in bankruptcy
court at the bottom of the cycle .
Trump winning the election id say is the best seller
Restructuring of the debt is what id view as poetic.
The repercussions of that restructuring will be felt for decades.
The tax plan will help in the short term but in the long term
its just another stimulus plan no different than any of the others.
The cycle will end and there wont be anything left
Higher interest rates will not effect the average person on a personal
basis .
higher interest rates will explode government debts and because of that
it will drive taxes higher and higher taxes ( property taxes etc… )
I think all of these things combined will cause people to move
and if the cycle shows up again i will see people moving out of California
and up the west coast in the coming year or 2 .
The end is nigh
Look at this tax plan carefully — It is an Obamacare disaster in disguise for the average individual. No working class citizen or top bracket earner knew how bad they were screwed by Obamacare until the premium increases showed up.
Trump is proposing no deduction for state/local tax from federal tax. Simple math says in a state like CA with a 13% state tax, the top bracket will not be paying 4.6% less, but 9% MORE (that’s total dollars out of an average Joe Blow’s pocket, not just fed taxes).
So, we have the Fed Govt taking in less revenue and the biggest tax payers paying more out of their own pocket.
Like Obamacare, the ONLY folks who benefit from this will be zero to low income, or big corps, which get a break on the corp side.
As you pointed out, taxes on everything else (including property tax) will rise and have already started to here in CA. Property tax is ridiculous, it doesn’t make sense to buy anything long-term. You will pay the full purchase price of your home AGAIN in less than 75 years. Keep this in mind if you plan on living in it long-term or passing it on to kids.
There are only 7 states where top payers will keep 4.6% more of their money, 2-3 where it will be a wash, and the rest negative.
How long will it take people to figure this out?
The #1 reason I wanted Trump was tax reform. I’ll have buyers remorse if this passes. Almost seems like it was written by a Democrat.
Yes, mass exodus coming out of CA soon. I was considering it anyway.
I really enjoy reading the comments on the forum but I have to confess some of the posts leave me a bit baffled. Is it my ignorance of cycles that leaves me bewildered about the talk of “lows” and “highs” and “strong days”??!
I read these comments and find myself repeatedly wondering: “Compared to What??!!”
I guess what I am trying to ask is if these comments have anything to do with EW or am I mistaken in that assumption? Thanks in advance for any clarification anyone can give. I realize I could be out of my depth here and that is O.K. In that event I will simply pay attention to more run of the mill TA commentary!
Joe,
I believe that everything we witness is an expression of an underlying vibration. The QE program was not the cause of the problem; it was required to bring things to an end. We are all slaves to the rhythm; even the feds. So we need to seperate causes from symptoms.
What I see? I see a low in 2022 but have doubts it will be the last low. One scenario is we will see a high 2025-6 and then down again into 2032.
Predicting the future is not easy. But I believe vibrations/cycles/waves are unstopable like the planets; they go on and on throught eternity. All we have to do is identify them.
I am currently working on numerology as numbers are vibrations (Pythagoras). Will write about this for a bit tomorrow.
Hope this answers your question.
Cheers,
André
i have not read the latest on trumps tax plan yet i did do some research
early on and for me it would become a tax cut . the problem with his tax plan though to me is once the other deductions are removed and after trump leaves office the risk is that next administration just raises the tax rates back up.
Obamacare can get changed ( it is ) what will stop trumps tax plans from changing in the future.
Here in Oregon they are already trying to go around the property tax laws
and creating new ways to raise property taxes ( they want to double them )
I try not to get to exited over any proposals . its the final draft that they actually
pass that i will dig into in depth .
It doesn’t really matter in the end because the trend will drive the end result .
they can raise my cost of living by raising taxes and ill just have less to spend
which will lower someone else s income or cost someone a job which will lower
the actual tax revenue received.
The other thing i am wondering about is will we all be better off becoming
our own corporations ???? however the actual tax plan ends up there is bound
to be ways around it , there always is .
In the coming great bond default, I am afraid home ownership is going to become an awful trap for a lot of folk. Government is an insatiable beast, and will stop at nothing to satiate its voracious appetite for revenue. When the bond market dries up, and municipalities have to declare bankruptcy, they are going to respond by doubling and tripling taxes on really the only captive audience they have – homeowners! Homeowners are going to find themselves in the untenable position of facing declining property value in the coming real estate bust, yet skyrocketing tax assessments as local governments desperately try to replace revenue loss due to a deepening recession. National property tax revenues this year have already risen to record levels and we are not even officially in a recession as yet. This is going to become an awful tragedy as many may be forced to walk away from their homes and the local governments will happily auction off the tax liens to the highest bidder. Governments would rather resort to outright theft of the property of citizens rather than tighten their own belts…sad!
Andre
thanks for the comment , i see things similar to you
Verne
lows and highs, turn dates etc… are not elliot wave thinking
they are more cycles type thinking of different degrees.
my issue very short term is what would this present short term
pull back be and how does it relate to say andre’s monday is a high and a low ?
are we seeing a very minor wave iv of some degree ???
i tend to leave the wave counts on this blog to peter so i don’t distract
from his views .
Mike
i did a very quick search ” Trumps latest tax plan” by just looking at the search
results i see the media bias. abc,cnn,cbs etc have a negative tone to the headlines fox a positive tone and that was a very quick search .
i think it is much to soon to read into the good side or bad sides based
on other opinions
what i did prior was to run the actual numbers based on my income etc…
and i found it to be a tax cut for me . how this actually works out i cannot make any claims because we don’t have any final tax plan in place .
republicans so the web says are already having problems with the state and local tax deductions being taken out .
we don’t really know the truth until its a done deal .
or as Nancy would say, we need to pass the bill before we can see whats inside it ?
im joking but serious
i trust this guy , he does actual research
http://www.financialsensenewshour.com/broadcast/fsn2017-0424-1.mp3
Bullish until Monday. Will sell if market is up on Monday. Next 10 days should be bearish (Fed Tues, Wed; post perigee; post New Moon; north declination on 30th).
Valley,
Where did you get your background in planetary influences? What do subscribe to?
Trying to get further along the educational curve! Heck, I am really not on the “curve” yet! Thanks in advance!
Self taught. Lots of resources on line.
very long term and premature Fibonacci month
May 1970 low plus 610 months = March 2021
Oct 1989 High ( not a huge high but a high ) plus 377=March 2021
Sept 2001 ( Panic low ) Plus 234 ( 1 off of 233 ) = March 2021
March 2009 Low Plus 144 = March 2021 .
Using Years
2000 high plus 21 yrs = 2021
1987 plus 34 = 2021
1966 Plus 55 = 2021
1932 Plus 89 = 2021
1877 Plus 144=2021 ( presidents compromise of 1877 )
1788 plus 233 = 2021 ( 1787-1788 stock market crashed ? )
1644 plus 377 = 2021 ( End of the Ming dynasty )
1411 Plus 610 = 2021 ( Unknown )
1034 Plus 987 = 2021 (Unknown but , the yellow river flooded in china
The flood was recorded as reducing the revenues of the northern provinces by half, damage that had not been repaired before the even-larger 1048 flood at Shanghu again devastated the area )
id say fibonacii will play a role in the year 2021 .
Sept 3 1929 to july 5 1932 ( might be a day or 2 off ) 1036 days
also 2 years 10 months and 2 days
keeping it simple .
march 10 ( a total guess ) in the year 2021
minus 1036 days = May 9 2018 .
ive mentioned before june 12 2018 as well as the month of july 2018
as a potential counter trend swing high yet it could also
be the high .
Strange but this is all pointing to the year 2018 as important .
Ill bet the mid term elections get very ugly
Keep in mind we have an election in Late 2020
so this kind of fits as well .
1876 Plus 144 is 2020 and another fib related to the elections
and the democrats are once again trying to regain control.
Immediately after the presidential election of 1876, it became clear that the outcome of the race hinged largely on disputed returns from Florida, Louisiana and South Carolina–the only three states in the South with Reconstruction-era Republican governments still in power. As a bipartisan congressional commission debated over the outcome early in 1877, allies of the Republican Party candidate Rutherford Hayes met in secret with moderate southern Democrats in order to negotiate acceptance of Hayes’ election. The Democrats agreed not to block Hayes’ victory on the condition that Republicans withdraw all federal troops from the South, thus consolidating Democratic control over the region. As a result of the so-called Compromise of 1877 (or Compromise of 1876), Florida, Louisiana and South Carolina became Democratic once again, effectively marking the end of the Reconstruction era.
A new post is live at: https://worldcyclesinstitute.com/elliott-waves-the-right-look/
This website is for educational purposes relating to Elliott Wave, natural cycles, and the Quantum Revolution (Great Awakening). I welcome questions or comments about any of these subjects. Due to a heavy schedule, I may not have the time to answer questions that relate to my area of expertise.
I reserve the right to remove any comment that is deemed negative, is unhelpful, or off-topic. Such comments may be removed.
Want to comment? You need to be logged in to comment. You can register here.